Eurozone Current Account deficit almost doubles in September

By CountingPips.com

The Eurozone’s current account deficit widened sharply in September, according to the latest report from the European Central Bank.  The current account data registered a deficit of 13.1 billion euros in September following a deficit of 6.9 billion euros in August. The widening of the deficit occurred because of rising deficits in current transfers and income and despite higher surpluses in goods and services.

The deficit in current transfers rose to 11.3 billion euros in September while the income deficit increased to 5.5 billion euros. August’s data had recorded deficits of 8.5 billion euros in current transfers and 1.3 billion euros in income.

The Eurozone had rising surpluses in goods by 1.8 billion euros and services by 1.8 billion euros in September following surpluses in goods by 0.9 billion euros and in services by 1.5 billion euros in August.

On an annual basis, the Eurozone current account deficit was 46.3 billion euros (0.5% of GDP) from September 2009 to September 2010 following a 91.0 billion euros deficit the previous year.

Forex, Stocks, Bonds, Gold – Markets & Dollar reverse direction!

By Chris Vermeulen, GoldAndOilGuy.com.

There have been some major trend changes recently and it looks as though more investments are about to follow. The real question though is… Are You Ready To Take Advantage Of It?

It has been an exciting ride to say the least with the equities and metals bull market and the plummeting dollar. But it looks as though their time is up, or at least for a few weeks. Traders and investors will slowly pull money off the table to lock in gains or cut losses and re-evaluate the overall market condition before stepping back up to the plate and taking another swing.

Below are a few charts showing some possible money making trade ideas in the weeks ahead.

TBT 20+ Treasury Note Inverse Fund

This fund moves inverse to the price of the 20yr T.N’s also known as bonds. Looking at the chart you can see the recent reversal which took place. We had a great entry point shortly after this reversal took place using my low risk setup strategy.

Falling bond prices are considered to have a negative impact on equities because it implies that interest rates may start rising which means more investors will pull money out of stocks and put that money into a safe interest earning investment. You will typically see bonds change direction before equities. That being said the chart below is an inverse fund, so when this bond fund goes up, it means actually indicates bond yields are falling. I will admit these inverse funds really throw my brain for a loop at time… I prefer the good old days, buying long and selling short… so simple and clean…

UUP – US Dollar Index Fund

This fund moves with the dollar and allows equities traders to take advantage of currency trading. This chart below shows a possible trend reversal for the dollar. If the dollar continues to rally then it’s also a good sign that interest rates could be rising in the near future and it also means more downward pressure on equities.

SDS – Inverse SP500 Index Fund

These bear funds make it possible for traders and investors to profit from a falling market using a regular buy and sell strategy. They can also be traded in retirement accounts making them a golden investment for those willing to play a falling market.

This chart moves the same as the SP500 index only flipped. As the SP500 falls this fund rallies.

The strategy we just used to play the recent rally is the same strategy we will use during a bear market, but instead of trading the SPY, we are trading this fund.

It is important to note that while bull market rallies tend to drag out; bear markets typically have faster movements. Fear is much more powerful than greed which is why the stock market drops quicker than it goes up.

GLD – Gold Exchange Traded Fund

Gold also looks to be topping and could actually be starting to form a Head & Shoulders reversal pattern.

Mid-Week Trend Trading Conclusion:

In short, understanding inter-market analysis is crucial for traders/investors to know. Not understanding how they affect one other can be very costly in the long run. Remember that volatility and volume rise together at the end of a trend. You can view the recent volatility index (VIX) to see its price action also. Volatility changes also make for great low risk options trades if options are your thing. Focus on trading with the trend, bounces in a down trend are typically muted or trade sideways making is very difficult to make money buying in a falling stock market.

Get My Daily Pre-Market Trading Analysis Videos, Intraday Updates & Trade Alerts Here:  www.GoldAndOilGuy.com

Chris Vermeulen

UK Retail Sales rise for first time in 3 months in October

By CountingPips.com

Retail sales data released today out of the United Kingdom showed that sales rose by slightly more than expected in October. The UK retail sales data, released by the U.K. Office of National Statistics, advanced by 0.5 percent in October following a decrease of 0.5 percent in September. October’s rebound in retail sales marks the first positive reading in three months.

On an annual basis, retail sales decreased by 0.1 percent from the October 2009 time period. The sales data just surpassed monthly market forecasts, which were predicting that sales would increase by 0.4 percent.

Retail sales, excluding automotive fuel, increased by 0.3 percent in October after registering a 0.3 percent decrease in September. Sales minus fuel was above market forecasts that were expecting a 0.2 percent rise for the month.

Forex daily analysis: 18-11-2010

AUD/USD

Daily graph: http://www.real-forex.com/charts-daily/November2010/AUD_DAILY_181110.JPG

Following an uptrend, which lasted for several months, the pair began to decrease back a few sessions ago by crossing a support level at 1.0002 and clearly closing below it. The double bottom (two daily candle having the same bottom) appeared with the candles of the two last sessions describes the end of the decreasing trend.

Currently, there is a basis for a new uptrend to begin, creating the opportunity for a nice and profitable “Long” transaction. This opportunity requires a confirmation by the identification of an increasing configuration on 1H graph.

Potential trade

One-Hour graph: http://www.real-forex.com/charts-daily/November2010/AUD_1H_181110.JPG

The required configuration should appear once the 1H resistance of 0.9835 will be crossed upward. After the identification, an adapted order can be entered.

–       “Limit” order on “Long” position 10 pips above the mentioned resistance, meaning 0.9845.

–       “Stop Loss” order on the last dip occurred, meaning 0.9794

–       1st degree to “Take Profit” is on the following resistance: 0.9870

USD/CAD

Daily graph: http://www.real-forex.com/charts-daily/November2010/CAD_DAILY_181110.JPG

After the pair reached the parity level (1USD = 1 CAD) as a support, it reversed and started to increase back about a week ago.  On a larger view, it seems that the pair is navigating for several months already and doesn’t look like it has any specific trend.

Currently, the pair is making its way to the higher level of the navigation: the resistance of 1.0341.

Once the resistance will be reached, there are two possible outcomes:

1.      The resistance is crossed upward and is closing above it. In this case, it should be better waiting for a technical correction, looking for an increasing configuration on 1H graph, and enter your order accordingly.

2.      If the pair is stopped on the resistance, a “parking” for about a session and a half should confirm the fact the pair is based on the level and will not cross it. A reversing trend could be the result of such a stop; creating an opportunity to go “Short” after the identification of a decreasing configuration on 1H graph.

Have a profitable day!

Real-Forex team.

Sponsored by Real-Forex |

Crude Oil Slips on Firmer Dollar

By Anton Eljwizat

The Oil prices are once again dropping, and it is currently traded around $82 level. However, there is much technical data that supports a bullish move for today as described below. Forex traders involved with commodities like this can take advantage of this knowledge by going long on Crude Oil now, and at a great entry price!

• Below is the 8-hour chart of the Crude oil.

• The technical indicators used are the Slow Stochastic, Relative Strength Index (RSI) and MACD.

• Point 1: The Slow Stochastic shows a bullish cross, signaling that the next move may be in an upward direction.

• Point 2: The Relative Strength Index (RSI) indicates that the price of this cross currently floats in the oversold territory, signaling upward pressure.

• Point 3: The MACD indicates an impending bullish cross, which may signal a upward movement is going to occur in the near future.

• The volatile downward movement which occurred prior to this upward correction has generated these indicators, and there appears to be room for this correction to continue.

Crude Oil 8-Hour Chart

Forex Market Analysis provided by ForexYard.

© 2006 by FxYard Ltd

Disclaimer: Trading Foreign Exchange carries a high level of risk and may not be suitable for all investors. There is a possibility that you could sustain a loss of all of your investment and therefore you should not invest money that you cannot afford to lose. You should be aware of all the risks associated with Foreign Exchange trading.

Forex Daily Market Commentary

By GCI Forex Research

Fundamental Outlook at 0800 GMT (EDT + 0400)

USD

The dollar weakened broadly during the Asia session, as the market looked back on yesterday’s weak US CPI report, and ahead to the arrival of a delegation of EU, IMF and ECB officials in Dublin today. The market is coming around to the view that an Irish bailout could eventually be on the cards, but the Irish government still insists that this is not inevitable. EURUSD traded 1.3511-1.3608 and USDJPY 83.11-83.40. Asian equities were also stronger after the S&P 500 finished flat. US core CPI in October was flat m/m for the third consecutive month (cons: +0.1%), but the annualized figure was more striking, showing a feeble rise of just +0.6% y/y. This was the slowest pace of growth in the history of the survey, which dates from 1957, and goes some way to justifying the latest FOMC decision to launch a new round of quantitative easing. In addition, October housing starts were also much weaker than expected, falling to an annual rate of only 519k (cons: 598k).
EUR

While Ireland has not asked for a bailout, consultations with the IMF, the ECB, and the European Commission are due to begin in Dublin today. EU Commissioner Rehn has said that these talks can be regarded as preparation for a potential aid program for Ireland, should it be necessary.
A major London-based clearing house increased the margin it requires for holding Irish government bonds to 30%, adding further pressures to Ireland.
GBP

As expected, the BoE minutes from the Nov. 4 policy meeting showed an 8-1 vote split on both QE and interest rates. MPC member Posen voted again for £50 bn in fresh QE, while MPC member Sentance wanted a +25bp rate hike.
AUD

RBA Deputy Governor Battellino said that, although the strong AUD is helpful for the economy overall, it is hurting the tourism industry. He noted the strength of the AUD is a natural result of the boom in commodity resources, implying that he felt it is justified by economic fundamentals.
Average weekly wages in Australia grew at a slower than expected pace in August, rising only +4.5% y/y (cons. 5.4%, prev. 5.3%).

TECHNICAL OUTLOOK

EURGBP 0.8449 support.
EURUSD BEARISH Move below 1.3363 would expose 1.3265. Resistance at 1.3777 ahead of 1.4282.
USDJPY BULLISH Focus on 83.99, only a break above 85.93 would confirm a bull trend. Initial support at 82.40 ahead of 81.66 reaction low.
GBPUSD NEUTRAL 1.6379 and 1.5651 mark the near-term directional triggers.
USDCHF BULLISH Rise above 0.9972 has exposed 1.0183. Near-term support at 0.9829.
AUDUSD BEARISH Look for a break below 0.9652 for confirmation of bear trend. Initial resistance at 1.0183.
USDCAD NEUTRAL While resistance at 1.0380 holds, support comes in at 1.0070 ahead of 0.9931.
EURCHF BEARISH Focus is on 1.3229; a break here would expose 1.3072 and 1.2766 next. Only a push above 1.3834 would put odds against the ongoing trend.
EURGBP BEARISH Sell-off from 0.8942 found support at 0.8449. Next support at 0.8390.
EURJPY BEARISH Remains heavy below 115.68; break of 111.05 reaction low would expose 107.73.

Forex Daily Market Commentary provided by GCI Financial Ltd.

GCI Financial Ltd (”GCI”) is a regulated securities and commodities trading firm, specializing in online Foreign Exchange (”Forex”) brokerage. GCI executes billions of dollars per month in foreign exchange transactions alone. In addition to Forex, GCI is a primary market maker in Contracts for Difference (”CFDs”) on shares, indices and futures, and offers one of the fastest growing online CFD trading services. GCI has over 10,000 clients worldwide, including individual traders, institutions, and money managers. GCI provides an advanced, secure, and comprehensive online trading system. Client funds are insured and held in a separate customer account. In addition, GCI Financial Ltd maintains Net Capital in excess of minimum regulatory requirements.

DISCLAIMER: GCI’s Daily Market Commentary is provided for informational purposes only. The information contained in these reports is gathered from reputable news sources and is not intended to be U.S.ed as investment advice. GCI assumes no responsibility or liability from gains or losses incurred by the information herein contained.

Ireland in Bailout Negotiations with EU/IMF Delegation

By Russell Glaser – Headlines today are reporting a joint EU/IMF proposal to save the Irish banking system in order to prevent a spread of panic to the rest of the euro zone. This is despite public statements from the Irish government that is determined not to cede control over its finances to outside influences. The bailout may be enough to prop up Ireland but may not save periphery Europe from further contagion problems which would be a negative for the euro.

A packaged deal by the EU/IMF to support the collapsing Irish banking system is being strung together in negotiations with Irish government officials.

The EU/IMF bailout would come on top of the already 50 billion euros ($67 billion) aid package the Irish government has pledged to prop up its banking system. The largest Irish banks are crumbling due to poor performing property loans. Officials are currently examining the finances of Irelands banking system to identify those banks that will need more funding as the EU/IMF is of the opinion that the present Irish bailout plan will not be sufficient.

However, the 750 billion euro EU funding mechanism for member states is designed to be activated once a state requests aid. Ireland has been adamant in its refusal to accept outside aid while ceding control of their financial destiny. The EU/IMF has an interest in arriving at a deal with Ireland to prevent contagion. The longer the crisis carries on, the greater the chance market fears will spread to other EU periphery states such as Spain, Italy, and Greece.

Should the Irish banking/debt crisis carry on it will weigh on the EU and be a negative for the euro.

Technical studies suggest the EUR/USD is in line for a bearish correction with the next price target for the pair resting at 1.3270. Traders should remember the previous fiscal crisis with Greece led to the EUR/USD trading as low as 1.1875.

Forex Market Analysis provided by ForexYard.

© 2006 by FxYard Ltd

Disclaimer: Trading Foreign Exchange carries a high level of risk and may not be suitable for all investors. There is a possibility that you could sustain a loss of all of your investment and therefore you should not invest money that you cannot afford to lose. You should be aware of all the risks associated with Foreign Exchange trading.

Irish Debt Crisis Remains the Center of Attention

Source: ForexYard

Slight optimism is apparent in the markets this morning as European Union and International Monetary Fund officials travel to Dublin to discuss a possible aid package for the nation’s troubled banking sector. The Irish debt crisis is expected to be the center of attention for the rest of the week and traders are strongly advised to follow any developments from the region.

Economic News

USD – USD Falls on Negative Economic Data

The dollar declined versus the euro for the first time in 3 days after week economic data bolstered the Federal Reserves’ decision to buy $600 billion in bonds.

The greenback dropped against 13 of its 16 most-traded counterparts after a report showed U.S. Core CPI had the lowest annual increase on record. This result helps defend the Fed’s asset-purchase program against the growing criticism it’s been receiving from both home and abroad. Building starts data released also showed a decline, pressuring the currency further.

The dollar weakened to $1.3529 at the end of trading in New York, from $1.3489 Tuesday, when it touched $1.3448, the strongest level since Sept. 28. It is currently trading around $1.3590. The greenback stayed relatively unchanged versus the yen and is currently trading around 83.28.

The dollar negative trend may continue today as well as the Unemployment Claims report expected today at 13:30 GMT will likely show the number of Americans filing initial jobless claims increased by 7,000 last week. Along with the unemployment data traders are advised to follow the release of the Philly Fed Manufacturing Index at 15:00 GMT.

EUR – EUR Recovers from 7-Week Low

The euro recovered from a 7-week low versus the greenback after surprisingly weak U.S. economic data defended the Fed’s recent decision to embark on further stimulus efforts. The euro also benefited as talks of European support for debt-laden Ireland calmed the markets and reduced demand for the safe heaven dollar.

Despite the modest rise, the common currency continues to trade near a 7-week low versus the USD as investors are eagerly awaiting the resolution of the euro-zone’s recent debt crisis.

The euro was at $1.3590 this morning in Asian trading from $1.3529 in New York yesterday. The euro recovered to 112.95 yen from 112.55 yen.

The Irish debt crisis is likely to set the direction for the EUR for the rest of the week and traders are advised to follow any developments that arise from this region.

JPY – Yen is Steady Despite Dollar Weakness

The yen is mainly unchanged versus the greenback and is currently range trading between 83.00 and 83.50. With the uncertainty over the euro-zone debt crisis on the one hand and the Federal Reserve’s asset buying program on the other the yen remains as a reliable safe haven currency.

The New Zealand and Australian dollars held yesterday’s gains on speculation Ireland will accept aid restoring demand for higher-yielding assets.

New Zealand’s dollar is currently trading at 77.41 U.S. cents from 77.03 cents in New York yesterday when it climbed 0.3 percent. It bought 64.33 yen from 64.10 yen. Australia’s currency rose to 98.40 U.S. cents from 97.97 cents, and 81.85 yen from 81.49 yen.

OIL – Crude Declines on Demand Concerns

Crude-oil futures fell to the lowest level in nearly a month Wednesday despite a surprise drop in U.S. oil and gasoline inventories. The Energy Department said stockpiles dropped 7.3 million barrels last week. However, concern about global demand in light of the current debt crisis in the euro-zone and China’s efforts to cool its economy outweighed the positive data.

Light, sweet crude for December delivery settled $1.90, or 2.3%, lower at $80.44 a barrel on the New York Mercantile Exchange. The spot price did recover during Asian trading session and is currently trading at $81.65 a barrel.

Technical News

EUR/USD

The pair seems to be exhibiting mixed signals. While a bearish cross is seen on the hourly chart’s Slow Stochastic as well as a breach of the upper Bollinger band, the RSI for the pair on the daily chart is heading into the oversold territory while a bullish cross is seen on the 8 hour MACD. Waiting on a clearer direction for the pair may be advised.

GBP/USD

The RSI for the pair is floating in the oversold territory on the 8 hour chart with a fresh bullish cross seen on the chart’s Slow Stochastic. An impending bullish cross can also be seen on the 4 hour MACD. Going long for the day may be advised.

USD/JPY

The pair may be seeing some downward correction today as the RSI for the pair is floating in the overbought territory on the 8 hour and daily chart while a bearish cross is seen on the Slow Stochastic. Going short may be preferred for the day.

USD/CHF

Some downward trend may be expected of the pair today as a bearish cross is evident on the 8 hour and daily charts’ Slow Stochastic while the RSI for the pair is floating in the overbought territory on the 8 hour chart. Going short for the day may be advised.

The Wild Card

Oil

After a sharp downward trend it seems that there is room for some recovery for crude. A bullish cross is evident on the daily and 8 hour Slow Stochastic as well as the 2 hour MACD. The RSI for the pair is floating in the oversold territory on the 4 hour and 8 hour charts. Forex traders are advised to go long for the day.

Forex Market Analysis provided by ForexYard.

© 2006 by FxYard Ltd

Disclaimer: Trading Foreign Exchange carries a high level of risk and may not be suitable for all investors. There is a possibility that you could sustain a loss of all of your investment and therefore you should not invest money that you cannot afford to lose. You should be aware of all the risks associated with Foreign Exchange trading.

Forex Economic Calendar: Thursday, November 18, 2010 – US Initial Jobless Claims

By CountingPips.com

Today’s Important News Releases – November 18, 2010

  • Australia, weekly wages
  • Switzerland, trade balance
  • Switzerland, exports and imports
  • United Kingdom, retail sales
  • Switzerland, ZEW Survey
  • Eurozone, current account
  • Canada, leading indicators
  • United States, initial jobless claims
  • United States, Philadelphia Federal Reserve survey
  • United States, leading indicators

See Full Economic Calendar here

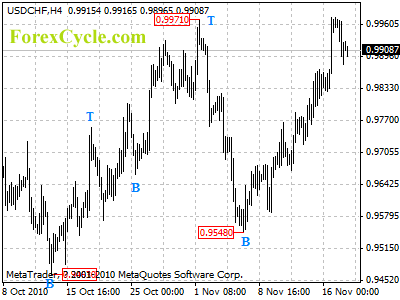
USDCHF pulled back from 0.9975

Being contained by 0.9971 resistance, USDCHF pulled back from 0.9975. Support is at 0.9820, as long as this level holds, uptrend from 0.9548 is expected to continue and another rise to 1.0100 is still possible. However, a breakdown below 0.9820 will indicate that a cycle top has been formed at 0.9975 on 4-hour chart and the rise from 0.9548 has completed, then range trading between 0.9463 and 1.0000 could be seen to follow.

usdchf

Daily Forex Forecast