Fibonacci Forex Trading Systems – Why they Work?

By Chris Donnell

The Fibonacci Forex concept is the crux of numerous successful investment systems, and it is used by a tremendous number of forex professionals. This ancient mathematical concept has spawned huge profits for those adherents who have the required discipline and work ethic to follow it religiously.

Fibonacci was a renowned mathematician who is remembered for his Fibonacci patterns, which is a mathematical sequence with relationships between each number and the sum of the previous two – 1,1,2,3,5,8, etc. However, currency trading is more concerned with the fractional relationships between the values, such as .236, .5,and .382, which are used to indicate critical price levels by defining the likely scope of a price “retracement”, or a move against the direction of the primary trend.

Also, this information is used as a leading indicator, or a predictor of price. Therefore correct use of the Fibonacci principles will enable one to pinpoint important price moves in advance, or in essence to predict the future activity of the futures market in question. Indeed, one can correctly estimate the behavior of the forex futures market!

As an example, the .382 fraction is universally popular among professional forex traders. The wild price swings of the forex futures are easily observed on a price chart, with the attendant extreme highs and lows which typify market behavior. The maximum of an up move is referred to as resistance, the minimum low after a large drop is called support.

The first step is to calculate the distance from top to bottom of the market in your preferred time horizon, such as daily, weekly, monthly, etc. Multiply the result by the established Fibonacci value of .382. If the move in question is an upward trending one, you will then subtract the value from the high of the price move to establish support, and conversely you would add the value to the bottom to find the appropriate resistance level to watch.

Having this data at your fingertips will enable you to put into play an action plan to establish a position with an excellent chance of a trading profit. If you applied the .382 Fibonacci fraction to an upward price move, you will be trying to put in a likely support area for a future increase in price, and if you use the ratio with a decrease i price, you will be establishing a likely support level.

All successful futures trading systems revolve around the key concept of exiting loser trades with little financial damage, and the Fibonacci is no different. The predicted price areas typically work out, and the winners are very lucrative, while the losers are usually small. In fact, all trading, whether futures or equities, requires a mechanism for limiting losses and maximizing profits.

About the Author

Chris Donnell is CEO of LeverageFX.com and developer of one of the most high probability and profitable Forex currency trading system which gives statistically probable entry and exit levels based on cross currency currency comparisons.
A Continuing Discussion of Support and Resistance Implementation in Forex Trading

By Chris Donnell

We previously covered Fibonacci retracements and extensions, pivots, highs and lows, and whole and half numbers (00 and 05). These are all support and resistance concepts. Any decent forex trading system should cover these areas.

We, however, will go beyond those concepts and present such support and resistance strategies as moving averages, the balance point line, trend channels, trading zones, and clusters. Furthermore, the “Once broken, support becomes resistance and resistance becomes support” will be covered as a possibility to include in your forex strategy.

First, we will touch upon the balance point line, designed by a member of “Top Gun Software” who has, remarkably, more than ten years of forex trading experience. It is a proprietary study that looks similar to a moving average, but is a more dynamic forex system indicator. This is a system where the user chooses a certain number of minutes in which they have orders, and the average price is then presented based on that chosen time period. The amount of time can be modified at the users’ discretion. Some of the more common settings are 180 minutes (or 3 hours) and 1440 minutes (or one day). The difference between the balance point line and the moving average is that the former accounts for price activity and volatility.

The moving average is an overview of the average prices in a given number of minutes, hours, or days. As with the balance point line, it is also charted as a line. There are various moving averages that have different mathematical formulas such as exponential and weighted averages.

Balance point line and moving averages are not only areas of support and resistance concepts related to forex trading, but they are also filters. Those, as well as additional filters, will be discussed in subsequent articles.

Next, we will embark on the discussion of trend channels. Traders chart these trend lines, as well. However, they differ in the manner in which they are charted, as trend channels are charted in quadrants. Top Gun Software implements this type of charting. With this charting concept, there are four zones, but only the extreme top line and extreme bottom line can be identified with support and resistance.

Trading Zones are also proprietary and are available to students of Top Gun Software. The advantage is that a thorough analysis is undertaken by a member of the Top Gun team to determine areas where the market is likely to stall or reverse itself. One of these “areas” is another concept of support and resistance worthy of discussing. They are called “clusters.”

Clusters are characterized by several different concepts of support and resistance that actually overlap. Imagine looking at a number of the separate concepts. If you find, for example, a monthly R1 pivot, a simple 20 period daily moving average, and a Fibonacci extension all within close proximity, that could be considered a cluster. This could represent an opportunity, as it could very likely be a “Trading Zone.” The market often stalls or reverses in such an area.

Now let’s take a look at the familiar “Once broken, support becomes resistance and resistance becomes support” concept which is fundamental to many forex trading strategies. A classic example of this idea is when the market is projecting upward, then hits an area of resistance, perhaps several times, then breaks beyond that area of resistance. It may then return down to that area, bounce off of it, and continue to climb higher. This is representative of a time in which the market may have broken an area of resistance, and that resistance acted as support.

To review, we have reflected upon the balance point line, moving averages, trend channels, trading zones, and clusters, and the concept of “Once broken, support becomes resistance and resistance becomes support.”

We will continue this series of articles on forex trading and will present useful tips on the various methods that can be used in actual real time trading near areas of support and resistance. These future articles will guide you through implementing the theory previously discussed and putting them into practice.

It is important to understand that this article is intended to educate and familiarize investors with forex trading systems and not to be regarded or interpreted as investment advice.

About the Author

Chris Donnell is a full time Forex trader and software developer.

Position Sizing- Can Small Investors Trade Forex At Higher Time Frames?

By Warren Seah

Many seasoned traders know position sizing or determining the size of each trade is a vital part in forex trading. Many beginning traders however make the mistake of not paying adequate attention to this step. They believe that it is enough to simply define the initial stops. The problem happens when they begin to trade the higher time frames.

Trading higher time frames in forex market usually demands a trader to set a greater stop loss than trading smaller time frames. If traders trade the same lot while trading the higher time frames, it will require a stop loss set further away from the presumed entry price. This will mean that they are taking more risk. That is where position sizing comes into picture.

Position sizing helps a forex trader limit their risks in trading. It not only limit the amount of risk per trade, it also allows a small time trader to trade forex market at a higher time frame taking advantage of longer term market opportunities.

Small investors will not be restricted at a particular time frame. It is a powerful investing concept. This article will explained position sizing in simple terms, the benefits and the ways in which to incorporate it.

Getting the right position size to enter a trade isn’t as complicated as you would imagine. You will first need to decide how much money as a percentage of the account you are willing to lose on a single trade.

The amount varies for every trader, depending on the amount of risk the trader is willing to take on, but generally speaking, 2 to 5 percent is a typical number. The more money you risk on each trade, the faster your account will be damaged if you lose more than one trade consecutively.

Second, you will need to calculate how many pips is your stop loss away from your presumed entry price. Using the following position sizing formula which only applies for the forex market):

(Account balance X Acceptable risk per trade %) / (Number of Pips stop loss away from presumed entry price) = ( value denominated in mini lot )

($20,000 X 3%) / (75) = 8 mini lots

Using this calculation, we have determined the proper position size for this trade to be eight mini lots. It is important to note the leverage ratio and the margin required for trading 8 mini lots.

Forex position sizing therefore determines the amount of contracts a trader can buy without exceeding their maximum risk per trade. With this example, even beginning investors can position size their trades without risking too much on one position and he has the choice to choose whether to trade for short term profits or longer term market opportunities.

About the Author

Warren Seah

“Introducing 11 Exit Strategies, What Every Disciplined Traders Need … Go Without It You Could End Up Being A PIP VICTIM Just Like Thousands Of Traders Out There.”

Download Your Trailing Stop EA Now

Forex Economic Calendar: October 25, 2010

By CountingPips.com

Important News Releases for October 25, 2010.

00:30 Australia Producer price index (3rd Q)
08:30 United Kingdom BBA mortgage approvals
09:00 Eurozone Industrial new orders
12:30 United States Bernanke speaks on mortgages
14:00 United States Existing home sales
14:30 United States Dallas Fed manufacturing
17:30 United States Fed James Bullard speaks on finance
21:15 United States Former Fed Donald Kohn speaks on regulation
23:50 Japan Corporate service price

See full Calendar here

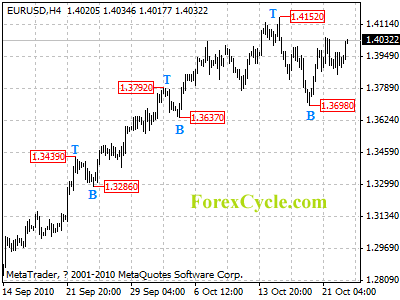
EURUSD stays in a trading range

EURUSD stays in a trading range between 1.3698 and 1.4152. Another rise to test 1.4152 key resistance is still possible later today, a break above this level will indicate that the uptrend from 1.2587 has resumed, then further rise towards 1.4500 could be seen. Support is at 1.3860, below this level could bring price back towards 1.3698 key support.

eurusd

Daily Forex Forecast

Forex Exchange Exclusive: Complex Foreclosures and The USD

By James McKee

One of the main causes of the current financial fiasco in the United States is admittedly the housing market bubble burst. Many banks are experiencing drastic losses as homeowners are being heard regarding their belief that banks have issued them mortgages without due analysis, and due process with regard to the fairness and legal nature of the loans being issued. Quite often banks are allowed to simply reclaim property that a loan holder is unable to pay for but currently a new breed of attorney has stepped up, the foreclosure defense attorney.

This specific breed of attorney is new to the legal arena and has only recently been made necessary due to the large number of foreclosures currently occurring in the United States. The fact that banks had to borrow over half a trillion dollars from the government to stay afloat demonstrates the danger to the USD that this prolonged mortgage “battle royal” represents in terms of further financial problems. Banks are actually having rulings made against them and have been ordered to pay damages to mortgage holders whose mortgage was signed by a “robo-signer”. Such a trend certainly spells out ever-increasing and volatile trouble for the banks since this means that more homeowners will be resisting foreclosure on legal grounds, and given that the number of robo-signed contracts is vast the fallout from this series of events is very grave indeed.

While the DJIA recovered from its losses yesterday one has to wonder when the big crash is coming, given what banks stand to lose from these faulty contracts another big bailout may be necessary to again protect banks from losses regarding mortgages. Consumer confidence in banks and the financial system at large in the United States is at an all-time low, and given this is just the beginning of this latest fiasco the dollar’s slide seems imminent. I would avoid pairing the dollar with majors that experiencing their own detrimental complications, make sure to avoid the Yen or the Euro and stick to the CAD and/or AUD.

Any change is a good change in the Forex exchange if you are able to anticipate it and invest accordingly. Continue to watch the USD carefully and wait for either a dip in the DJIA or an announcement regarding the current developments in mortgage market, either of these will certainly be a precursor to a drop in USD value. Keep your eyes peeled, and happy trading!

About the Author

Author is a Forex trader and financial analyst residing in Denver, Colorado. To stay up to date on all the latest developments in the financial world and beyond be sure to check out the forex exchange rates regularly.

The USD Is Not Dead Yet, Welcome to Round 2 In The Forex Exchange!

By James McKee – In a surprise move today the US dollar is on a breakaway path from its previous calamities against other major currencies. With figures like 1.3939 against the euro, 0.9597 versus the franc, 1.5878 against the pound, 1.0175 against the loonie, 0.9893 versus the Aussie and 0.7561 versus the kiwi, it is clear that the USD is rallying, but can this possibly last? Given the fact that many US banks are still stuck with foreclosed homes that they cannot sell, an ever exponentially increasing national debt, and skyrocketing unemployment I do not believe it can. Anything can be propped up for a time but in the end if anyone bothers to “peek around the curtain” what is inside the United States economy is not pleasant.

United States’ treasury bonds outnumber the TOTAL available money supply nearly 20:1 that means the United States is in bankruptcy twenty times over. Now, we are not alone in this quagmire, many countries are experiencing fiscal issues, however the United States currency is supposed to be the world’s money supply and stand as an example of what a currency should be worth ideally. Sadly this is far, far from the case currently and while there are certainly efforts being made in America to curb the downslide of the value of its currency there does not seem to be any simple answer to this problem. As the world watches and waits America’s debt holders grow uneasy, China for instance is beginning to invest less and less in American bonds and is moving towards other investments. China is the number one holder of American debt in the world.

So what does this spell out for the Forex currency exchange and the traders therein? It lets us know that there is going to be a correction on the horizon for the US dollar shortly and it is definitely going to be a profitable one. Given the number of available pairs it is certainly an appealing situation and one we should all be taking note of in the short term. The USD may make more gains tomorrow but I would not bet on it, watch these pairs like a hawk and be prepared to take a ride, everything which goes up must go down and USD definitely likes to fall fast, and hard. Happy trading!

About the Author

Author is a Forex trader and financial analyst residing in Denver, Colorado with 5 years of experience in trading with an attitude of cooperation through education. To stay up to date on all the latest developments in the financial world and beyond be sure to check out the forex exchange rates regularly.

Increasing profits in business with Tradestation

By ProIndicators – Tradestation comprises of three fundamental concepts in trading without which success can’t be achieved. These three concepts are price action, volume and real time support with resistance. Each plays its vital role in tradestation but among them price action is the most pivotal.

Starting from the price action; one has to embed this in mind that trading without price and time will incur losses for you and leaving you no where. Price in the market is always correct and there is no magic want to rule it by all traders. Often different indicators are used but market decisions are always based on the price action prevalent in the market. Traders use sheathing indicators in their trading decisions but they prove to be a failure and result in losses.

Next is the volume in tradestation. If classic indicators of volume are used then it makes it difficult for the trader to understand its functioning in trade process. For an example if we take stock trading one may find huge inflow of volume as the market was closed all night. The next day it’s really tough to figure out the unexpected spikes indicated through the average indicators of volume. At noon traders will be in depression and will be adjusting their volume spikes till the market closes in the evening. You can hardly make sense of average volume when you analyze the market spikes the whole day. As a result a false picture of market volume is seen and the traders get confused.

Moreover, if traders change the timeframe of trading chart then different volume information will be indicated as different time duration will show up unusual volumes. It is not workable even in forex market. The volume will be quite different as the trader moves from one symbol to another in tradestation. Again it jumbles up the situation and makes it far harder to understand volume.

To understand volume in tradestation, the best indicator of all would be time segmented volume. It will help you to compare the current slab with previous slabs of exactly the same time frame over the last month. With time segmented volume you may compare one trading month of 21 days of the same time slab you choose. It depicts the true average percentage of each time slab over the past 21 days. This time segmented volume then becomes normalized indicator. This will hold true for all charts, symbols and time frames. Time segmented volume when normalized is the most authentic indicator when comparing days among each other.

In tradestation when you compare candlestick bar with the volume bar you look for either consistency or deviation in time segmented volume. This helps in analyzing the trading patterns. On the other hand if you compare volume with price action then valuable trading information can be taken. . This is of the vital importance to comprehend the volume first and then making a comparison between time segmented volume bars with the candlestick bar. Having complete overview of the three concepts of tradestation on may take fast and accurate decisions eventually earn profits.

About the Author

ProIndicators.com‘s high precision TradeStation. MT4 (Metatrader), NinjaTrader, indicators are astounding. Indicators that work with our custom strategies will work with Tradestation, Meta & Ninja platforms.

Development of Automated Forex System Trading

By ProIndicators

Forex trading systems have been developing over the years. It has changed from being available to only few identities for trade to becoming common to everyone with each passing day. What only big traders and bank could use before, now every individual has access to. Future and stocks were the first instruments which came into the scene and have been progressing since 20-25 years ago. Whereas, Forex system evolution took place some 15 years ago, and since then it has been changing every passing year. One of the recent change with which this evolution can be attributed to is the Fore system being available to average person which was not possible few years back.

Marketers have been trying to produce a system with characteristic of “Holy Grail” in which the system itself has the capability of recognizing conditions of market through which it can enter or exit on its own. There should be no or minimum human interference. Another thing which a system should have is high success rate with a cost that most people can afford. Moreover, humans are very emotional and this makes them sometime decide on illogical trading. Everyone would want a Forex system with above mentioned qualities.

“Holy Grail;” has not yet been invented because there is not product is the market which is perfect and has all the mentioned features. Nevertheless, the automated Forex system trading products have changed dramatically over the years and they have reached a level very near to that of perfect system. There are numerous products in the market which will catch you eye but in real most of them would just take your money instead of making it more for you. Market conditions are the elements on which current system base their signal on. Some of these systems will have a good success rate while some will not.

Naturally, superior Forex systems with good success rate would cost you more than systems which are not superior. One of the recent automated systems which I looked into was around $2000. The price is certainly high for some individuals but the overall system looked good and if you work it right, you will be able to recover your initial investment very quickly. Another thing which you should be aware of is the indirect cost of the bad system, by which you will lose your account money placed with your forex broker.

The most evolved product in the market is the one which considers the market, analysis it with programmed conditions and then makes decisions by executing the order to enter or to exit the trade. This system does not consider the emotions which people show and neither it needs any human monitoring or interference. Therefore, these systems have a general high trade in ratio of around 90%. However, there is one limitation which is associated with these Forex systems. It has a limited number of currency pairs, where some products would have only one and some just 4-5 pairs. Before deciding on your Forex system you need to fully analyze the market with your knowledge, experience and then make the final decision.

About the Author

ProIndicators.com is providing high precision TradeStation. Before deciding on your Forex system you need to fully analyze the market with your knowledge, experience and then make the final decision.

The 2% – 6% Money Management Rules

By Taro Hideyoshi – The greater staying power of traders the greater chance to win. Traders have to stay in markets long enough to win trades. Money management plays an important role in helping traders to survive in markets.

No one win every trades; money management help traders to reduce losses on losing trades. Moreover it also maximizes traders’ gains on winning trades.

All traders have ever heard about how important the money management but the most of them are still losing in understanding money management strategies.

To make traders clear and be able to find strategies of managing money that suit to them. Let us talk about a couple of simple and easy money management rules.

The 2% – 6% rules have been introduced in Dr. Alexander Elder’s book “Come Into My Trading Room”

The 2% rule is to protect traders from any single terrible loss that can damage their accounts. With this rule traders risk only 2% of their capital on any single trades. This is for limiting loss to a small fraction of accounts.

Besides a disastrous loss, a series of losses can also damage traders’ account. The 6% rule is lent to handle this. Traders have to set the maximum of accumulated loss for a month. When they reach that level of loss, they have to stop opening any new position for rest of the month.

These 2 rules are designed to protect traders from the two types of losses. Nevertheless the 2% – 6% would be change for each trader. For those who are able to accept the higher risk, they might adjust the 2% – 6% rules to 5% – 10%, where the 5% is used to protect the account from any single disastrous loss. While the 10% rules is used to protect traders from any series of losses in each month.

About the Author

Taro is an experience trader who trades in stocks, futures, forex. He strongly focuses on technical analysis, trading systems and money management.

If you would like to find more articles on MetaStock Tutorials, MetaStock Formulas, Trading Systems and Money Management. Please go to MetaStock Trading System.