How to get Forex Signals sent direct to your Metatrader account

By Manual Santos – The FX trading market is the biggest financial market in the world with trades surpassing 4 Trillion USD a day. The the diverse amount of currencies traded helps to maintain elevated levels of volatility day after day. Depending on the session, for the most part you will always see up/down currency movement, allowing superb opportunity for profits (and losses as well) for the seasoned trader. The Forex market offers plenty of instruments to limit risk and allows the trader to pull in profits in both rising and falling markets. Forex also allows highly leveraged trading with low margin requirements.

Despite the immense nature of this market, Currency trading is quite risky with very few people attaining success. While many investors attempt to hurdle this large obstacle by themselves, many decide on using forex alerts companies to assist them in finding trades with higher probability. Many forex signals users will use these alerts as they arrive without further study while others will incorporate additional due diligence in order to increase their odds of a positive trade. If the currency alerts do not pass their review, they cancel the trade and move on to the next.

Other issues most currency traders find when subscribing to currency alerts is that they are not able to manually receive and enter the trade. Because the Currency market is open 24 hours 5 days per week, it is difficult to be available for all the signals because trades can arrive at a time when you are unavailable. That is why you want to find a Forex signals provider that interfaces with the Metatrader 4 trading platform, the most globally used trading platform for FX trading.

The advantage of executing on Metatrader is that it has a special plugin ability (expert advisers) to trade for you automatically. Some Metatrader 4 expert advisors will turn your platform into a robot and enter and exit trades robotically depending on your parameters, other advisors are programmed to provide a bridge between other computers. That is how the automated forex signals providers utilize metatrader. They send you a special expert advisor that you install on metatrader. That expert advisor creates a link between your account and the automated forex signals account so that whenever that signal provider’s account makes a trade, that information is quickly delivered to your metatrader account to do the same thing. There is no need for you to do anything, all is done in an automated manner.

This is why using a signals service that interfaces with Metatrader so beneficial because now you don’t have to stay up in the middle of the night wondering if or when a signal is going to come in, be afraid of not getting an alert, be interrupted in your job because of a signal or other hassles related to physically receiving and processing forex signals. With metatrader on your side and a Forex Signals provider that supports it, you are now ready to better profit from forex trading.

About the Author

Manuel is part of the forex signals team at Easy Pips Forex Signals. Easy Pips provides a Forex Signals advice service where their trade signals are sent direct to your account instead of SMS or email. Their Forex Trading Signals are available on a trial basis. Visit them to sign up for two free weeks.

GBPUSD stays in a rising price channel

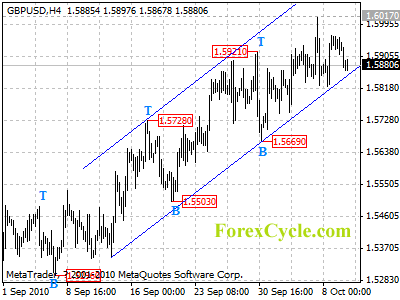
GBPUSD stays in a rising price channel and remains in uptrend from 1.5296. The price action from 1.6017 is more likely consolidation of uptrend. As long as the channel support (now at 1.5850) holds, we’d expect uptrend to resume, and another rise towards 1.6100 is still possible. Only a clear break below the channel support will indicate that lengthier consolidation of uptrend is underway, then deeper decline to test 1.5669 key support could be seen.

gbpusd

Daily Forex Forecast

Gold Prices Forecasted Higher

By Sara Nunnally, Editor, Smart Investing Daily, TaipanPublishingGroup.com

On Friday, gold futures for December finished at $1,345.30 an ounce… the second highest close on record. We spent some time last week discussing whether gold prices are overheated or not. Just before the weekend, the gold bugs spoke up about what factors are influencing prices.

Bloomberg surveyed 18 gold traders, analysts and investors at the end of last week and found that two-thirds predicted that gold prices would trend higher this week.

One of the reasons why is the Federal Reserve keeps talking about buying more government debt. I told you on Friday that this means the value of the U.S. dollar will keep falling. No surprise then that most traders and investors think gold prices will keep climbing.

Kitco News reporter Debbie Carlson said that another reason why gold prices may rally this week was Friday’s jobs report.

“The expectations of a second round of quantitative easing from the U.S. are more likely,” she wrote, “especially with Friday’s jobs report, which showed the shedding of 95,000 jobs, putting pressure on the buck.”

And with that pressure comes international concern.

Make 12 Times More Than Physical Gold by 2012

A hidden provision in the 956-page healthcare reform bill could make it dangerous to own physical gold by 2012.But there is one gold investment class that’s safe from the new law – and could make you 12 times more than physical gold over the next 12 months.

Learn more in this financial investment report.

U.S. Dollar Weighs on International Markets

This weekend (Friday and Saturday), the International Monetary Fund (IMF) met in Washington, D.C., to talk specifically about the impact of currency fluctuations, particularly as the U.S. dollar falls and emerging market currencies soar.

For a while now, international markets have been knocking the U.S. dollar for its sharp drops during the global financial crisis and its continued instability. Since the greenback is used in most trade transactions, and because the U.S. has sold huge amounts of Treasury bonds to other major economies, global markets can suffer when the U.S. dollar falls.

In turn, gold prices climb as demand for this safe haven turns gold into a major investment trend.

Now this investment demand is running smack into India’s festival and weddings seasons. You’d think that such high prices would be keeping jewelry demand down, but actually, demand is up.

Gold.org, in conjunction with Adfero, Ltd., reports, “Imports of gold into Ahmedabad rose by nearly 25 per cent between July and September in the traditional upswing of trading in the precious metal, reports DNA India.”

Imports topped 65.5 metric tons, or 2.3 million ounces.

When Will Gold Prices See a Correction?

And yet, for all this talk of bullish indicators for gold, this rally keeps pushing prices ever higher, and we’ve yet to see any correction or consolidation.

Prices have even popped above their sharp uptrend. Consider this chart from The Weekly Gold Digger:

Gold Prices Chart
View Larger Chart

From this chart’s indicators, we see an overheated RSI and a massive spike in volume from Thursday’s peak prices.

But Friday’s action appears to have found support on that top trend line.

That sets up two technical scenarios. First, Friday’s rebound could keep prices above this trend line, and with the economic factors still screaming “bullish” for gold, we might see prices shoot back up to the $1,360 level in short order.

The second scenario sees gold prices dip back into the established uptrend. Should this happen, you might see gold prices arch down to test that bottom trend line before continuing higher.

This would be a great time to establish a position, should you not have some sort of gold or gold-based investment in your portfolio.

But the next few days will be tricky, as gold prices try to make up their mind.

Either scenario still works with the majority of analysts’ macro ideas about gold. The economic anchors around the U.S. dollar aren’t going to go away any time soon. Perhaps not for decades… And in the meantime, gold will maintain its appeal as a hedge against a sinking dollar.

We’ll be dedicating a chunk of time this week to gold as we continue to see record prices.

Imagine making $54,650 in a single day!

That’s the potential of the coming Domino Trades. Stunning returns could be turning ordinary folks into Currency Millionaires over the next year. Don’t miss out on this life-changing opportunity.

Get in on the ground floor now of this currency investment opportunity.

Don’t forget to follow us on Facebook and Twitter for the latest in financial market news, investment commentary and exclusive special promotions.

About the Author

Sara is Co-Editor of Smart Investing Daily. As Senior Research Director and global correspondent, Sara Nunnally’s diverse resume includes studies in art history, computer science and financial research. She has appeared on news media such as Forbes on Fox, Fox News Live, and CNBC’s Squawk Box, as well as numerous radio shows around the country.

As Senior Research Director, global correspondent and co-editor of Smart Investing Daily, Sara has traveled all over the world in search of the best investment opportunities to recommend to her readers, be they in developed economies like France and Italy, in emerging markets like the Czech Republic and Poland, or in frontier terrain like Vietnam and Morocco. Her unique “holistic” approach of boots-on-the-ground research has given her an edge in today’s financial marketplace as she searches for the next investment opportunities in hot sectors like alternative energy, currency markets and commodities.

Contracts for Difference (CFDs) Explained

By Vincent Parker – Contracts for Difference (CFDs) can be quite confusing. Here is a quick article explaining CFDs, leaving Contracts for Difference explained once and for all.

Contracts for difference are a contract created between two different parties, stating that one party will pay the other party the difference in the value of that contract at a point in time in the future. One party will expect to receive money if the value of the contract is higher, while the other will expect to receive money if the value is lower.

In the real world, the contract is created between a trader and a CFD broker. The contracts are open ended, unlike a future contract meaning that its up to the trader to decide when to close the trade and collect (or pay) his money. From this sense, CFDs work much like a share trade.

Contracts for difference are usually traded on leverage, meaning you only need a small portion of the trade funds to execute the trade. For instance, if you were to open a position of $10,000 and the margin was 10% you would only need $1000 to open the position. This means that much larger profits can be achieved with smaller amounts of money.

The fact that you take a position out on leverage, means that there is an interest element associated with your purchase. And you will find yourself paying and an annual interest rate a few percentage points higher than the official cash rate.

Another great thing about CFDs is that it’s very easy to open a short position. What this means is that you can actually trade on the value of a CFD going down instead of up. Something that was very difficult until this tool was created.

A CFD is priced based on the value of the underlying asset. The underlying asset could be a share, currency, commodity or indices in many markets. The flexibility of the different types of assets you can trade with CFDs is unparalleled by anything else. Which is why if you are looking to get into short term trading, anything from spread betting, FOREX trading or day trading, CFDs are your best option.

About the Author

123CFD is a resource for CFD Trading Plans where we cover topics like CFD Trading

Forex: Speculators more bearish on US Dollar, add to long Euro positions

By CountingPips.com

The latest Commitments of Traders (COT) report, released on Friday by the Chicago Mercantile Exchange, showed that futures speculators continued to increase their bets in favor of the euro and other major currencies against the US dollar. Non-commercial futures positions, those taken by hedge funds and large speculators, were net long the euro against the U.S. dollar by 48,243 contracts as of October 5th following net positioning of 35,330 contracts on September 28th. The latest data was the best euro futures positioning in over a year and marked a fifth straight week of improvement in favor of the euro.

The COT report is published every Friday by the Chicago Mercantile Exchange (CME) and shows futures positions as of the previous Tuesday. It can be a useful tool for traders to gauge investor sentiment and to look for potential changes in the direction of a currency or commodity. Each currency contract is a quote for that currency directly against the U.S. dollar, where as a net short amount of contracts means that more speculators are betting that currency to fall against the dollar and net long position expect that currency to rise versus the dollar. Open interest is the number of open contracts that have not been closed by a transaction or by delivery.

The British pound sterling had been the last major currency on the short side against the dollar in the CME futures market but the British currency’s fortunes have changed as speculators increased their bets for the GBP to a positive net amount of contracts. The euro, Australian dollar, New Zealand dollar, Japanese yen, Canadian dollar, Swiss franc and Mexican peso all continued to have a net positive amount of contracts.

The British pound sterling positions increased to a net of 9,403 contracts after being short on September 28th by -2,194 positions. This is the fourth straight week of improvement for the British pound future positions and the best showing for GBP contracts in over a year.

The Japanese yen net long contracts increased to 49,206 as of October 5th from 28,666 net long contracts reported on September 28th. Yen positions have now climbed for two straight weeks after declining on September 21st as many speculators may have decreased their yen long positions due to the Bank of Japan’s currency intervention.

The Canadian dollar positions increased higher to a net total of 42,678 contracts after totaling 27,870 net longs on September 28th and rose to their highest level since May.

Swiss franc long positions advanced to 22,599 long contracts as of October 5th after totaling a net of 19,993 long contracts on September 28th. This is the highest level for long Swiss franc positions since early in December 2009 when long contracts totaled 24,725.

The Australian dollar positions edged very slightly lower after reaching their highest level since April on September 28th. AUD futures contracts declined to a net amount of 69,036 long contracts as of October 5th from 69,533 long contracts on September 28th.

New Zealand dollar futures positions declined for second straight week to a total of 16,334 long contracts after a total of 17,270 long contracts the week before.

Mexican peso long contracts jumped higher as of October 5th to 85,764 net long positions from 66,591 longs the week prior. Peso positions are at their highest since May and have now risen for four consecutive weeks.

COT Data Summary as of October 5th, 2010
Large Speculators Net Positions vs. the US Dollar

Euro: +48,243 contracts from +35,330 contracts on September 28th
British pound sterling: +9,403 contracts from -2,194 contracts
Australian dollar: +69,036 contracts from +69,533 contracts
Canadian dollar: +42,678 contracts from +27,870 contracts
Japanese yen: +49,206 contracts from +28,666 contracts
Mexican peso: +85,764 contracts from +66,591 contracts
New Zealand dollar: +16,334 contracts from +17,270 contracts
Swiss franc: +22,599 contracts from +19,993 contracts

Go to the Commitment of Traders CME raw futures data

Further COT Resources from around the web:

Forecast The FX Market With The COT Report

The Only Indicator You Will Ever Need

AUD/USD Bearish Correction in the Making

By Anton Eljwizat – The volatile of the AUD/USD pair continues to be affected by the volatile forex market. The last few weeks has seen a lot of bullish strength in the AUD/USD pair. However, as I demonstrated below, it seems that the pair’s bullish run may have run out of steam, and a bearish correction could be underway soon. This might be a good opportunity for forex traders to enter the trend at a very early stage and at a great entry price.

• Below is the daily chart of the AUD/USD currency pair.

• The technical indicators that are used are the Relative Strength Index (RSI), Slow Stochastic and MACD.

• Point 1: The Slow Stochastic indicates a bearish cross, signaling that the next move may be in a downward direction.

• Point 2: The Relative Strength Index (RSI) indicates that the price of this cross currently floats in the overbought territory, signaling downward pressure.

• Point 3: The MACD indicates an impending bearish cross, which may signal a downward movement is going to occur in the near future.

AUD/USD Daily Chart

Forex Market Analysis provided by ForexYard.

© 2006 by FxYard Ltd

Disclaimer: Trading Foreign Exchange carries a high level of risk and may not be suitable for all investors. There is a possibility that you could sustain a loss of all of your investment and therefore you should not invest money that you cannot afford to lose. You should be aware of all the risks associated with Foreign Exchange trading.
Forex daily analysis: 11-10-2010

USD/CHF

Daily graph: http://www.real-forex.com/charts-daily/111010/CHF_DAILY_111010.JPG

One hour graph: http://www.real-forex.com/charts-daily/111010/CHF_1H_111010.JPG

We can identify a clear and sharp downtrend for the pair during the last few weeks. The bearish envelope template appeared during the 06-10-2010 and 07-10-2010 sessions suggest a close reversing trend, creating an opportunity for a “Long”. In order to catch this opportunity, we suggest looking for an ascending configuration on the one-hour graph.

According to our opinion, the required configuration will be created if the once the resistance 0.9711 will be crossed upward.


Potential trade

  • “Limit” order on “Long” position 10 pips above the resistance mentioned previously, meaning 0.9701.
  • “Stop Loss” order on the last low occurred: 0.9592

USD/CAD

Daily graph: http://www.real-forex.com/charts-daily/111010/CAD_DAILY_1101010.JPG

For the last few weeks, the pair doesn’t follow any specific trend. However, three days ago, the currency crossed a very important support level for a daily graph at 1.0111. Once crossed, a bullish envelope template appeared. A breach of the 07-10-2010 would confirm the template, suggesting a reversing trend upward oriented, creating an opportunity for a “Long” transaction.

We suggest waiting for the breach required, and looking for an ascending configuration on one hour graph in order to enter the transaction.

Have a nice day!

Real forex team

Sponsored by: Real-Forex

Forex Daily Market Commentary

By GCI Forex Research

Fundamental Outlook at 0800 GMT (EDT + 0400)

USD

Price action on Friday evening was dictated by the US payrolls report. Both the headline print and the private payrolls component disappointed expectations. US 2y yields fell to another lifetime low of 33.5bp, which piled further downward pressure on USDJPY, and took the pair to a new 15-year low. The euro saw some erratic price swings immediately after the numbers, but soon settled back to pre-announcement levels. EURUSD traded 1.3834-1.3986, USDJPY 81.73-82.57. Our US economics team now believe that the FOMC will formally announce renewed balance sheet expansion on Nov 3. The change in forecast comes after a week in which Fed officials continued to express concern about the state of the US recovery, and to make the case for a pre-emptive monetary policy response.
Nevertheless, our analysts see a risk that, after rallying hard on the prospect of QE, the US Treasury market could yet be disappointed if the Fed fails to commit to buying a large and specific sum of Treasury securities over several quarters. The September payrolls report confirmed that the trend in private employment growth was fairly steady in Q3. However, the report also showed a sharp decline in government payrolls which was much broader than Census-related effects could explain. The weekend G7/IMF/World Bank meetings ended without any specific agreement on FX matters and the issue will likely resurface at the G20 meeting of finance ministers and central bankers which begins on October 22. More specifically, there was no official criticism of Japan’s decision to intervene in the FX market by selling yen. We believe this increases the chance of a further round of intervention should the yen continue to appreciate.
EUR

ECB President Trichet said he does not believe the term “currency wars” reflects the current reality, a view also expressed by ECB Governing Council Member Weber. Both agreed that exchange rates should reflect economic fundamentals. Eurogroup Chairman Juncker said that the dollar is currently not in line with economic fundamentals and that he is not happy with the euro having reached $1.40. ECB Governing Council Member Nowotny said that the euro’s increase is not helping the Eurozone recovery.
Juncker added that there is no need for a new global currency deal. France’s Finance Minister Lagarde said that, as far as currencies are concerned, the G7 agreed that concerted action is preferable to unilateral action.
ECB Executive Board Member Stark continued to take a moderately hawkish stance, noting that the risks to the inflation outlook remain “slightly tilted to the upside”. He expressed concern that maintaining accommodative monetary policy for too long can pose serious risks both to the economy and to price stability. He did concede though that the phasing out of unconventional measures would need to be gradual. An IMF spokesperson implied that the recent tightening of Greece bond yields suggests that Greece will be able to return to international debt markets in 2012 and would then be able to fully cover its external financing needs. However, she added that, were refinancing concerns to linger, the IMF and the EU have the option to extend Greece’s loans further out. ECB Executive Board Member agreed, but noted that no extension had yet been finalised.
EU Economic and Monetary Affairs Commission Rehn said that he sees risks that the fiscal consolidation plans of some European countries lack specifics, and include over-optimistic macroeconomic assumptions.
JPY

There was no specific public criticism of Japan’s FX intervention policy at the series of weekend meetings, which raises the risk of further intervention in our view. Finance Minister Noda emerged from the G7 meeting to say that “we did not discuss anything about the future, but I believe we’ve gained understanding on our basic stance”.
Noda and US Treasury Secretary Geithner met separately for a bilateral meeting, at which Noda explained the details of Japan’s fiscal stimulus steps. Noda said no specific mention of Japan’s intervention policy was made.
CAD

Canada’s Finance Minister Flaherty said that IMF/G20 countries need to work towards “rules of engagement” on the circumstances that would justify FX intervention. Flaherty said that although he is concerned about Canada’s weak export growth, no currency intervention is being considered. Looking ahead to the upcoming G20 meetings, he said he does not expect any complete resolution of currency discussions even then.
Employment declined by -6.6K in September, falling well short of consensus expectations. However, the unemployment rate unexpectedly ticked lower to 8.0% (cons. 8.1%, prev. 8.1%). The BoC’s senior loan officer survey showed an overall easing in business lending conditions to Q3. This was the fourth successive quarter in which loan availability improved.


AUD

On Friday, RBA Deputy Governor Battellino said it would be a mistake for Australia to try to manage the AUD, effectively ruling out the possibility of FX intervention. He pointed to the important role a strong currency plays in helping the economy.

TECHNICAL OUTLOOK


EURGBP stalled at 0.8808.
EURUSD BULLISH Violation of 1.4029 will trigger further acceleration to 1.4194. Near-term support holds at 1.3799 ahead of 1.3637.
USDJPY BEARISH Bearish trend remains intact; break of 82.88 exposes 79.75. Resistance remains at 83.99 ahead of 85.40.
GBPUSD BULLISH Sustained break of 1.6018/69 would expose 1.6276. Support at 1.5670 ahead of 1.5503.
USDCHF BEARISH Next support below 0.9500 lies at 0.9078. Resistance at 0.9739 ahead of 0.9918 breakout low.
AUDUSD BULLISH Upside potential held at 0.9918 ahead of 1.000 psychological resistance. Pullback clears 0.9773 exposing 0.9542.
USDCAD BEARISH Recovery has resistance at 1.0380. Violation of 1.0108 shifts focus to 0.9931 with scope for 0.9820 next.
EURCHF BULLISH Clearance of 1.3482 puts odds in favor of bullish trend; expect gains to target 1.3697 measured objective. Support at 1.3265.
EURGBP BULLISH Bullish pressure stalled in front of 0.8808 with next resistance at 0.8894. Support holds at 0.8689 ahead of 0.8563.
EURJPY BULLISH Upside potential capped at 116.68 ahead of 119.33. Near-term support comes in at 113.89 ahead of 111.47.

Forex Daily Market Commentary provided by GCI Financial Ltd.

GCI Financial Ltd (”GCI”) is a regulated securities and commodities trading firm, specializing in online Foreign Exchange (”Forex”) brokerage. GCI executes billions of dollars per month in foreign exchange transactions alone. In addition to Forex, GCI is a primary market maker in Contracts for Difference (”CFDs”) on shares, indices and futures, and offers one of the fastest growing online CFD trading services. GCI has over 10,000 clients worldwide, including individual traders, institutions, and money managers. GCI provides an advanced, secure, and comprehensive online trading system. Client funds are insured and held in a separate customer account. In addition, GCI Financial Ltd maintains Net Capital in excess of minimum regulatory requirements.

DISCLAIMER: GCI’s Daily Market Commentary is provided for informational purposes only. The information contained in these reports is gathered from reputable news sources and is not intended to be U.S.ed as investment advice. GCI assumes no responsibility or liability from gains or losses incurred by the information herein contained.

Dollar Continues To Slide Amid Disappointing Jobs Data

Source: ForexYard

The U.S. dollar continues to slide on almost all fronts. As a result, during the past week the euro reached a 5-month high against the dollar and the Japanese yen saw a 15-year high vs. the greenback. Dollar-dominated commodities soared as well during the process; gold saw an all-time high of $1,364 an ounce, and crude oil marked a 5-month high of $84.40 a barrel. Can this trend continue this week as well?

Economic News

USD – Dollar Closes another Bearish Week

The U.S. dollar continued to drop against most of the major currencies during last week’s trading session. The dollar fell about 300 pips against the euro and the EUR/USD pair crossed the 1.4000 level for the first time in 5 months. The dollar continued its depreciation against the Japanese yen as well, falling to a 15-year low against the yen.

The dollar’s ongoing devaluation is the result of positive indications from the U.S. economy, which supports risk appetite in the market. Economic reports from the past week show that the number of contracts to purchase previously owned homes increased by 4.3% in August, following a 4.5% rise in July. In addition, the Non-Manufacturing Purchasing Managers’ Index report showed on Tuesday that service companies in the U.S. have expended at a faster pace than projected in September, indicating the economic recovery is picking up. The disappointing Non-Farm Payrolls results, which showed that the U.S. lost more jobs than forecast in September, should have corrected the bearish dollar. However, it was the unemployment rate, which stayed at 9.6%, and didn’t rise to the expected 9.7%, that maintained the dollar’s fall.

Looking ahead to this week, the most significant news releases from the U.S. look to be the inflation reports. The Producer Price Index (PPI), which is scheduled for Thursday, and the Consumer Price Index (CPI), which is scheduled for Friday are likely to have a large impact on dollar’s trading. Positive results will show that the economy is indeed recovering, and the dollar might drop further as a result.

EUR – Reduced Risk Aversion Boosts the Euro

The euro strengthened against most of the major currencies on last week’s trading. The euro gained about 300 pips against the dollar, and the EUR/USD was traded over 1.40 for the first time in 5 months. The euro continued to strengthen against the British pound as well, gaining about 100 pips last week.

The positive economic releases from Germany continue to support the euro-zone’s currency. German factory orders rose more than expected in August, the nation’s economics ministry said Wednesday, as seasonally-adjusted orders increased by 3.4% in August. In addition, the German industrial production expended as well in August, at by 1.7%. Germany holds the strongest and largest economy among the EU nations, and thus recovery signals from the German economy are supporting the local currency. Another motive for the euro’s appreciation is the recovery indications from the U.S. economy. Various reports which were released last week showed that the U.S. economy is recovering, and isn’t likely to enter yet another recession. All this reduces risk-aversion and drives investors to look for relatively riskier assets, such as the euro.

As for the following week, traders are advised to follow the leading publications from the German and French economies, as these are likely to have the largest affect on the euro this week. Traders should also watch the euro-zone’s Consumer Price Indices, which are scheduled for Friday. Further positive reports from the euro-zone have the potential to boost the euro farther against the dollar to the 2009 December low at the resistance level of 1.4210.

JPY – Yen Continues To Rise on All Fronts

The Japanese yen rallied against all of its major counterparts during last week’s trading session. The yen’s most notable appreciation came against the U.S. dollar. The USD/JPY fell to the 81.40 level, marking a 15-year low. The yen gained almost 150 pips against the euro and the British pound as well.

The yen continued to strengthen last week due to speculations that despite Japan’s desire to devaluate the national currency in order to aid exports, the international criticism following its last intervention will prevent the Japanese government from acting again. Over the weekend Japan escaped overt criticism from the G7 and G20 for its yen selling intervention. Yet it seems that the Japanese leadership understands that the industrial world isn’t accepting its unilateral intervention, and that investors’ bets that Japan will not interfere in the currency trading have so far been fulfilled.

As for the week ahead, traders are advised to keep following Japanese statements regarding their currency intervention plans. For the moment it seems that Japan will reluctantly abandon their wish to devaluate the yen. If this occurrence will indeed take place, the yen might strengthen even further during the upcoming week.

OIL – Crude Oil Recovers To $83 a Barrel

Crude oil saw an extremely volatile session during last week’s trading. Crude gained on a daily basis up until Friday, and reached as high as $84.40 a barrel. This was followed by a sharp fall, and crude was traded for $80.30 a barrel. However, crude prices promptly corrected the bearish move, and are now trading around $83.0 a barrel.

Crude is constantly rising over the past three weeks due to growing speculations that the Federal Reserve will need to start debt purchases to prevent the U.S. economy from falling back into recession. This has weakened the U.S. dollar, and as a result boosted demand for dollar-dominated commodities, such as crude oil and gold. It currently seems that as long as the dollar continues to slide against its major rivals, especially the euro and the Japanese yen, crude might face further bullishness.

As for this week, traders are advised to continue following the major news releases from the U.S. and the euro-zone, as these usually have significant impact on crude oil trading. Traders should also follow the U.S. Crude Oil Inventories release on Thursday as this report tends to have an instant impact on the market.

Technical News

EUR/USD

There is a very accurate bullish channel formed on the 4-hour chart, as the pair is now floating in the middle of it. As the RSI and the MACD are still pointing up at the daily chart, the pair looks to rise further, with potential to reach the 1.4050 level.

GBP/USD

The cable closed a rather volatile week around the 1.5940 level. A bearish cross on the daily chart’s Slow Stochastic suggests that a bearish trend might take place this week. Going short might be the preferable strategy today.

USD/JPY

The USD/JPY pair saw a 15-year low last week, and yet it continues to drop further. The MACD and the Slow Stochastic on the weekly chart indicate that the bearish move has more room to go, with key target level of 81.35.

USD/CHF

The USD/CHF continued to drop on Friday, yet it begins to provide correction signals. A bullish cross of the 4-hour chart’s MACD and the daily chart’s Slow Stochastic indicate that the pair might see a bullish correction today. Going long with tight stops might be a good strategy.

The Wild Card

USD/CAD

The pair saw a mild bullish correction until Friday and reached as high as the 1.0235 level. However, it has already corrected most of the bullish movement and is now trading around the 1.0100 level. And now, as all the oscillators on the 8-hour chart are pointing down, the pair looks to prolong the bearish trend. This might be a good opportunity for forex traders to join a very popular trend.

Forex Market Analysis provided by ForexYard.

© 2006 by FxYard Ltd

Disclaimer: Trading Foreign Exchange carries a high level of risk and may not be suitable for all investors. There is a possibility that you could sustain a loss of all of your investment and therefore you should not invest money that you cannot afford to lose. You should be aware of all the risks associated with Foreign Exchange trading.

USDCAD has formed a cycle top at 1.0232

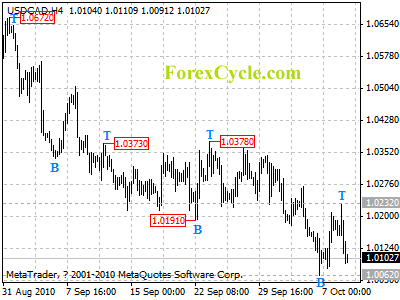
USDCAD has formed a cycle top at 1.0232 level on 4-hour chart. Range trading between 1.0062 and 1.0232 would more likely be seen in a couple of days. Support is at 1.0062, a breakdown below this level will indicate that the downtrend from 1.0672 has resumed, then next target would be at 1.000 area. Key resistance is at 1.0232, a break above this level will suggest that the fall from 1.0672 has completed at 1.0062 already, then the following upward movement could bring price to 1.0600 zone.

usdcad

Daily Forex Signals