Thin Trading on US Labor Day Dampens Risk Appetite, Boosts USD

Source: ForexYard

The EUR/USD tested a significant support line at 1.2790, while the GBP/USD reached as low as 1.5350 before correcting back upwards. Commodity prices seemed to level-out, however, indicating that the upward movement of the greenback may not have been caused by a surging dollar but rather by a decline in everything else. This suggests that risk appetite came under pressure during the thin trading conditions in the market.

Economic News

USD – USD Climbs from a Potential Decrease in Risk Appetite

The celebration of Labor Day in the United States and Canada yesterday led to thin trading conditions among many of the major currency pairs. The volatility experienced at the opening of the Asian trading session this morning witnessed some sharp spikes as North American positions began to come back online.

The EUR/USD tested a significant support line at 1.2790, while the GBP/USD reached as low as 1.5350 before correcting back upwards. Commodity prices seemed to level-out, however, indicating that the upward movement of the greenback may not have been caused by a surging dollar but rather by a decline in everything else. This suggests that risk appetite came under pressure during the thin trading conditions in the market.

Today’s session will see an expected increase in volume which may equalize many of this morning’s significant moves. Should news out of the other major economies reveal deeper weaknesses we may see continued risk aversion, leading to a modest bump to the USD.

EUR – Euro Declines against Currency Rivals

The euro took a dive in today’s opening trading sessions as investors took flight from riskier assets during the bank holidays in North America. Additionally, the Sentix Business Confidence report in the euro zone provided a slightly pessimistic outlook from business analysts.

The EUR/USD fell towards 1.2790 while the EUR/GBP dropped 40 pips to 0.8320. Against the Japanese yen, the 16-nation single currency sunk around 70 pips to currently trade at 107.70. If risk aversion continues to rule the market today, investors should see the euro continue to plummet against most of its currency rivals.

Looking forward to today, however, there is very little news which is scheduled to impact the euro zone. Britain will be releasing its Halifax housing price index (HPI) which could give the GBP a much-needed boost if figures turn out optimistic. Germany will also publish a report on factory orders. Any positive reading may help increase risk appetite following yesterday’s decline.

JPY – Will the BOJ Intervene on Behalf of the Yen Today?

The Japanese yen appears to be trading in a flat range against a number of its primary currency rivals lately. The explanation seems to lie with today’s interest rate figures and subsequent press statement by the Bank of Japan (BOJ). Speculators have been trying to gauge whether or not the BOJ will announce vigorous actions to counter the recently surging JPY, as it poses a threat to the island economy’s exports.

Should today’s statements prove to be hawkish regarding the possibility of a future monetary program to combat the rising yen, we should see speculators jump in to short the JPY. However, if the BOJ remains neutral on the issue, or doesn’t issue a strong enough statement regarding potential monetary programs, then the JPY may continue to surge against its primary rivals in today’s trading.

Crude Oil – Oil Prices Steady at $74 a Barrel

The price of Crude Oil appears to have flattened out since last Friday’s Non-Farm Payroll data. Many market participants were pricing in an expectation for a surge in the USD, and therefore a plummeting price of oil, following Friday’s NFP data. Since disappointing data wasn’t delivered, and risk appetite remained steady, commodity prices also seem to have remained stagnant following the release.

As of this morning, the price of a barrel of Light, Sweet Crude Oil sits at $74.00. As this level represents a significant psychological price level, a sudden price breakout in either direction will likely provide signs of the next trend. For the moment, however, most investors are waiting to see what the Bank of Japan (BOJ) will do with its currency valuation and interest rates since that appears to be today’s lead story.

Technical News

EUR/USD

The EUR/USD has gone increasingly bearish yesterday, and currently stands at the 1.2815 level. The daily chart’s Slow Stochastic supports this currency cross to fall further today. However, the 4-hour chart’s Stochastic Slow signals that a bullish reversal will take place today. Entering the pair when the signs are clearer seems to be the wise choice today.

GBP/USD

The pair has recorded much bearish behavior yesterday. However, the technical data indicates that this trend may reverse anytime soon. For example, the daily chart’s MACD signals that a bullish reversal is imminent. . Going long with tight stops might be a wise choice.

USD/JPY

The pair has been range-trading for a while now, with no specific direction. The Daily chart’s Slow Stochastic providing us with mixed signals. All oscillators on the 4 hour chart do not provide a clear direction as well. Waiting for a clearer sign on the hourlies might be a good strategy today.

USD/CHF

The price of this pair appears to be floating in the over-sold territory on the daily chart’s RSI indicating an upward correction may be imminent. The upward direction on the 4- hour chart’s Slow Stochastic also supports this notion. When the upwards breach occurs, going long with tight stops appears to be preferable strategy.

The Wild Card

AUD/USD

This pair’s sustained upward movement has finally pushed its price into the over-bought territory on the daily chart’s RSI. Not only that, but there actually appears to be a bearish cross on the Slow Stochastic pointing to an imminent downward correction. Forex traders have the opportunity to wait for the downward breach on the hourlies and go short in order to ride out the impending wave.

Forex Market Analysis provided by ForexYard.

© 2006 by FxYard Ltd

Disclaimer: Trading Foreign Exchange carries a high level of risk and may not be suitable for all investors. There is a possibility that you could sustain a loss of all of your investment and therefore you should not invest money that you cannot afford to lose. You should be aware of all the risks associated with Foreign Exchange trading.
Short Term Technical Analysis for Majors (08:20 GMT)

EUR/USD

Corrective attempt 1.2586/1.2625, 24/31 Aug lows, stalled at 1.2916 yesterday, just below key resistance area at 1.2920/31. This may signal a completion of the corrective phase, with break below 1.2775 to open 1.2741 first, ahead of 1.2700. Upside, regain of 1.2875 1.2871 firms the tone, but sustained break above 1.2931 resumes the recovery.

Res: 1.2875, 1.2893, 1.2916, 1.2931
Sup: 1.2775, 1.2741, 1.2728, 1.2700

GBP/USD

Yesterday’s failure to break above 1.5490 triggered immediate pullback, turning the focus lower. 1.5344 has been reached so far, just above 1.5325, key near-term support. Break here to fresh weakness towards 1.5250/40 zone, though, correction higher may precede the downmove. Only above 1.5490 improve the near-term outlook.

Res: 1.5465, 1.5490, 1.5543, 1.5573
Sup: 1.5344, 1.5336, 1.5325, 1.5296

USD/JPY

Returns to the negative tone, following an upside rejection at 85.21 on 03 Sep and today’s fresh attempt at the recent consolidation floor at 83.66/51. Potential break here to open the next phase lower and target 81.88, May 1995 low, short-term. Only regain of 84.65 would provide a near-term relief.

Res: 84.52, 84.65, 85.00, 85.19
Sup: 83.66, 83.51, 83.10, 82.30

USD/CHF

Last Friday’s upside rejection at 1.0237 confirms weakness, with market currently pressuring key longer-term bear flag support at 1.0065. Break here will suggest a significant medium-term weakness, with initial targets standing at 0.9980/16. Upside remains capped by 1.0141/86.

Res: 1.0141, 1.0186, 1.0224, 1.0237
Sup: 1.0065, 1.0027, 1.0000, 0.9980

Technical Analysis by WindsorBrokersLtd.com

Forex Daily Market Review Sep 07, 2010

By eToro – President Trichet said over the weekend that the probability of a double-dip back into recession had fallen though the central bank remained cautious. The Euro consolidated during the US Labor day holiday.

Click here to read the full daily Review

Forex Market Analysis provided by eToro

Disclaimer: Trading in the Foreign Exchange market might carry potential rewards, but also potential risks. You must be aware of the risks and are willing to accept them in order to trade in the foreign exchange market. Don’t trade with money you can’t afford to lose.


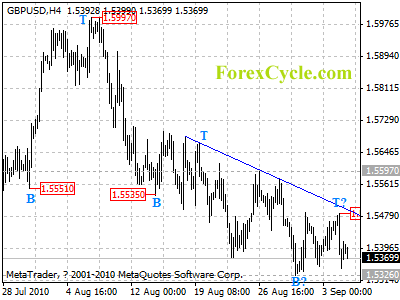
GBPUSD failed to break above the trend line resistance

GBPUSD failed to break above the trend line resistance and dropped from 1.5488. Now the fall from 1.5488 could possibly be resumption of downtrend from 1.5997, another fall towards 1.5200 would more likely be seen, and a breakdown below 1.5326 will signal resumption of downtrend. Resistance remains at the falling trend line (now at 1.5495), only a clear break above the trend line resistance will suggest that the downward movement from 1.5997 is complete.

gbpusd

Daily Forex Signals

EUR/USD Reaches 1.2900 Following Better Than Expected Non-Farm Payrolls Results

Source: ForexYard

The US Non-Farm Payrolls wasted no time bringing the greenback down on Friday. The EUR/USD pair, which seemed very steady around the 1.2800 level before the report, promptly jumped due to the better-than-expected figures, and is currently trading around the 1.2900 level. Can the pair cross the 1.30 level this week?

Economic News

USD – Non-Farm Payrolls Report Further Weakens the Dollar

The U.S dollar fell against most of the major currencies during last week’s trading session. The dollar dropped over 200 pips vs. the euro, and the EUR/USD pair is now trading around the 1.2900 level; the dollar fell against the Japanese yen as well.

The catalyst for the dollar’s depreciation was the positive economic data released last week. The dollar’s fall began on Tuesday, as a report showed that consumer confidence in the U.S. increased more than economists had forecast in August. The survey shot up to 53.5 from a five-month low of 51 in July. This has begun easing concerns that the economy might face yet another slowdown. As the week progressed additional positive economic reports were published; the Institute for Supply Management’s gauge of manufacturing unexpectedly rose to 56.3 in August from 55.5 a month earlier, beating expectations for 53.2, showing that U.S. manufacturing expanded at a faster pace than expected.

The dollar’s bearish trend was highly enhanced on Friday, as the Non-Farm Payrolls report showed that the payrolls in the U.S. have decreased in August by merely 54,000, well above expectations for a decline of over 100,000 jobs. While this is still a negative result, it points out that the employment situation may finally be stabilizing. The positive data has boosted demand for riskier assets, and thus weakened the dollar and strengthened the euro.

Looking ahead to this week, many interesting economic publications are expected from the U.S, such as the Trade Balance figure and Unemployment Claims. Traders should take under consideration that if data continues to provide positive results, this will probably boost risk appetite in the market, causing the dollar to weaken.

EUR – Euro Rises Despite Disappointing Data

The euro rallied against most of its major counterparts during last week’s trading. The currency gained over 200 pips against the U.S. dollar and about 150 pips vs. the British pound, and the EUR/GBP cross is now trading near the 0.8350 level.

The euro rose against most of the major currencies despite rather disappointing data released from the major economies in the euro-zone. The European unemployment rate remained at a 12-year high of 10.0% in July as companies continued to cut costs to help shore up earnings. In addition, retail sales in Germany, Europe’s largest economy, unexpectedly fell for a second month in July. The report showed that sales dropped by 0.3% in July, failing to reach expectations for a 0.6% rise.
However, the negative data failed to impact the euro’s trading. It appears that investors have placed much greater significance on the positive data from the U.S, especially the better than expected Non-Farm Payrolls. The positive data from the U.S. economy has led investors to believe that global economic recovery is well on its way, and as a result turned them to open long positions on the euro and the pound, despite the unsatisfying data from the euro-zone.

As for this week, a batch of data is expected from the euro-zone. Traders are advised to pay attention to the publications from the leading economies, such as Germany and France. If the news provides positive economic reports, the euro might strengthen further.

JPY – Yen Closes a Bullish Week with Bearish Signals

The Japanese yen strengthened against most of the major currencies during the beginning of last week’s trading session. The yen gained about 150 pips against the U.S. dollar and about 300 pips against the British pound. However, by midweek the yen corrected most of its gains, especially against the euro and the pound

The yen began last week with a bullish trend following positive data from the Japanese economy. The Preliminary Industrial Production report unexpectedly rose by 0.3% on July, beating expectations for a 0.3% drop, and rising for the first time in 3 months. In addition, Japanese retails sales rose by 3.9% in July, beating analysts’ forecast of a 3.6% rise.

However, the bullish trend reversed by midweek following positive economic reports from the U.S. A number of publications have shown that the U.S. economy will probably evade another slowdown, as several economic indicators have shown better-than-expected results. This has boosted optimism in the global economic recovery and as a result increased demand for higher yielding assets, such as the euro and pound.

As for the week ahead, the most significant publication from the Japanese economy looks to be the Overnight Call Rate. The Over Night Call Rate is in fact the Japanese interest rates announcement for September. Analysts expect that the Bank of Japan (BoJ) will leave rates at 0.10%, the lowest in the industrial world. However, if the BoJ will unexpectedly decide to hike rates, heavy volatility is likely to take place.

Crude Oil – Crude Oil Closes a Volatile Week near $74.50 A Barrel

Crude oil saw an extremely volatile session during last week’s trading. Crude began last week with a sharp fall to $71.50 a barrel. However by Tuesday crude saw a trend reversal that brought it up to $75.40 a barrel.

Crude oil fell during the beginning of last week due to concerns that the U.S. economy, the world’s largest oil consumer, might face another slowdown. However, as the week progressed, several positive reports were published from the U.S. economy, easing investor’s concerns. The reports showed that the American people have more confidence in their secure financial outlook, and that the manufacturing activity has expended at a faster pace than expected in August. In addition, the Non-Farm Payrolls report showed that the employment situation in the U.S. may finally begin to stabilize. This in turn created speculation that energy demand could rise, and as a result boosted crude oil prices.

As for the week ahead, traders are advised to follow the major publications from the U.S. and the euro-zone, as they tend to have the largest impact on crude oil trading. Traders are also advised to follow the U.S. Crude Oil Inventories figure, which is scheduled to be released on Thursday, as this report usually has an instant impact on crude oil.

Technical News

EUR/USD

Most technical indicators are showing this pair trading well in overbought territory, which typically means that a downward correction could take place in the near future. The Williams Percent Range on the daily chart is currently at the -5 mark. Anything above -20 is considered to be overbought. The Stochastic Slow on the 8-hour chart shows a cross forming above the upper resistance line, indicating that downward pressure could come soon. Traders are advised to go short with tight stops today.

GBP/USD

The Relative Strength Index on the 8-hour chart shows the pair approaching overbought territory. That being said, most other indicators are showing the pair in neutral territory. Traders may want to take a wait and see approach today to better determine a clear direction for this pair.

USD/JPY

After tumbling in last week’s trading session, it appears that the pair is finally in stable territory. Most technical are not showing a clear direction for this pair at the moment. The one exception is the MACD on the 8-hour chart, which is indicating a bullish correction could occur. Traders will want to watch out for any upward movement for this pair.

USD/CHF

The Williams Percent Range on the daily chart is showing the pair trading on the border of oversold territory, indicating an upward correction could occur today. The Relative Strength Index on the 8-hour chart is showing the pair close to being oversold. Traders are advised to go long in their positions today.

The Wild Card

AUD/USD

The Relative Strength Index on the daily chart is showing the pair trading well in overbought territory, indicating a downward correction could occur in the near future. This theory is supported by the Williams Percent Range, also on the daily chart, which is currently at the -5 mark. Forex traders may want to go short with tight stops in their positions today, as a downward correction will likely take place.

Forex Market Analysis provided by ForexYard.

© 2006 by FxYard Ltd

Disclaimer: Trading Foreign Exchange carries a high level of risk and may not be suitable for all investors. There is a possibility that you could sustain a loss of all of your investment and therefore you should not invest money that you cannot afford to lose. You should be aware of all the risks associated with Foreign Exchange trading.
Forex Weekly Market Review Sept 6, 2010

By eToroEquity markets moved higher during the week as the markets absorbed
numerous economic data points that lead to a market rally.
The combination of strong manufacturing data (ISM), robust housing
numbers (pending home sales), and a better than expected payroll
report from the Department of Labor pushed the US markets higher.
For the week, the S&P 500 index settled higher by 40 to 1104.

Click here for the full review

Forex Market Analysis provided by eToro

Disclaimer: Trading in the Foreign Exchange market might carry potential rewards, but also potential risks. You must be aware of the risks and are willing to accept them in order to trade in the foreign exchange market. Don’t trade with money you can’t afford to lose.

Australian Dollar’s Silent Rise

audusd, australian dollar, aussie, aud, usd, us dollar, forex, forex market, forex trading, daily forex picks, currency trading, forex forecast, forex analysis

Good day to you my fellow FX men and women! Today I present to you the daily chart of the AUDUSD. As you can see, the pair has been trading within an ascending channel since the middle of May 2010. Of course, the pair would more like trend higher as long as the channel’s support does not buckle. The Aussie, however, could meet some resistance at the pair’s previous high near the 0.9200 level. With the stochastics in the overbought area, it could rest for a while before making another move to the north. A move past the 0.9200 level could push it towards 0.9300. The Elliot Wave Principle (EWP) also seems to confirm this potential price action. If my wave counting is correct, the AUDUSD could already be in its fifth wave. This then suggests that the next short term up-move would more likely surpass the peak at 0.9200.

Recent economic data in Australia goes to support the positive sentiment towards the Aussie. For one, the corporate profits of Australian firms for the second quarter of the year have unexpectedly soared by 18.9% compared to the market’s 5.9% growth forecast. The firms’ 1Q scores were also positively revised to 4.3% from 3.9%. The country’s building approvals have also expanded for the first time in 5 months. The account surprisingly rose 2.3% in July after dipping by 3.4% during the previous month. Retail sales for the same period have also shown some good figures, expanding by 0.7% in July and 0.4% in June. More importantly, the country’s second quarter gross domestic product (GDP), has surpassed the market’s 0.9% forecast with a 1.2% growth. the first quarter’s overall output expansion was also revised upwards to 0.7% from 0.5%.

On Tuesday (September 7), the Reserve Bank of Australia will have its monetary policy decision. While the bank is still expected to hold its benchmark interest rates at 4.5%, the bank’s tone would more likely lie towards the hawkish end of the spectrum given the improvements economy. Any positive outlook regarding the country would of course be bullish on the Australian dollar as well.

More on LaidTrades.com

Forex and Some Important Facts about Bollinger Bands

By Sutikno Slamet – Forex trading is nowadays one of the most looked after occupation for many persons of all ages around the world. This is due to its great advantages over other capital markets and its high profitability potential; among these advantages you will find that is extremely easy to access a trading platform from the best forex broker firms thanks to the internet; and also you will notice that Forex has a high liquidity along with a high leverage.

But having a good broker firm and great trading platform is only one part of what you need in order to make your forex trading career a winning and profitable one. You need to have the right knowledge and techniques in order to forecast with the best accuracy what the market will do next. One of the techniques used to predict the Forex market behavior is that based on Bollinger Bands.

These Bollinger Bands are what is called a technical trading tool and they are widely used in the capital markets (including Forex) and were created by John Bollinger in the early 1980s. These bands technique was formulated based on the need for adaptive trading bands and the discovery that the volatility of the markets was a dynamic phenomena, not a static one as was widely believed at the time.

Bollinger Bands consist of a chart of three curves drawn in relation to currency pairs prices. The band situated in the middle is a measure of the intermediate-term trend and is usually a simple moving average, that serves as the base for the upper and lower bands. The interval between the upper, lower and the middle bands is determined by the volatility of the market, typically the standard deviation of the same data that were used for the moving average. The default parameter is 20 periods and two standard deviations above and below the middle band; of course this may be adjusted to suit your needs.

In short, the purpose of Bollinger Bands is to provide a relative definition of high and low price. By definition prices are considered high when touching the upper band and low when they touch the lower band. This relative definition can be used by the Forex trader to compare price actions and as a very useful indicator when the purpose of the trader is to arrive at rigorous buy and sell decisions.

About the Author

Forex Blog – FREE Forex Tips and Resources! Click Here To Get All You Need To Know About FOREX!

The Ultimate Technical Indicator

By Mr. Ahmad Hassam – There are so many technical indicators that you can use like the bollinger bands, the relative strength index (RSI), the stochastic, the simple moving averages, the exponential moving averages, the moving average convergence divergence (MACD), the channel commodity index (CCI) and so that you are not sure which is the best one among them. Rather, every day a new technical indicator is hitting the market with the technician who developed that indicator claiming it is the best one. So what is the best technical indicator that one can use in forex trading or for that matter in trading?

So what is the Ultimate Technical Indicator? Well, to tell you the truth, there is one indicator that will always stand above the rest. And that indicator is the price action. You see all these technical indicators are formulas that are applied to the price action to get a trading signal.

Now, in the currency market, there is no absolute price. However, currencies are priced relatively in terms of other currencies. So we may talk of USD priced relative to GBP or Euro priced relative to USD. Now this might be confusing for those traders and investors who have been trading other markets where prices are always absolute.

Now support is the price where buyers step in and start buying en masse. Think of the support as the floor. When you hit a rubber ball on the floor, it bounces back and returns to you. The price action bounces back from the support in the same way.

In the same way resistance is just like the ceiling of a room. When you throw a ball up, it will hit the ceiling and bounce back in your hands. Resistance works in the same way in the market and can be taken as a ceiling in the market where price action bounces back.

You need to understand this that large players like the big banks, hedge funds and the institutional investors trade in a totally different manner as compared to us the small traders. As a small trader, we want to enter and exit all at once since our order size is too small.

So instead of entering the market all at once, these large players enter the market gradually. This way they avoid moving the market all at once and driving the currency price up.

When the price reaches the support or the desired entry level of these big banks or hedge funds, they enter the buy order. Similarly in case of a large seller, a single order might drive the price still lower. So a large seller will always enter the market gradually. This way, you see the price bouncing back and forth between support and resistance.

About the Author

Mr. Ahmad Hassam has done Masters from Harvard. Learn this powerful Fibonacci Retracement Strike FREE that pulls 500+ pips per trade! Get this 1 Minute Forex Trading System FREE that makes money anytime instantly.

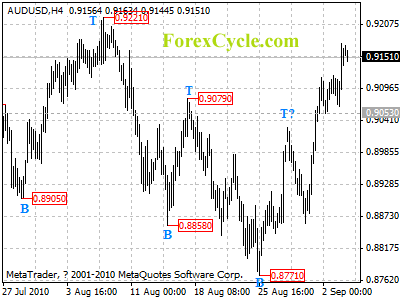
AUDUSD’s upward move extended to 0.9175

AUDUSD’s upward movement extended to as high as 0.9175 level. Further rise towards 0.9221 previous high is still possible later today, minor consolidation would more likely be seen before breaking above this level. Support is now at 0.9053, a breakdown below this level will indicate that consolidation of uptrend is underway, then deeper decline could be seen to 0.9000 area.

audusd

Daily Forex Forecast