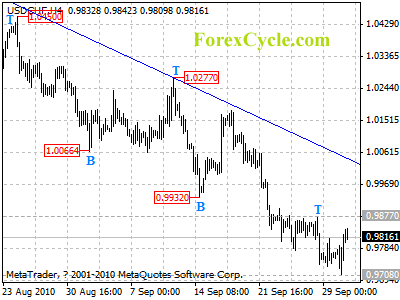
USDCHF stays below a falling trend line

USDCHF stays below a falling trend line from 1.0624 to 1.0277 and remains in downtrend. As long as the trend line resistance holds, downtrend from 1.1730 (Jun 1 high) is expected to continue and another fall towards 0.9634 (2008 low) is still possible after a minor consolidation. Resistance is now at 0.9877, a break above this level will indicate the a cycle bottom has been formed at 0.9708 level on 4-hour chart, then lengthier consolidation of downtrend could be seen and further rally towards the trend line resistance is possible.

usdchf

Daily Forex Signal

Three Common Mistakes People Make When Trading the Markets

By Owen Trimball – One of the attractive things about trading the stock market is, that when looking at a chart of the stock, it is known to have reliable patterns which most of the time are good predictors of future direction. Whether it be a “head an shoulder” reversal pattern or simply riding the directional momentum on the basis that “the trend is your friend”, a good trader can do very well – and with the availability of leveraged instruments such as options and CFDs, can earn a very good living.

In fact, it has been said that one of the most profitable skills you can ever master, is the art of trading.

But every so often, the market does the unpredictable. It makes a strong move in the wrong direction, just when all the signs looked like it should go the other way. This is usually due to some news item that has been released and the market, in its usual efficient manner, reacts accordingly. If the news is sensational enough, the investing public can behave quite irrationally, driven by fear (if it’s bad news) or greed (if the news is positive). The momentum of the price move takes on a life of its own and continues until it either blows itself out, or in the case of a downward move, fear is replaced by the perception that a bargain is on offer.

While markets are moving in predictable directions based on well established and generally reliable price patterns, all seems well. It’s the unexpected moves that come out of left field that a disciplined trader needs to be prepared for.

So let’s take a look at the three most common mistakes traders make, which separates those who make a lot of money from those who end up losing it all.

1 – Bad Risk Management

It is critical before you even think about trading, that you have a risk management plan. You have a certain amount of capital to trade with and it is essential that you preserve it intact, otherwise you’re out of the game.

One of the most common mistakes is investing too much on any one trade. You might feel very confident that price direction will go as expected, but this could be one of those exceptions already mentioned. You either lose a large percentage of your available capital, or you get stuck in a trade, hoping it will turn around – and in the meantime, miss out on all those other opportunities that could’ve made you some great profits.

So it is essential to only invest a small portion – no more than 10 percent but preferably 5 percent – on any one trade. This is particularly the case if you’re using leveraged instruments such as options, futures or CFDs.

Losing 20 percent of 10 percent of your available capital traded on one trade is the equivalent to only 2 percent of your entire trading bank. Psychologically, this is easier to handle. But the law of averages will mean that you also have other capital available for other trades whose profits will far outweigh the loss on one bad trade.

2 – Staying in Too long

Once your trade has realized a target profit, it is far better to close out a trade and bank the money, than hold on in the hope that it will make a lot more. Too often, the good fortune will reverse without notice and your unclaimed profit will turn into a loss. You need to develop a mindset that, even if the trade were to blast off into stellar profits after you exited, that at least you can be content that you achieved some of it – and that the strong movers are more the exception than the rule.

The above is especially true with the likes of short term option trading. Better to take 30 – 50 percent profit on a good trade than be disheartened when your leverage turns around and works against you because you stayed in for too long.

3 – Not Having a System

When trading the markets you can’t afford to make emotional decisions. In the end, you must realize that it’s only a numbers game. The first mistake a lot of traders make is approaching the market without any plan in place. You must define the aim of your system. Do you want to trade the extremes of ranges, or do you want to catch trends – or both? What success ratio do you need to be profitable? In connection with this success ratio, what must your percentage profit be in relation to percentage losses on any one trade for your success ratio to work?

What indicators or form of analysis will you use? What time frame do you wish to trade – day trading or longer term? Once you decide this, what chart periods will you focus on – 5 minute, hourly, daily or weekly?

If you don’t have a plan of your own, it would be wise to follow someone else’s trading system, providing it is tried and tested over years and is known to achieve consistently profitable results.

About the Author

One of the world’s most profitable option traders is Kim Reilly. His system is simple yet powerful and made him over a million dollars. You can learn to trade options from him with confidence.

US GDP growth revised higher to 1.7 percent in 2Q. Jobless Claims fall. Dollar mixed in Forex Trading.

By CountingPips.com

The U.S. economy expanded in the second quarter of 2010 for a fourth straight quarter at a slightly quicker pace than previously reported, according to a release by the U.S. Commerce Department. The third government estimate showed that the U.S. Gross Domestic Product grew on an annualized basis by 1.7 percent in the April to June quarter following a real 3.7 percent growth rate in the first quarter.

The first estimate for the second quarter, released in July, had shown GDP growth by 2.4 percent but was revised lower to a 1.6 percent growth rate in the second estimate released in August. The second quarter is the fourth consecutive quarter of U.S. economic growth after the GDP had fallen for four straight quarters over the second half of 2008 and the first half of 2009.

The latest data was boosted by an uptick in consumer spending to 2.2 percent from the last estimate that registered a 2.0 percent increase in consumer spending.

Today’s GDP news surpassed market forecasts that were expecting GDP growth to be steady at 1.6 percent for the quarter.

The first estimate for the third quarter GDP data is scheduled for October 29th.

Weekly Jobless Claims fall by 16,000

U.S. weekly jobless claims decreased by more than expected in the week that ended on September 25th, according to a release by the U.S. Labor Department today. New jobless claims fell by 16,000 workers to a total of 453,000 unemployed workers. The 4-week moving average of unemployed workers decreased by 6,250 workers from the previous week to a total of 458,000.

Market forecasts were expecting jobless claims to edge down to 460,000 workers following the prior week’s 469,000 revised number of claims.

Meanwhile, workers seeking continuing claims for unemployment benefits for the week ending September 18th also decreased for the week. Continuing claims declined by 83,000 workers to a total of 4,457,000 unemployed workers.

Continuing claims also came in better than market forecasts that were expecting a total of 4,473,000 claims. The four week moving average of continuing claims dropped by 5,500 workers to a total of 4,526,750.

US dollar mixed in Forex Trading, Stocks lower

The U.S. dollar has been mixed in forex trading today against the other major currencies while the U.S. stock markets have been slightly lower for the first half of the day. The dollar has been increasing today versus the euro, British pound  sterling, Swiss franc, Australian dollar and the New Zealand dollar, according to currency data by Oanda. The American currency has been on the defensive so far today against the Canadian dollar and the Japanese yen.

The U.S. stock markets, meanwhile, have been negative so far today with the Dow Jones declining by nearly 50 points, the Nasdaq decreasing almost 20 points and the S&P 500 down by over four points at time of writing. Oil has advanced by $0.89 to $78.75 while gold has fallen by approximately $7.00 to near the $1,300 per ounce level with the current price at the $1301.50 per ounce level.

Forex Daily Market Commentary

By GCI Forex Research

Fundamental Outlook at 0800 GMT (EDT + 0400)

USD

The dollar managed to stage a mild recovery during the Asia session as economic data in Australia, New Zealand and Japan took a turn for the worse. EURUSD traded 1.3593-1.3647, USDJPY 83.48-83.82. Nevertheless, the potential for a further round of Fed quantitative easing remains a dominant influence on price action. San Francisco Fed President Yellen and nominee Ruskin were confirmed by the Senate, and will now be able to take their places on the Fed’s Board of Governors. Several Fed officials also spoke. Boston Fed President Rosengren, a 2010 FOMC voter, said the Fed should vigorously and creatively use policy options to combat a slow recovery and “undesirably low” inflation. But he also warned that benefits of unconventional policies are harder to track and more easing should depend on incoming data. Minneapolis Fed President Kocherlakota was slightly more middle-of-the road as he envisions “muted” effects from further asset purchases on Treasury yields. He remained open-minded on which tool the Fed could use next but said the US needs to get its fiscal side in order in the longer run. And Philadelphia Fed President Plosser worried about the downside effects of further easing though he would back it if deflationary expectations emerge, which he does not expect. Kocherlakota and Plosser are voting members in 2011.
The varying opinions suggest the FOMC will wait and watch data for now. But officials do seem more in agreement on labour market concerns and on the need for more fiscal moves. The second revision of Q2 GDP is due along with jobless claims and Chicago PMI. Fed Chairman Bernanke testifies on regulatory reforms.
EUR

Our analysts believe the French 2011 Financial Bill represents the first step on a long journey but they note that the proposed deficit is still far from sustainable. Sovereign deficits continue to weigh on investor sentiment and EU Commission President Barroso said Portugal needs to show it is serious about tackling its deficit issues.
The Irish central bank announced that the domestic banking system will required further government-sponsored capital injections. The Irish Finance Minister said that holders of subordinated debt of a nationalized bank would be expected to make a significant contribution to the bailout.
JPY

Key August economic data was weak with retail sales softer than expected, rising only +1.4% m/m (cons. +1.9%, prev. +0.7%). Industrial production rose by +15.4% y/y, considerably short of expectations of +16.9% y/y. The yen weakened very slightly on the numbers, demonstrating that US yields continue to be the principal driver in the pair.
CAD

Canadian Finance Minister Flaherty said the economy is on track for the year even if the upcoming July GDP print may turn out to be negative, which is in line with consensus expectations. But at this stage, the US recovery is a larger driver and has kept the CAD under pressure versus the rest of the G10. Even if the Canadian recovery remains on track, the BoC policy rate outlook could be tempered given the Fed’s potential to ease further.


AUD

The Australian Dollar came under mild selling pressure after some weak economic data. Building approvals fell -4.7% m/m (cons 0.0%, prev. 0.1%) and the annualized figure rose by less than expected at +4.4% y/y (cons. +10.8%, prev. +11.1%). Private lending growth also disappointed coming in at +0.1% m/m (cons. +0.3%, prev. +0.3%). Our analysts team believes that this is further evidence of weakness in forward-looking indicators of housing activity. They continue to expect the RBA to start the next phase of the hiking cycle this year, most likely October, but it could be November.

TECHNICAL OUTLOOK


USDCHF next support at 0.9625.
EURUSD BULLISH The gains are expected to move towards 1.3692 and 1.3896 next. Near-term support comes in at 1.3381 ahead of 1.3287.
USDJPY BEARISH The break of 84.05 brings our focus back on the downside at 82.88. Resistance remains at 84.50 ahead of 85.40.
GBPUSD BULLISH Bullish pressure held at 1.5895 ahead of 1.5999 key high; scope for 1.6253 next. Support is defined at 1.5719 ahead of 1.5503.
USDCHF BEARISH Next support below 0.9625 lies at 0.9500 psychological level. Resistance at 0.9918 breakout low.
AUDUSD BULLISH Upside potential is expected to target 0.9850 with scope for 1.000 psychological resistance next. Support is at 0.9559 ahead of 0.9463.
USDCAD NEUTRAL 1.0509 and 1.0108 mark the near-term directional triggers.
EURCHF NEUTRAL Trading in a choppy manner within 1.3391 and 1.2991 range.
EURGBP BULLISH Break through 0.8606/0.8609 resistance area exposes 0.8736 ahead of 0.8808.
EURJPY BULLISH Momentum is positive; clearance of 114.74 would expose 116.68 and 119.33. Near-term support comes in at112.67 ahead of 110.66.

Forex Daily Market Commentary provided by GCI Financial Ltd.

GCI Financial Ltd (”GCI”) is a regulated securities and commodities trading firm, specializing in online Foreign Exchange (”Forex”) brokerage. GCI executes billions of dollars per month in foreign exchange transactions alone. In addition to Forex, GCI is a primary market maker in Contracts for Difference (”CFDs”) on shares, indices and futures, and offers one of the fastest growing online CFD trading services. GCI has over 10,000 clients worldwide, including individual traders, institutions, and money managers. GCI provides an advanced, secure, and comprehensive online trading system. Client funds are insured and held in a separate customer account. In addition, GCI Financial Ltd maintains Net Capital in excess of minimum regulatory requirements.

DISCLAIMER: GCI’s Daily Market Commentary is provided for informational purposes only. The information contained in these reports is gathered from reputable news sources and is not intended to be U.S.ed as investment advice. GCI assumes no responsibility or liability from gains or losses incurred by the information herein contained.

Dollar Falls to a 5-Month Low

Source: ForexYard

The US dollar reached its lowest level against the euro in five months Wednesday, as investors anticipated a Federal Reserve move to boost the ailing economy by renewing spending policies.

Economic News

USD – Dollar Continues to Slide

The US dollar fell for a fourth straight session on Wednesday, hitting a fresh five-month low against the EUR, as traders brace for more weakness amid growing prospects for further U.S. monetary easing. By yesterday’s close, the USD fell against the EUR, pushing the oft-traded currency pair to 1.3630. The dollar experienced similar behavior against the JPY and closed at 83.50 level.

Generally weak U.S. economic data has fueled speculation the Federal Reserve could embark on a second round of quantitative easing, which would be negative for the dollar. That drove the greenback to a two-year low against the Australian dollar and a 2-1/2-year low versus the Swiss franc.

Investors may expect unusual price volatility to continue for the EUR/USD as the pair attempts to stabilize and find new support and resistance lines. Large price jumps such as these are not common place and present terrific opportunities to take advantage of price swings for large profitable gains.

Looking ahead to today, the most important economic indicator scheduled to be released from the U.S. is the Unemployment Claims at 12:30 GMT. Analysts are forecasting this figure to increase from its previous reading. Traders will be paying close attention to today’s announcement as a stronger than expected result may boost the USD in the short-term. Traders are also advised to follow Federal Reserve Chairman Ben Bernanke’s Speech at around 18:30 GMT. This speech is very important and is very likely to impact the dollar.

EUR – EUR Strongly Advances against Dollar

The EUR strengthened against most of the major currencies yesterday as gains in commodities prompted investors to wade into riskier currency trades. The 16 nation currency extended gains to hit a fresh five-month high against the dollar and closed at around 1.3630. The EUR experienced similar behavior against the JPY as the pair rose from 113.45 to 114.15 by days end.

At the same time, the UK pound was near its weakest in more than four months against the EUR, as a report showed U.K. mortgage lending fell for a fourth month in August, adding to signs the recovery is faltering. The British currency slipped for a second day versus the EUR and closed around 0.8620.

Lenders granted 47,372 loans to buy homes, compared with a revised 48,346 in July, the Bank of England said today in London. Economists forecast that approvals would decrease to 47,000 from an initially reported 48,700 in July. The British currency was close to its strongest versus the dollar in six weeks on speculation the Federal Reserve will loosen monetary policy to shore up growth.

Looking ahead to today, the Euro-Zone and Britain are set to publish a number of important data releases. These include the British Nationwide HPI at 6:00 GMT and the German Unemployment Change at 7:55 GMT. These figures are likely to determine the GBP and EUR’s strength going into the end of this week’s trading.

JPY – Yen Experiences Mixed Results against Major Currencies

The Yen completed yesterday’s trading session with mixed results versus the other major currencies. The JPY was broadly unchanged versus the GBP yesterday and closed its trading session at around the 132.40 level. The JPY also saw bearishness against the EUR and closed at 114.15.

The JPY’s trends will be affected by the rallies of its primary currency pairs today. It seems that the USD and EUR are expected to continue a volatile trading session today, especially against the Japanese currency. Traders should keep a close look on the news coming from the U.S. and Europe as these economies will be the deciding factors in the JPY’s movement today. It is also advisable for traders to follow any unexpected comments coming from key Japanese governmental figures, as this will also likely to lead to further JPY volatility.

Crude Oil – Oil Recovers, Rises Above $77.50 a Barrel

Crude oil rose to a seven-week high after a U.S. government report showed an unexpected decline in gasoline supplies as refiners cut operating rates to the lowest level since April. Oil also increased as the dollar fell to a five-month low against a basket of currencies.

Oil and other commodities denominated in dollars for global trading tend to rise when the U.S. currency falls as they become cheaper for holders of other currencies. A move away from dollar-based pricing of the world’s leading commodity could further weaken the greenback.

As for today, traders are advised to watch carefully the leading stock markets and the major economic indicators which will be published from the U.S. and euro-zone in order to predict the next movements in oil prices.

Technical News

EUR/USD

The EUR/USD cross has been experiencing much bullish behavior in the past 3 weeks. However, there is technical data that supports a bearish move for today. The RSI on the daily and 4-hour charts indicates that the pair floats in overbought territory, leading to the conclusion that a downward correction is imminent. Going short with tight stops may turn out to pay off today.

GBP/USD

The price of this pair appears to be floating in overbought territory and the daily chart’s RSI indicates a downward correction may be imminent. The downward direction on the hourly chart’s Momentum Oscillator also supports this notion. When the downwards breach occurs, going short with tight stops appears to be preferable strategy.

USD/JPY

The USD/JPY cross has experienced bearish movement for the past 2 weeks, however it seems that this trend may be coming to an end. The RSI of the daily chart shows the pair floating in the over-sold territory, indicating that an upward correction will happen soon. Going long with tight stops might be a wise choice.

USD/CHF

The cross has been dropping for the past month now, and it now stands at the 0.9770 level. However, the weekly chart’s RSI is already floating in oversold territory indicating that a bullish correction may take place in the near future. Going long with tight stops may turn out to be the right choice today.

The Wild Card

AUD/USD

This pair’s sustained upward movement has finally pushed its price into overbought territory on the 8-hour chart’s RSI. Not only that, but there actually appears to be a bearish cross on the Slow Stochastic indicating an imminent downward correction. Forex traders have the opportunity to wait for the downward breach on the hourlies and go short in order to ride out the impending wave.

Forex Market Analysis provided by ForexYard.

© 2006 by FxYard Ltd

Disclaimer: Trading Foreign Exchange carries a high level of risk and may not be suitable for all investors. There is a possibility that you could sustain a loss of all of your investment and therefore you should not invest money that you cannot afford to lose. You should be aware of all the risks associated with Foreign Exchange trading.

USD/JPY – Declining Wedge Pattern

By Russell Glaser – A distinct declining wedge pattern has formed on the monthly USD/JPY chart that could signal a reversal of the downward trend.

The wedge pattern is defined as a triangle pattern with both trend lines that are pointed in the same direction. This falling wedge has both lines pointed to the downside with the upward boundary line falling at a faster slope than the lower boundary.

When a declining wedge pattern forms, it indicates the shorts are weakening in strength and perhaps the bulls will take over with a reversal of the trend. Because this is a declining wedge, we should expect the price to breakout to the upside.

As the long term trend is clearly to the downside, traders will need to be extra patient before taking a long position. There is a need to wait for a clear signal that a breakout to the upside has occurred. Next month the price could test the resistance level at 90.80. A close above this on a monthly basis would confirm the breakout.

However, there is always a chance the pair will surprise the market and break to the downside. Traders should eye a breach below the 82.80 level for a sign of a continuation of the downtrend.

Forex Market Analysis provided by ForexYard.

© 2006 by FxYard Ltd

Disclaimer: Trading Foreign Exchange carries a high level of risk and may not be suitable for all investors. There is a possibility that you could sustain a loss of all of your investment and therefore you should not invest money that you cannot afford to lose. You should be aware of all the risks associated with Foreign Exchange trading.

GBPUSD moves sideways

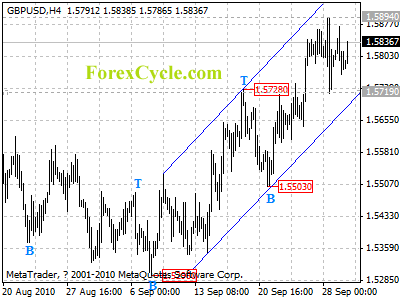
GBPUSD moves sideways in a range between 1.5719 and 1.5894. The price action in the trading range is treated as consolidation of uptrend from 1.5296. Support is at the lower border of the rising price channel, now at 1.5690, uptrend is expected to resume after touching the channel support. However, a clear break below the lower border will indicate that the uptrend from 1.5296 has completed at 1.5894 already, then the following downward move could bring price to re-test 1.5296 previous low support.

gbpusd

Daily Forex Reports

Why Some Investment Styles Are No Better Than Gambling

By Sara Nunnally, Editor, Smart Investing Daily, TaiPanPublishingGroup.com

I’ve been to Las Vegas a few times in my life: Once on a cross-country road trip after college, once for a bachelorette party, and once to present at an investors’ conference.

Now, I’m back for Taipan Publishing Group’s annual Global Opportunities Summit, and we’re in an apt place to talk about investing.

Vegas is a world of its own. I’m not a big gambler, but I can understand the draw of potentially winning a mountain of cash. And it got me thinking about how some investment philosophies are no better than putting a “C-note” down at the roulette table.

In a way, you could consider many types of investing a gamble. There’s always the potential for most investments to lose value.

The trick is to know the odds, and limit the potential losses, and there are very good ways to do that, such as stop-losses, dollar-cost averaging, hedging and a number of other methods.

We’ve told you about some of them here at Smart Investing Daily.

But for some investors, chasing that next ten-bagger is too tempting to ignore.

A more aggressive investment portfolio tends to be for more risk-tolerant investors. Knowing your risk tolerance is a must when you’re dabbling in high-yield/high-risk assets. These investment portfolios can also require increased monitoring by you, so you need to know if you even have the time to take on some of the more aggressive investment portfolio tactics.

If you meet these criteria, here are some tips to help keep your head above water.

(Remember, investing doesn’t have to be complicated. Sign up for Smart Investing Daily and let me and my fellow editor Jared Levy simplify the stock market for you with our easy-to-understand investment articles.)

Learn How to Legally “Trick” a Mutual Fund Into Paying for Your Retirement

You could “siphon” thousands of dollars a month from the profits of the mutual fund industry.

Get all the details from New Growth Investor.

Beware of Fad Stocks

Fad stocks can give your investment portfolio a much-needed boost, but they can also turn on a dime.

Take CROCS (CROX:NASDAQ), for example. Back in 2006, this stock traded for $13.70… Then it went gangbusters, climbing as high as $68.98 in 2007. A fantastic gain of 403%!

But during the global financial crisis, CROCS fell to just over $1 a share. This massive drop wasn’t just because the economy was tanking. It was because CROCS had been bid up so high as investors jumped into the fad.

Aggressive investors may look at that +400% gain, and say, “Hey, it’s worth the risk.” But you have to know when to get out.

Watch for short-sellers entering into the market. When a stock gets too hot, the short-sellers’ mouths start watering, and once the stock turns, this could send fad stocks lower hard and fast.

Use Stop-Losses for Global Markets

With the globalization of the financial markets, trading has become a 24/7 business. This is a good thing, and investors all over the world have access to both major and growing markets.

The thing is, you need to be up on what’s happening in the farthest reaches of the world, and that might require you to actually “be up” into the wee hours of the morning keeping trades under your watchful eye… And that’s not always practical.

That’s why stop-losses are so important. Not only do they allow you to get some sleep if you’re watching the currency markets and the Japanese yen, they help you limit the amount of money you put at risk.

This method is good for both day traders and “buy and hold” investors. It’s a great tactical maneuver, and if your understanding of whatever financial asset you’re investing in is very tuned in, you can place these losses in very key points to save gains and protect your investment from turning against you.

URGENT: China’s 98% Monopoly on This Resource Is Causing Panic at the Pentagon!

China has seized a near total monopoly on supplies of a natural resource treasure that is 100% mission critical to just about every piece of military technology – from satellites to smart bombs.

Learn what these materials are… why they are so critical… and how a pending Department of Defense report could make you gains of 20-to-1 in this URGENT FREE REPORT.

Stash Some Cash

Never underestimate the value of liquid net worth.

Some portfolio managers suggest that those investors close to retirement or already retired hold two to five years’ worth of living expenses as cash.

Aggressive investors may opt to hold much less. But they should at least hold some. By holding cash, you have a lot more flexibility when timing your investments. You can react to new investment ideas very quickly, which can allow you to take advantage of more gains than someone who has to worry about liquidating some assets before they invest in something new.

Holding cash is also important for when your investments turn against you, especially since many aggressive investors don’t live off their portfolio’s returns.

Of course, the ratio of cash in your investment portfolio is a completely individual choice, but maintaining some balance is always a smart idea.

At our annual summit, all of Taipan Publishing Group’s editors are presenting different ideas of what you should do with your money. Some ideas are for buy-and-hold investors, and some are for those aggressive traders.

But regardless of what type of investment portfolio you have, today’s financial markets require you to be alert and nimble.

Cash, stop-losses and timing are key components for every investment strategy.

Don’t forget to follow us on Facebook and Twitter for the latest in financial market news, investment commentary and exclusive special promotions.

About the Author

Sara is Co-Editor of Smart Investing Daily. As Senior Research Director and global correspondent, Sara Nunnally’s diverse resume includes studies in art history, computer science and financial research. She has appeared on news media such as Forbes on Fox, Fox News Live, and CNBC’s Squawk Box, as well as numerous radio shows around the country.

As Senior Research Director, global correspondent and co-editor of Smart Investing Daily, Sara has traveled all over the world in search of the best investment opportunities to recommend to her readers, be they in developed economies like France and Italy, in emerging markets like the Czech Republic and Poland, or in frontier terrain like Vietnam and Morocco. Her unique “holistic” approach of boots-on-the-ground research has given her an edge in today’s financial marketplace as she searches for the next investment opportunities in hot sectors like alternative energy, currency markets and commodities.
A Trader Walks Into A Bar… Pattern: HOP-portunity On Tap

A free Club EWI resource reveals how bar patterns signal high-probability trade setups

By Elliott Wave International

There’s a little known joke among the trading community that goes like this: “A trader walks into a bar… pattern: ‘Ouch!’ “

Fact is, if you don’t know what you’re doing, price bar analysis can be a bit “painful.” Finding a discernable pattern in their grouping can feel like finding a hair in a hay stack.

But if you have the right teacher — say someone who has used bar pattern analysis for twenty-plus years to signal dramatic moves in some the world’s most watched markets — well, then the discipline is invaluable. And right now, EWI is offering just that, free: the 15-page eCourse Book titled “How To Use Bar Patterns To Spot Trade Set-ups” by EWI’s chief commodity analyst and Futures Junctures Service editor Jeffrey Kennedy.

In this free 15-page resource, Jeffrey Kennedy shows you the top 6 bar patterns from his personal repertoire. He provides each pattern with a definition, illustrations of its form, lessons on its application and how to incorporate it into Elliott wave analysis, and historical examples of its occurrence in major commodity markets.

Take, for instance, the eBook’s section on “Popgun” bar chart patterns. Jeffrey defines this configuration as a “two-bar pattern composed of an outside bar preceded by an inside bar.” (See chart below.) From its namesake (the old-fashioned cork-and-string toy gun), popguns introduce swift tradable moves (“the cork flying”) that are ultimately retraced (“the string pulling the cork back”).

For a real-life example, see the September 27 Daily Futures Junctures, where Jeffrey presents this daily chart of December Coffee that clearly identifies a “Popgun” at the May 2010 low.

As for the remaining 5 bar patterns featured in Jeffrey’s eBook — look no further than the complete, free15-page eBook. You can read “How To Use Bar Patterns To Spot Trade Setups” now with an instant, free Club EWI membership.

In this comprehensive collection, Jeffrey provides each pattern with a definition, illustrations of its form, lessons on its application and how to incorporate it into Elliott wave analysis, historical examples of its occurrence in major commodity markets, and ultimately — compelling proof of how it identified swift and sizable moves.Best of all is, you can read the entire, 15-page report today at absolutely no cost. You read that right. The How To Use Bar Patterns To Spot Trade Setups is available with any free, Club EWI membership.

This article was syndicated by Elliott Wave International and was originally published under the headline A Trader Walks Into A Bar… Pattern: HOP-portunity On Tap. EWI is the world’s largest market forecasting firm. Its staff of full-time analysts led by Chartered Market Technician Robert Prechter provides 24-hour-a-day market analysis to institutional and private investors around the world.