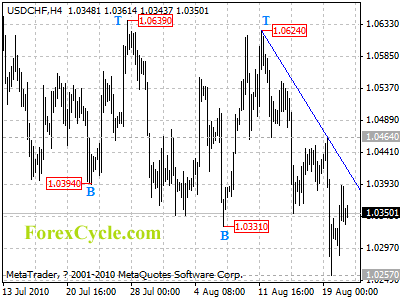
USDCHF stays below a downtrend line

USDCHF stays below a downtrend line from 1.0624 to 1.0464 and remains in downtrend. As long as the trend line resistance holds, downtrend is expected to continue and next target would be at 1.0200 area. On the other side, a clear break above the trend line resistance (now at 1.0415) will indicate that a cycle bottom has been formed at 1.0257 already and the fall from 1.0624 has completed, then further rally could be seen to 1.0500-1.0600 area.

usdchf

Daily Forex Forecast

Forex Demo Accounts – Are Practice Accounts Really a Good Thing?

By Paul Bryan – Free FX demo accounts are a service that are loved by some yet hated by others, why is this so? Surely a free demo account can be nothing but a good thing?

Not exactly so, it does have its benefits but also has it’s pitfalls, in this article we will examine the pros and cons of such an account.

Let’s start off by looking at the demo account. For those who may not be aware, the free demo account does exactly what it says on the tin, it lets you demo FX trading for free, sounds great for a newbie trader and in many ways it is.

The brokers who offer a free FX demo account do so to help get people interested in FX, nothing wrong with that since they exist to expand the number of traders in the market and on their platform. It’s also a great way for the new trader to begin to learn FX trading.

Currency trading is no simple click and go experience, several brokers have introduced no frills platforms with low minimum deposits to get the virgin trader started and one or two have taken it a step further and allowed people to open a free demo account where you can begin trading with make-believe money until you have the confidence and knowledge to risk your own hard-earned cash.

That’s were the main pro of the demo account lies, in being able to learn the FX market and key functions of trade without risking a penny! However, this is not always good news.

When trading with ‘virtual’ money suddenly the risk becomes less, in fact risk is non-existent as you have an endless stream of make-believe money this means you may be more likely to risk on trades you know you shouldn’t and wouldn’t make in the real world. This can lull you in to a false sense of security.

Lets say you make en extravagant risk with demo money and it comes off, so you make another big risk and that comes off too, all of a sudden your confidence is up and you feel you can start playing with your own money and taking uncalculated risks.

The FX market has suddenly become very very appealing, if you can make this much money in the demo area imagine how well off you would be if you were using real money? This is where things go wrong, you then go ahead and open a real FX account and deposit your own cash.

Your confidence is up and you feel like you know what you are doing. You make a risky trade with your own cash and it fails, suddenly your FX career is over and you are sat looking at a significant loss, it seems when its your own ‘real’ money the demo you got with virtual cash counted for nothing.

Of course if you take things slowly and carefully you can avoid this and become a successful trader, but you have to have that self control. demo accounts are very useful, but only if you carry out trades exactly as you would if it was real money. Never make a trade in a demo account that you wouldn’t make with your own cash!

To help get around this several brokers now offer mini-accounts with deposits as low as $25. This is virtually a demo account anyway with such low deposits, however, its still your own cash so you are more likely to make realistic trades and not risk big time trades.

At Investawise we feel this is the best option, sure use a free demo account for a week or two while you learn the basics of FX trading, but then open an account and start with low funds, never jump both feet first into currency trading, success comes from patience, awareness, and discipline.

About the Author

Simply a 10 years old child could understand this FX trading system which is extremely accurate and highly profitable, Download Now. You can learn how forex hoster work in forex trading here.

Reversal Patterns in Stock Charts

By Sylvain Vervoort – Chart patterns are part of buying and selling rules in technical analysis trading. Chart patterns give an important confirmation for the next trend move. The art is to distinguish that you are dealing with a continuation pattern, after which the price will continue its previous trend or a reversal pattern leading to a trend reversal.

The head and shoulders formation belongs with an accuracy of about 90% to the most reliable reversal patterns. The price moves in an uptrend. Only after the pattern has formed, you will recognize the left shoulder after price falling back generally to the support of an up-going trend line. This will be a first point for the creation of the neck line. From here, the price makes a last move up, often with lower volume compared to the left shoulder. This will be the head of the pattern. Next the price drops through the up-going trend line and falls back to the level of the neck line, creating the second reference for the neck line. After that, the price will move up again to form the right shoulder. From here the price will drop below the neck line making lower lows. The shoulders and the neck line in the head and shoulders formation should be at about the same price level and at about the same distance in time from the head.

The head and shoulders pattern is confirmed when the price falls below an up-trending neck line or after the right shoulder in case of a down-trending neck line. In approximately half of the cases, there is a bounce back up to the neck line or even up to between the neck line and the right shoulder.

With the head and shoulders formation you can basically also calculate a price target. You measure the distance from the top of the head till the lowest point of the neck line and project this distance downwards. This will give you a theoretical price target.

Mirroring the head and shoulders top reversal pattern gives a head and shoulders bottom reversal pattern. Shoulder bottoms should be at around the same price level and at about the same distance from the head. The head and shoulders bottom reversal pattern with a descending neck line is confirmed breaking the resistance of this neck line, while an ascending neck line is confirmed when price turns up after the right shoulder.

A complex head and shoulders top reversal pattern will have more shoulders or more heads, but rarely both. The shoulder tops are around the same price level and at approximately the same distance from the head. The complex head and shoulders pattern is confirmed when the price falls below an up-trending neck line or after the internal right shoulder in the case of a down-trending neck line. Mirroring the complex head and shoulders top reversal pattern gives you a head and shoulders bottom reversal pattern.

Triple tops and bottoms are a variation of the head and shoulders theme. The difference is that tops or bottoms are at approximately the same level. Triple tops and bottoms offer a reliable pattern with an accuracy of about 80%. A triple top is confirmed when the price falls below the lowest valley in the pattern. A triple bottom formation is confirmed when the price rises above the highest top of the pattern.

A double top reversal pattern is formed with a large demand during the formation of the first top and a lack of demand with the second top. With daily price bars, tops are separated by about two up to eight weeks and should only have a small difference in price level. The in between reaction should have a price drop of about 10% on average. With an accuracy of 80%, this pattern is very reliable. The pattern is confirmed when the price falls below the level of the middle reaction.

For a double bottom, the reasoning is analogue to that of a double top. The trend is down, and a double bottom pattern is formed as an indication that the trend will probably reverse. With daily price bars, bottoms are separated by about two up to eight weeks and should only have a small difference in price level. The in between reaction should have an average price rise of about 10%. With 80% reversals, this pattern is very reliable. The pattern is confirmed when the price rises above the level of the middle reaction.

A rounding bottom pattern appears on daily and weekly bar charts. This pattern takes time to complete. The price can peak halfway through the pattern, but usually it retraces most of it quickly. Rounding bottoms are becoming rare because of today’s high volatility of the markets as a result of the information society. Rounding bottoms lead to a price reversal 90% of the time. The pattern confirms when the price closes above the highest peak of the pattern. There may be a saucer lip when the price drops temporarily before continuing the uptrend.

A V-formation bottom reversal creates a V-character; a top reversal creates an inverted V-character. The price at the start of the V-formation will form a one-day reversal, an island reversal, or a spark. A V-formation start can be recognized most of the time when it breaks the last possible steep trend line, together with a candle stick reversal pattern and a one-day island or spark reversal. A one-day top reversal arises if the price makes on the same day a new high, reverses and closes below the closing price of the previous day. A one-day top reversal in a candle chart is a black candle and often is part of a candlestick pattern. An island reversal occurs when a number of price bars are isolated by a window at the beginning and end of the island pattern. The island is confirmed if the second window is formed. The windows should be more or less at the same price level. The bottom V-formation spark reversal pattern arises if the price makes on the same day a very big positive move compared to the previous bars. In a candlestick chart this will be a big white candle at a bottom and a big black candle at a top. The big candle itself is the buying signal at a bottom and the selling confirmation at a top.

About the Author

Want to learn more and see some examples about stock chart reversal patterns? You can find a lot of material about basic technical analysis techniques for free at my website: http://stocata.org. Sylvain Vervoort is a trader and author with regular contributions in Stocks & Commodities magazine.
Forex For Beginners – 4 Vital Truths

By Mark Slater – Forex for beginners products are usually filled with crazy levels of hype about the huge profits you can make trading forex. It’s common to hear that a newcomer can go from scratch to millionare status by using nothing more than a cheap bit of software, which continues to trade even while you watch tv.

Needless to say these suggestions are simply marketing tactics.

Yes, you can make a lot of money from forex but if you are a forex beginner then you must be aware of the following essential trading facts.

1. There is no such thing as a free lunch, in life or in trading. As a beginner you will come across a lot of adverts for forex robots which promise amazing profits. Unfortunately, most of these systems are useless. If you want to make regular profits in the forex market then you need to study a trading system that will teach the basics and help you design your own trading approach.

2. The great news is that currency trading is not rocket science. In fact quite the opposite, the best traders will explain to you that their success is the result of the ability to ‘Keep It Simple’. Many newcomers to the forex markets think that the more complicated their trading system or the more fancy screens and flashing indicators they use then they will have a better chance of success. This is a common and costly error, profitable trading comes from the sensible combination of only a few simple factors: when to start a trade, when to exit and how much capital to risk. Anything more than that is just padding.

3. Managing your risk is key to your long term profitability as a trader. Unfortunately, this aspect of trading is overlooked by new traders who are generally more excited and seduced by the latest graphic indicator or automatic trading tool. However, managing the amount of capital you have at risk at any one time (money management) is a critical element of any successful trading approach. Particularly as a forex beginner you need to protect your trading funds as you improve your trading proficiency.

4. The emotional impact of trading is also instrumental in the long term success of any trader. Again, most leading professional forex traders will tell you that they spend more time improving their emotional armoury and money management than they do refining their trading system.

If you embrace these four trading home truths then there is no reason why you cannot achieve fantastic results from your currency trading. Ignore them however and you are very likely to join the bulk of forex traders who never devote the time to study their craft and fail to make any money.

About the Author

If you want to understand how to include these factors into a profitable forex for beginners trading method, then visit www.beginnersforex.org which includes a step by step trading plan explaining how you can profit from this exciting market.

Continuation Patterns in Stock Charts

By Sylvain Vervoort – Chart patterns are part of buying and selling rules in technical analysis trading. Chart patterns give an important confirmation for the next trend move. The art is to distinguish that you are dealing with a continuation pattern, after which the price will continue its previous trend or a reversal pattern leading to a trend reversal. Let’s have a closer look at continuation patterns.

After a continuation correction pattern, the price extends the previous trend. Continuation patterns are a very good indication for entering a trade after a trend reaction. Triangle and rectangle formations are continuation patterns. Triangle formations appear as symmetrical triangles, ascending triangles, and descending triangles. Short period continuation patterns are pennants and flags.

Symmetrical triangles in an uptrend are created with higher bottoms and lower tops. A breakout in the direction of the previous trend confirms the continuation pattern. The duration of a triangle continuation pattern on a daily chart should be minimum 20 days. Smaller values should be classified as pennants.

When lower tops are made in an uptrend and next price is dropping back to horizontal support levels, a descending triangle will be created. When equal tops are made in an uptrend and next price makes higher bottoms, an ascending triangle is created. A breakout in the direction of the previous trend confirms the continuation patterns.

When higher bottoms are appearing in a reaction to a falling price trend, but the tops that follow are lower, it will create a symmetrical triangle in a downtrend. Breaking out of this triangle formation on the lower side confirms the continuation pattern and continues the previous downtrend.

When equal tops are made in a downtrend and next price makes higher bottoms, an ascending triangle is created. When price makes lower highs and next finds support in a downtrend at equal bottoms, a descending triangle is created. A breakout in the direction of the previous trend confirms the continuation these patterns.

The rectangle is a relatively rare pattern, appearing almost always as a continuation pattern, although it can exist as a reversal pattern. The price moves between two horizontal trend lines and touches a minimum of two times each line. The pattern is confirmed on breaking one of the horizontals with a closing price.

With a continuation of the previous trend 90% of the time, flags and pennants are reliable short term continuation patterns. They create a pause from 5 up to 25 bars in the current trend and then continue the previous trend. Most of the flags and pennants take up from 10 to 15 bars. Generally, the volume goes down during that phase. Flags and pennants can be found in an uptrend and in a downtrend.

A rounding top pattern, with an inverse rounded bowl shape, appears mainly on daily and weekly bar charts. A rounding top starts with a steep rising trend line which with time becomes increasingly flat. Rounding tops as a reversing pattern break to the down side and lead to a farther move down 90% of the time. The pattern confirms when the price closes below the left-hand border or with a saucer lip when breaking the right-hand side of the border.

A continuation rounding top pattern breaks to the upper side of the saucer and gives, on average, less profit than a break to the lower side. This is simply because, as a continuation pattern, part of the up-move already has been completed. A rounding top as a continuation pattern is confirmed when the price moves above the highest point of the rounding top.

The diamond formation is a combination of two triangles. The left is an inverted broadening triangle; the right side is a symmetrical triangle. Together they make up a diamond formation. This pattern is most common as a continuation pattern, but as we have seen in the previous video about reversal patterns, it can be a top or bottom reversal pattern as well.

Wedge formations are not only interesting as reversal or continuation patterns but are also good for recognizing an Elliott beginning or ending wedge impulse wave. So they will help to make a correct Elliott wave count in generally difficult circumstances. The falling wedge exists as a reversing pattern in a falling trend and as a continuation pattern in a rising trend. The duration of the wedge should be a minimum of 20 bars; with fewer than 20 bars, it is considered a flag. Breaking out of a falling wedge is generally a bullish signal. Rarely will you see the price breaking a falling wedge to the lower side. A falling wedge continuation pattern in a rising trend is a price reaction in the up-going move. The chance for a big profit is less than for the falling wedge reversal pattern because part of the up-move is already history.

The rising wedge exists as a reversal pattern in a rising trend and as a continuation pattern in a falling trend. The duration of the wedge should be a minimum of 20 bars; with fewer than 20 bars, it is considered a pennant. Breaking out of a rising wedge is generally a bearish signal. It is rare for the price to break to the upper side of the rising wedge, although it can happen. A rising wedge continuation pattern in a falling trend is a price reaction for the down-move. The chance for a big profit is less for a rising wedge continuation pattern than for a rising wedge reversal pattern simply because part of the down-move is already history.

About the Author

Want to learn more and see some examples about stock chart continuation patterns? You can find learning material about basic technical analysis techniques for free at my website: http://stocata.org. Sylvain Vervoort is a trader and author with regular contributions in Stocks & Commodities magazine.

Top 5 Most Asked Questions By New Forex Traders

By Mohamed Rabea – Trading the forex market is very risky, the last thing you want to do is to jump in with your hard earned money without having enough knowledge about how the market really works and face the loss of your capital. Don’t get too excited about it and risk your money without spending some time studying the whole business, reading as much as you can about it and once you feel ready I advice you to start trading with a demo account for at least 3 months so you can test your trading skills with virtual funds before going live. Here are some of the most asked questions by new traders.

1) How much money would I need to make it in the Forex business?

Invest only what you can afford to lose. Most trading platforms offer mini accounts where you can start trading with minimum of $50 to $250. Trade only with leverage of 1:1 (only invested money) and never go beyond 10:1

2) What is the best forex trading strategy?

Each and every individual is different. So out of so many methods select your own, which is profitable and suits your mind set, trading hours and budget. Seek assistance from any senior trader or stock guru and then stick to it and keep on modifying it till you get the hang of it and succeed.

3) How does an automated forex trading system work?

Automated forex trading systems (robots) are just a tool. Like any other tool their success ultimately depends on the person using it. Simply put, a Forex robot is a program that attempts to take the guess work out of trading currencies. Currently there is a lot of information floating around the internet about these products. Like any other tool, it needs to be used properly in order to be most effective.

4) Are Forex Managed Trading accounts worth the risk?

Unless you are an extremely disciplined trader, have an appetite for reading everything you can about the economies of other countries, understand how the economy of one country affects that of another, can deal with large amounts of risks and enjoy watching the computer screen for hours, stay away from Forex trading your self.

Whatever you do, stay far away from those highly promoted “systems” that promise to make you rich quick because forex was never a get rich quick business it takes time and effort to build a profitable trading account.

5) Who is the best forex broker in the market?

The word “best” is a relative term, to which you do not allude, best spreads, best trading platform, best executions? A lot of beginners consider lowest spreads to be “best.” Your trading platform is most important, with a good data feed. Executions are more important than the spread, because they can eat up your penny or two spread difference on just a few trades if they’re sneaky. The rules they apply are more important than any spread difference.

So the point is that you should forget about trying to get rich overnight from forex trading because this is almost impossible. You should instead focus on growing your account month after month because this is a much easier and more realistic way of achieving your forex profit goals.

About the Author

M.Rabea – Forex Expert http://myfxdeals.com/forexpress/

Forex For Beginners – The Pro’s Don’t Use Forex Robots And Neither Should You

By Mark Slater – Most forex for beginners articles and forums concentrate mainly on automated forex trading robots guaranteeing that you can make huge sums of money without doing anything more than using a simple and cheap software program.

Just think about that for a moment – if these programs are so successful then why would the creators want to sell them, particularly for less than $100? The reality is that to make money trading forex you do need to do a little work and practice your skills. Typically, forex robots are designed to deal with a single type of market condition during which they might be profitable but as soon as the underlying market price action alters your profits can vanish.

The great news is that learning to trade the forex without using an automated system is not as difficult as many people expect! You can easily learn to trade the forex markets and make a big second income or even earn your living from trading once you have gained some experience.

This is because the rules of trading have barely altered since merchants and farmers began trading centuries ago. Financial are 100% driven by humans and as such they regularly repeat the same characteristics and if you have learnt how to recognise these then you can take advantage of the opportunities on offer.

In general, forex markets and other financial markets are either moving in a steady direction or exhibiting more random behaviour and this is why a properly trained forex trader can outperform automated forex systems – you can adapt to the prevailing market environment. If the market is moving in a clear trend then you need to adopt a certain trading style, if it is choppy and exhibiting more “noise” then you need to adapt your trading approach or avoid altogether.

Any professional forex for beginners training program will acknowledge this fact and teach you the tools you need to operate in different market conditions. Central to the system should be 5 core modules: how to spot the trend, a precise entry technique, a protective stops method, money management rules and an explanation of trading psycholgy. These last modules are often misunderstood or ignored completely but any professional forex trader will tell you that if you get these things right then you can make money even with only an average trading system.

Once you have studied a comprehensive beginners forex course you will need to find a broker and learn how to use charts. Thanks to the internet this is now a very simple task and learning to recognise chart patterns is also great fun and very rewarding. You will then open a practice or “demo” account and apply what you have learnt before going into the market with your own money.

Follow these simple guidelines and you will make money trading forex. Get a robot and you will endure endless frustration as you buy one after another that don’t live up to the adverts.

About the Author

Mark Slater has been trading the financial markets for over 20 years. If you want more forex for beginners tips and examples of what you should study in order to become a profitable forex trader then check out the resources and comprehensive beginners toolkit at www.beginnersforex.org

USDJPY may be forming a cycle bottom at 84.72

USDJPY may be forming a cycle bottom at 84.72 level on daily chart. Key resistance is at the falling trend line, a clear break above the trend line resistance could confirm the cycle bottom, then the following upward movement could bring price to 87.00-88.00 area. Support is at 84.72, only break below this level could trigger another fall to 82.00 zone.

For long term analysis, USDJPY has formed a cycle top at 94.98 level on weekly chart. Drop to 80.00 is still possible after consolidation.

usdjpy

Weekly Forex Analysis

Fx Update: US Dollar rises today in forex trading, Euro falls to 5-week low

By CountingPips.com

The US dollar today has been trading mostly higher against its major currency rivals in the forex trading markets. The dollar has reached its highest trading level against the euro in over a month while also advancing against the British pound sterling, Swiss franc, Canadian dollar and Japanese yen. The American currency is trading close to unchanged versus the Australian and New Zealand dollars at time of writing.

Meanwhile, the American stock markets have been lower on the day with the Dow Jones industrial average decreasing by over 50 points to trade near the 10,199.99 level. The NASDAQ has edged lower by roughly 1 point while the S&P 500 has fallen by over 4 points to the 1070.60 level. Oil has declined by approximately $0.98 today to land at the $73.45 per barrel threshold while gold has declined by $5.70 to level at $1228.10 per ounce.

Canadian consumer prices rise

There was little in economic news released today with the highlights being consumer price data out of Canada. Canada’s consumer price index rose by 0.5% in July following a 0.1% decline in June, according to the report by Statistics Canada. The data just missed market forecasts that were expecting a 0.6% increase.

On an annual basis, the consumer price index is 1.8% higher than the July 2009 level following a 1.0% annual increase in June. Pushing the consumer price index higher was a 7.9% annual increase in energy prices.

Core consumer prices, excluding energy prices and other volatile items, rose by 1.6% on an annual basis over the July 2009 level while falling by 0.1% on a monthly basis in July from June. Core prices failed to surpass market forecasts that were looking for increases by 0.1% on a monthly basis and by 1.8% on an annual basis.

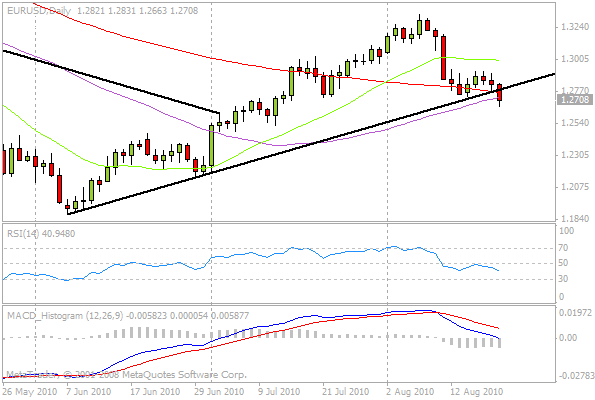
EUR/USD Daily Forex Chart – The euro falling against the dollar in forex trading today and touching its lowest level in five weeks. The EUR/USD registered a low today of 1.2663 and has pierced the rising trendline that began on June 7th as the pair trades at close to its 50-day moving average. The euro is on its way to losing ground against the dollar for a second straight week after gaining for the previous six consecutive weeks.

What Lessons Can Be Learned From The Global Financial Crisis?

By Jonathan Dayan – It’s no secret that the global financial crisis has had an enormous impact on the way people invest. The shroud of mystery which once hung over the financial markets appears to have lifted for good. In the aftermath of the crisis, millions more people have been investigating alternative investment opportunities like online financial trading.  In general, these people are united in seeking investing opportunities that enable them to exercise more control over their investments than traditional investing opportunities allow. What lessons does the financial crisis offer to today’s financial investors and why has it led to increased interest in online financial trading?

The collapse of major global financial institutions like Bear Sterns, Lehman Brothers and Northern Rock sent shockwaves through the world’s financial system and nearly caused its collapse. One consequence of this was that investor’s faith in financial experts was badly shaken. People realized that if there was the potential for real risk even in so-called “safe institutions” like banks, then handing over their money to experts to invest on their behalf wasn’t really that different to investing their money themselves – and could even hold more risks and disadvantages. In the wake of this rupture in financial systems, ordinary financial investors have been reassessing their financial investing options.

The Rise Of Self-Controlled Investing

One of the lessons people have been drawing from the financial crisis is the risks that are incurred in handing over their funds to third parties to invest on their behalf.  The images of thousands of investors queuing at the doors of major banks which illuminated TV screens around the world just two years ago are still seared on the minds of many investors. As a result there has been an increased interest in online financial investing from many people because it offers a way for investors to keep their investment funds under their own control. In online financial investing every investor makes their own decisions on what assets to trade, when to trade them and when to exit the markets. Investments are not locked away over time but are at the direct control of the investor 24 hours a day. This offers investors the freedom to invest in the way that suits them best, rather than forcing them to accede to a predefined investment structure as most banks and investment funds force their customers to do.

Open Investing

Behind the global financial crisis there lies the specter of secrecy. The shock collapse of major global financial institutions and the scandalous fall of financial investor Bernard Madoff serve to highlight the vulnerability of traditional approaches to savings and investments – namely that they involve handing over your finances to a third party the security and competency  of which you can never be wholly clear about. Prior to the global financial crisis the financial industry was characterized by a lack of transparency. Traditional financial investment firms were opposed to openness in their investment procedures, a strategy which in the event cost their investors dearly. Following the global financial crisis ordinary financial investors are far more suspicious of secretive institutions and rightly so. Put simply, if you can’t see where your money is going can you trust that it is truly secure? As global taxpayers and investors learnt to their cost through the crisis, the answer is that you can’t. Online financial trading offers a different way for you to invest, where you can see exactly how your investments are faring at all times, and you can know exactly where your money is being invested.

The Obsession With Volatility

Perhaps the most salutary lesson from the global financial crisis was the stark reminder that financial markets can fall as well as rise. For many years prior to the crisis investors had become acclimatized to rising markets and had begun to share the view that the rises would continue forever. The investment strategies of millions of investors were built upon this expectation. In the financial crisis, however, the world was delivered a wakeup call major financial markets and institutions sustained massive losses. As a result, ordinary investors began to rediscover the risk element that is involved in long term asset holding. Investors who were engaged in short term financial trading were in some ways less exposed to the risks that resulted: because they were familiar with the concept of investing for the short term they were able to ride the wave of volatility that gripped the markets – seeking rewards in both rising and falling markets. Online financial trading makes this possible for millions of ordinary traders because it enables them to place both long and short positions to achieve financial returns regardless of whether the markets rise or fall.

The Importance Of Community

The financial crisis highlighted the critical importance of information sharing in successful financial trading. Those investors who were in the know succeeded as financial investors, those who were not missed out. The global financial crisis seems to demonstrate that investors who are able to share hints and tips with one another are in a better position to achieve investment success than those who are forced to rely solely on their own talents. Today there is increasing global interest in financial investing communities which enable traders to co-operate across national boundaries and time zones in order to share their knowledge and strategies for the benefit of all. This is one of the key appeals of online financial trading in the post-crisis era and is the reason why financial trading communities like the eToro OpenBook, the world’s largest social trading community, are proving to be a huge draw for both new and experienced financial investors.

The global financial crisis has changed the way in which ordinary people invest forever but it has actually had a positive effect on the online financial trading industry. As people have come to see the advantages of making investment decisions for themselves and of free and open investment methods which let them invest how and when they want to, they have been driven in ever increasing numbers to online financial trading. In today’s financial reality where financial markets are moving around wildly, and long term prospects are unclear, investors want to be in a position where they can get the benefit of such turbulence: rather than risk losing everything on that basis. Online financial trading, particularly community based trading opportunities like the eToro OpenBook, seemingly offers investors just that.

Forex Article provided by eToro

Disclaimer: Trading in the Foreign Exchange market might carry potential rewards, but also potential risks. You must be aware of the risks and are willing to accept them in order to trade in the foreign exchange market. Don’t trade with money you can’t afford to lose.