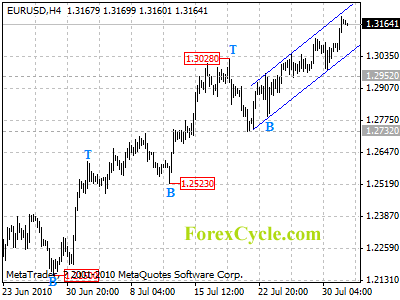
EURUSD runs in a price channel on 4-hour chart. Support is now at the lower border of the channel, now at 1.3045, as long as the channel support holds, uptrend from 1.2732 is expected to continue and next target would be at 1.3350 area. Only a clear break below the channel support could indicate that a cycle top is being formed, and the uptrend from 1.2732 is complete, then pullback to 1.3000 area could be seen.
GOLD, a store of wealth
King Midas and the Golden Touch
King Midas wished everything he touched would turn to gold but after Dionysus granted him his wish, Midas soon saw the foolishness of his wish and asked Dionysus to release him the curse. To do so, Dionysus had Midas wash in the Pactolus River (in modern day Turkey). This is the mythological source of the real gold present in the river
Gold has been the subject of many myths and legends throughout history and it is clear that it has always been considered very valuable. Historically gold was often used as a currency and when paper money was introduced it was regarded as a receipt convertible to fixed quantities of gold. In the monetary system known as the Gold Standard, the value of gold was used as a standard for many currencies. In 1934 a troy ounce of gold was valued at $35 US. At this rate, foreign governments and central banks were able to exchange dollars for gold. Bretton Woods established this system of payments based on the dollar, in which all currencies were to be defined in relation to the dollar, itself convertible into gold. The U.S. currency was now effectively the world currency, the standard to which every other currency was pegged. The gold standard was abandoned in the 1970s and gold was left to find its own free market level. Nowadays banks still hold gold reserves as a store of value but currencies no longer need to be backed by gold.
Gold is no longer used as currency and is now classified as a commodity. A commodity is generally defined as a good which is the same regardless of who produces it . Thus oil, gold, wheat are commodities whereas stereos are not. However. gold is not being priced as a commodity, people will pay a lot more for Gold than its commodity value.
WHY BUY GOLD?
Since 2001 Gold has tripled in value versus the USD. but gold is not defined as a currency. It is not classified as an energy resource, or a foodstuff. It does look good as jewelry and in assorted ornaments and generally everyone agrees that it is valuable. Yet with traders so willingly investing such huge amounts of money in Gold, what are they buying exactly?
Gold is not consumed like petrol or foodstuff. It is not “useful” like aluminum and copper. It is estimated that in the history of mankind about 161,000 tonnes of gold have been mined just enough to fill 2 olympic- sized swimming pools. For the past 30 years the rate of growth of gold extractions from mines has matched the rate of the world’s population (roughly 2000 tonnes/year). Gold quantities remain constant because gold is not truly “consumed” . It simply gets recycled again and again because it has always been too valuable.
What are the investors buying exactly?
Like any other commodity the price of gold is determined in large part by supply and demand. However the demand for Gold is not the same as the demand for oil and copper. The increase in the demand for Gold invariably indicates that the more conventional types of investments are not producing the kind of returns needed to protect the wealth of investors. Investors do expect a certain after tax return on their investments, and if it cannot be obtained in one type of investment they will seek it in another. The idea being always that once inflation and taxes are factored into the equation, an investor must see a positive return on his investment otherwise he would see his assets and purchasing power steadily diminishing in value and that is,of course, untenable in the long run.
Gold as a “store of wealth”
While it is true that inflation, the stock market and foreign exchange rates affect the price of Gold, this is true in a certain given investment context. One has to refrain from being too literal in this interpretation. Hence just because the cost of automobiles has quadrupled in the past 30 years it does not mean that the price of gold must also quadruple to offer a hedge against inflation.
The demand for gold is a demand for a hedging instrument against inflation and the collapse in value of other types of investments. Gold fulfills this unique function by allowing investors to invest in an instrument that protects their wealth and purchasing power. The increase in the price of Gold is not haphazard. It is not simply a case of gold “fever” or speculation that drives up the price of gold. Gold plays a unique role in protecting the investors’ capital against devaluation and as such its price will increase in the amount needed to preserve an investor’s purchasing power
CONTROLLED EUPHORIA
The price of gold can increase and increase a lot, however it is always in a controlled fashion. if that were not the case then gold would not play the role it plays in the preservation of investors’ purchasing power. Because gold is a hedge against inflation and the loss in value of other assets, the price of gold must move in a direction opposite that of other assets. Because gold is there to preserve the value of investors capital when other investments classes are losing value, its price has to vary inversely to that of the main types of financial assets.
The required yield theory states that the after tax return earnings on investments must be viewed as minimum return equal to the GBP/capita long term growth rate plus expected inflation rate.The 1.5% constant turns out to be the long-run average real GDP/capita growth rate in major developed economies. In the US the historical long-term average GDP/capita growth has been 2.03% from 1929-2006. (see http://papers.ssrn.com/sol3/papers.cfm?abstract_id=520382)
Now a decrease in the stock market alone is not sufficient to drive investors to invest in gold. However a decrease in stock market earnings combined with high inflation and taxes would certainly incite investors’ to consider investing into gold. The increase in the price of gold is imminent only if the combination of high inflation and taxes and a decrease in earnings from the other main investment types are present. Gold increases in price only to the extent that its function is to preserve the wealth and purchasing power of investors, and anything else would defeat its purpose. The exception to this rule occurs in the case of war and when some countries default on their payments, However the effect there is merely temporary.
About the Author
Article courtesy of The Parrotster Forex & Currency Trading
USD/JPY Technical Analysis
By Russell Glaser – The USD/JPY illustrates a pair that is trading in a trending environment and is testing new lows following a breakout move last week.
As shown on the daily chart below, the USD/JPY is trading in a perfect order. Prices are not only trading below the major simple moving averages (SMA), but the SMAs are currently aligned in an order by their respective timeframe from longest to shortest. The 200-day simple SMA is on top, followed by the 100 SMA, 50 SMA, 20 SMA, and 10 SMA in that order. As such, this identifies a strong trending environment.
Forex Market Analysis provided by Forex Yard.
© 2006 by FxYard Ltd
Disclaimer: Trading Foreign Exchange carries a high level of risk and may not be suitable for all investors. There is a possibility that you could sustain a loss of all of your investment and therefore you should not invest money that you cannot afford to lose. You should be aware of all the risks associated with Foreign Exchange trading.
Daily Elliott Wave Forex Forecast-2-August-2010
Title: | EUR/USD – Sideways Trend |
Story: | Trend is sideways in EUR/USD currency pair. So far we have seen well stretched rally. We could get more upside in EUR/USD currency pair. Cluster of resistance levels starting from 1.3123 to 1.3171 which provides good area to short the rallies in EUR/USD currency pair. A break below 1.2949 support will start the down trend in EUR/USD currency pair. |
Read Full Elliott Wave Forecast – Click Here…. |
Forex Market Review: Daily Forex Analysis 2010-08-02
Forex Market Review by Finexo.com
On Friday, the U.S Dollar tumbled against the majority of its currency counterparts as a government report showed that U.S. economic growth slowed in the second quarter. According the Department of Commerce, the U.S. economy grew 2.4% in the second quarter after a revised 3.7% increase in the first three months of the year. Unfortunately for the U.S, this disappointing report was just one of many in a long string of weaker-than-expected figures for July. The news pushed the U.S. dollar to drop to an 8-month low against the Yen and a 6-month low against the Swiss Franc.
Up ahead this week, trading is expected to be dominated by interest rate announcements from the central banks of Europe, Britain and Australia. Moreover, all eyes will be on Friday’s Non-Farm Payroll. Investors continue sell the Dollar, as the string of the souring US economic reports have made market participants distrustful of the greenback’s “safe haven” status.
EUR/USD
The Euro rallied against the dollar, in its first monthly advance since November, as concerns began to ease that the single currency region’s debt crisis will worsen and spread to the global economy. The Euro rose 6.7% to $1.3052 on Friday, from $1.2238 on June 30. Moreover, the 16-nation currency has rallied over 10% from its four-year low of $1.1877 on June 7. According to analysts, the Euro’s recent turnaround is due to the surprisingly strong European data and the recent weak U.S figures.
Up ahead, this week there are several key European announcements, including that the minimum bid rate, published on Thursday. While, the ECB is expected to continue to hold the key rate at 1.0%, forex traders are advised to listen to ECB president Trichet’s speech. At last month’s meeting, Trichet’s credibility received a boost when he laid out the positive news occurring in the EU economy and how the central bank is working to prevent further financial problems. However, this time around expectations are higher and if the ECB and Trichet sound too conservative, the Euro’s recent rally could come to a screeching halt.
USD/CAD
The Canadian Dollar appreciated against its U.S. counterpart in July, its first monthly gain since April, as rises in equities and commodities boosted the appeal of currencies tied to growth. The Canadian currency was up against the U.S Dollar, after a report showed that despite slowing economic growth in both nations, the Bank of Canada will continue to raise the its key overnight lending rate. On Friday, Stats Canada reported that the nation’s growth edged up in May by 0.1%, in line with market expectations, after unexpectedly stalling in April.
Forex Market Review & Analysis by Finexo.com
Disclaimer: Trading the foreign exchange (Forex) carries a high level of risk, and may not be suitable for all investors.
Forex News: USD at 3-Month Low
By ForexYard – The US dollar has been pushed bearish by concerns over the US economy following a series of recent economic data, undershot market expectations. Meanwhile, European numbers and many company results have been stronger — keeping investors buying riskier assets.
The dollar-index hit a 3-month low today, hurt by concerns that the American economy’s recovery is losing momentum, while the high-yielding Australian dollar (AUD) reached a 3-month high, lifted by a rise in Asian equities this morning.
The perceived better-risk-sentiment outside of the United States was unlikely to be maintained if the world’s biggest economy continues to underperform. If today’s release of American ISM Manufacturing PMI and Prices comes in below expectations, we should expect a continuation of this counter-dollar trading behavior, pushing the EUR/USD upwards in the direction of 1.3110.
Forex Market Analysis provided by Forex Yard.
© 2006 by FxYard Ltd
Disclaimer: Trading Foreign Exchange carries a high level of risk and may not be suitable for all investors. There is a possibility that you could sustain a loss of all of your investment and therefore you should not invest money that you cannot afford to lose. You should be aware of all the risks associated with Foreign Exchange trading.
Riskier Currencies on Top Following Market Opening
Source: ForexYard
Riskier currencies like the EUR and U.K. pound made significant gains against both the Yen and U.S. Dollar in overnight trading, as the markets prepare for a heavy trading week. Traders will want to pay attention to a number of news events today, and should keep in mind that the all-important U.S. Non-Farm Employment Change is set to be released on Friday.
Economic News
USD – Dollar Remains Low vs. European Currencies
While the USD has halted its most recent slide against the Yen, it is still tumbling against both the British Pound and EUR. Since the market opened for the week, EUR/USD has gone up some 30 pips, and is currently trading around the 1.3080 level. Analysts attribute the Dollar’s losses to a continuous stream of negative U.S. news events. That trend seems likely to persist, as we take a look at some of the economic indicators likely to impact Dollar pairs today.
The U.S. ISM Manufacturing PMI, set to be released at 14:00 GMT today, is forecasted to show a drop in the expansion of the manufacturing industry from last month. While the PMI is still expected to show industry growth, a drop from last month will likely negatively impact investor confidence in the U.S. economic recovery. Should the report come in at its predicted figure of 54.2, the Dollar may see further losses.
Shortly after the PMI figure is set to be released, Fed Chairman Bernanke is scheduled to give a speech regarding the challenges facing the U.S. economy. While no major announcements are forecasted, even the slightest indication about where the economy is heading could create heavy volatility for Dollar pairs. Traders will want to pay close attention to the speech. Should the Fed Chairman give a positive economic assessment, the Dollar may be able to recoup some its most recent losses.
EUR – Euro Looks to Prolong Gains against the Dollar
As markets opened for the week, the EUR shot up against the safe haven Dollar and Yen, while taking steep losses against the Aussie. EUR/USD and EUR/JPY are up 30 and 40 pips respectively since markets opened. EUR/AUD on the other hand, is down about 50 pips in the same amount of time.
Analysts are quick to point out that the EUR gains have more to do with the troubles in the U.S. economy, and less to do with any positive European economic indicators. What this means for traders, is that any gains the EUR has made on the Dollar or Yen are tentative at best. With a busy trading week just getting started, any economic indicator that could come in above or below expectations could cause volatility for the EUR.
Today, EUR traders will want to pay attention to the manufacturing PMI’s from both the U.K. and U.S. Both PMI’s are forecasted to show expansion in their respective manufacturing industries. If the reports come in as predicted, the EUR may be able to extend its recent gains as investor confidence is likely to be boosted. At the same time, an unexpected drop in either PMI figure could lead to a wave of risk aversion, and may boost the Dollar.
JPY – Yen Erases Most of Last Week’s Gains
Starting off the week, the Yen gave up most of its recent gains as riskier currencies have begun to assert themselves in the marketplace. The U.K. Pound has moved up close to 50 pips against the Yen since markets opened, while AUD/JPY had gone up over 60 pips before staging a slight correction. USD/JPY has been trading at a relatively steady rate since late last week, and will likely continue to do so as long as risk taking dominates the market place.
Today, Yen traders will want to pay attention to both the U.S. ISM Manufacturing PMI, as well as Fed Chairman Bernanke’s speech. While neither of these indicators directly affects the Japanese economy, their results will heavily influence the status of safe haven currencies like the Yen.
Crude Oil – Oil Prices Continue to Move Up
The weak Dollar has prompted more investment in Crude Oil, leading to steadily increasing prices for the commodity over the last few days. Currently, crude is trading around the 79.20 level, up from around 77.10 on Friday. As the Dollar continues to fall against many of its main currency rivals, traders can expect oil prices to rise.
Today, Crude prices will largely be determined by the Fed Chairman’s speech, scheduled to be given at 14:15 GMT. Should the speech paint an optimistic picture of the U.S. economy, oil prices may drop if investors decide turn back towards the Dollar. On the other hand, if the Fed chairman decides to highlight the continued challenges facing the U.S. economic recovery, oil will likely increase its gains in the marketplace.
Technical News
EUR/USD
Friday’s trading left the pair in a doji candlestick pattern highlighting traders’ inability to push the pair higher. However, the bears were also contained by a short term trend line that began on July 1st. A rising wedge pattern has formed on the hourly chart. Traders may want to target the upper line of the wedge near the price of 1.3120.
GBP/USD
The currency continues to move higher and is showing signs of a pair that is trending higher. The ADX (14) reads 45, indicating a pair that is in a trending phase. Also the 20-day moving average line is sloping up, indicating that the trend is higher. Traders should be long on the pair with a first target the 1.5820 resistance level on the daily chart.
USD/JPY
The pair is also trading in a strong trending environment, supported by a perfect order. The currency is trading below the 200-day simple moving average (SMA), followed by the 100 SMA, 50 SMA, 20 SMA, and 10 SMA in that order. As such, traders should be shorting the pair. Since a breakout of the bearish flag pattern, the pair breached below the support level of 86.25 and fell to a low of 85.93, but traders were unable to make a close below the support level. The next support for the pair comes in at the November 2009 low at 84.90. This should serve as the next target for traders
USD/CHF
While the pair has been range trading for quite some time now, some upward movement may be expected today. A bullish cross is evident on the hourly chart’s Slow Stochastic while the RSI for the pair is floating in the oversold territory on the 4 hour and 8 hour charts. Furthermore the MACD for the pair is the lower range on the 2 and 4 hour charts. Going long with tight stops may be advised for the day.
The Wild Card
AUD/NZD
After a steep rise over the past few days, the pair may be seeing some downward correction during today’s trading. The RSI for the pair is floating in the overbought territory on the 4 hour, 8 hour and daily charts while a bearish cross is evident on the daily chart’s Slow Stochastic. Furthermore, a breach of the upper Bollinger Band is evident on the daily chart, indicating an imminent downward movement. Forex traders may be advised to go short for the day.
Forex Market Analysis provided by Forex Yard.
© 2006 by FxYard Ltd
Disclaimer: Trading Foreign Exchange carries a high level of risk and may not be suitable for all investors. There is a possibility that you could sustain a loss of all of your investment and therefore you should not invest money that you cannot afford to lose. You should be aware of all the risks associated with Foreign Exchange trading.
Forex Daily Market Review Aug 2, 2010
By eToro – The week capped of a powerful performance for equity markets. Strong earnings drove the S&P 500 Index up approximately 6.7% for July, while the NASDAQ index increased more than 7%. For the week, the S&P 500 declined by approximately 1 point, as investors digested a plethora of economic data points.
Click here for the full review
Forex Market Analysis provided by eToro
Disclaimer: Trading in the Foreign Exchange market might carry potential rewards, but also potential risks. You must be aware of the risks and are willing to accept them in order to trade in the foreign exchange market. Don’t trade with money you can’t afford to lose.
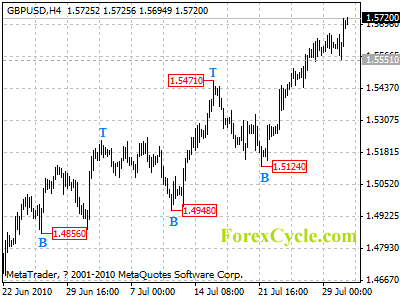
GBPUSD continues its upward movement from 1.5124
GBPUSD continues its upward movement from 1.5124 and the rise extends to as high as 1.5726 level. Key support is at 1.5551, as long as this level holds, further rise to 1.5800-1.5900 to reach next cycle top on 4-hour chart is still possible. On the other side, a breakdown below 1.5551 support will indicate that a cycle top has been formed, then pullback to 1.5400-1.5500 area could be seen.
Technical Analysis Basic Charting Techniques
By Sylvain Vervoort – Technical analysis starts with the graphical representation of stock prices in a chart. Although there are many chart types, the ones used most often are the line chart, the bar chart and the candle chart which is the preferred one because it provides the most information.
A line chart is not used that much anymore. It was the basic chart used prior to the advent of the personal computer. Stock price data was registered manually, and only closing prices were registered. The line chart was created connecting the closing prices.
For a bar chart, the highest and the lowest prices in a given period (minutes, hours, days, weeks, or months) are connected with a vertical bar. The opening price is represented by a tick mark at the left side; the closing price is represented by the tick mark at the right side. The bottom and the top of the vertical bar represent the lowest and highest prices of the period, respectively. The bar chart is used mostly in Western technical analysis.
The candle chart has its roots in the Far East. Steve Nison introduced the candle chart to the Western world in his book, Japanese Candlestick Charting Techniques (Nison, 1991).
Candle charts clearly depict price development in a trading period. The body of the candle represents the move between the opening and closing price. If the price closes above the opening price, the candle body is blank (white). If the stock price closes below the opening price, the candle body is filled (black). A candle can be either a body or a body with long or short wicks, called shadows that reach to the highest and lowest prices in the trading period. The recognition of candle-chart patterns is a study unto itself.
Looking at price moves of 100% and more it may be a good idea to use a logarithmic scaling on the vertical price axis of the chart. If you are using a division of five points on a linear scale, a price change from $20 to $40 comprises four divisions, whereas a price change from $40 to $80 comprises eight divisions. This means that the distance on the vertical axis from $40 to $80 is twice as large as the one from $20 to $40. On the other hand, a price change from $20 to $40 or from $40 to $80 equals the same 100% price increase. A price moving from $5 to $10 or from $100 to $105 is the same distance on a linear scale. Clearly, this does not provide a good visual impression of what the price movement really represents.
Moving from $5 to $10 equals a 100% price increase, but moving from $100 to $105 equals only a 5% increase. To have the same distance on the vertical scale representing equal percent changes, you can use logarithmic scaling. This means that the distance on the vertical axis from $40 to $80 is now the same as the one from $20 to $40, namely a 100% price increase. This gives a much better visual impression on charts with large price moves.
When there are large price moves, applying a linear scale can be a disadvantage. It may simply not be possible to draw a linear trend line under an up or down-moving trend. However using a logarithmic trend line probably will give you the support levels you need to see. Nevertheless, most people will use linear scaling on daily price charts, which is fine as long as the price moves within limits. More often, logarithmic scaling is applied to longer-term charts, such as weekly or monthly charts, mainly because the price moves are much more significant. The right solution is to use logarithmic price charts with logarithmic trend lines all the time.
About the Author
Interested in technical analysis? You can find a lot of learning material about basic technical analysis techniques for free at my website: http://stocata.org under the Technical Analysis Menu item. Sylvain Vervoort is a regular contributer of technical analysis articles in Stocks & Commodities magazine.