20 Questions with Robert Prechter: Devaluation Won’t Work

By Elliott Wave International

The following article is an excerpt from Elliott Wave International’s free report, 20 Questions With Deflationist Robert Prechter. It has been adapted from Prechter’s June 19 appearance on Jim Puplava’s Financial Sense Newshour.

Jim Puplava: In 1933 at the bottom of the crisis, the Roosevelt administration comes in. In its first week they declare a bank holiday, they reopen the banks with the FDIC, they sever gold, they come in with massive fiscal stimulus and they devalue the dollar substantially. The result was from 1933 to1937 we have positive CPI, economic growth, a robust stock market. If fiscal and monetary measures fail to revive the economy and the market, could the government try devaluation to change the deflationary outcome the way they did 1933?

RP: Well, you have to have a benchmark in order to devalue a currency. Our currency isn’t pegged to anything, so I don’t understand even what the term devaluation would mean. What would they do to do create a devaluation?

Editor’s Note: The article you are reading is just one small excerpt from Elliott Wave International’s FREE report, 20 Questions With Deflationist Robert Prechter. The full 20-page report includes even more of Prechter’s insightful analysis on fiat currency, gold, the Fed, the Great Depression, financial bubbles, and government intervention. You’ll learn how to protect your money — and even profit — in today’s environment. Read ALL of Prechter’s candid answers for FREE now. Access the free 20-page report here.

JP: Maybe they come out with a formal saying: the dollar is now worth a half a euro, X amount of yen or it’s a formal statement. They just declare it formally.

RP: Yeah, but everybody already knows what it’s worth, because it’s floating freely against these other currencies. And they certainly couldn’t fix it to a lesser currency like the euro. And then the managers of this other currency would simply make another decree and negate it. That’s not going to work.

Let’s take your example, because it’s very important. The whole idea of the government being ahead of the curve is bogus. You know the collapse was from September 1929 down to July 1932, right? The government did not act until it was over. They waited for the bottom of the collapse—of course—and then they finally decided they’re going to do something about it. So, months after the low in 1932, they finally shut the banks and pass laws such as Glass-Steagall, which created the FDIC, and the Securities and Exchange Act, and that sort of thing, to bring confidence back into the banking system. I think the same thing is going to happen here. They’re going to try the same old stuff, more and more lending, more and more borrowing—which is the problem, not the solution—until everything collapses, and then they’ll go, “Oh maybe we should try something else,” and by that time we’ll already be at the deflationary nadir, and it’ll be time to look for an inflationary outcome.

My whole thesis is exactly along those lines. We want to stay prepared for a deflationary crash, and when it’s over, we’re going to convert whatever money we have to stocks, and raw land, and gold, and whatever else we want to buy. That’s when—if the government makes a political decision to inflate through currency printing—it would make the decision. They’re not going to make it before the bottom. The government has never acted before the bottom, never acted in a new way. Right now these bailouts and other schemes are simply pressing the accelerator harder on what we’ve been doing since 1913.

Editor’s Note: The article you are reading is just one small excerpt from Elliott Wave International’s FREE report, 20 Questions With Deflationist Robert Prechter. The full 20-page report includes even more of Prechter’s insightful analysis on fiat currency, gold, the Fed, the Great Depression, financial bubbles, and government intervention. You’ll learn how to protect your money — and even profit — in today’s environment. Read ALL of Prechter’s candid answers for FREE now. Access the free 20-page report here.

This article, 20 Questions with Robert Prechter: Devaluation Won’t Work,was syndicated by Elliott Wave International. EWI is the world’s largest market forecasting firm. Its staff of full-time analysts lead by Chartered Market Technician Robert Prechter provides 24-hour-a-day market analysis to institutional and private investors around the world.

S&P500 Trading: The “Death Cross” – What it is and how to trade it

By Adam Hewison – In today’s short video, we look at two important aspects of the market – one
is an intraday technique which I will show you how to use to determine where
markets will turn, and the other is the infamous “death cross”.

The death cross does not occur that often, in fact, in the last 2 1/2 years
we’ve only seen this happen three times. The most recent occurred just last
week and is something that every investor and trader should pay close attention
to. I believe that this video will help you understand what the death cross is
and how you can construct it and use it in your own trading. A lot of traders
and investors watch this very closely so you should too.

As always our videos are free to watch and there’s no need for registration.

If you like the video please feel free to comment on our blog and give us your
thoughts on the market.

Watch the S&P500 DeathCross Video Now….

All the best,
Adam Hewison
President of INO.com

A Chance to Ride the Global Gold Rush! – July 7, 2010

gold july 7, au, commodities trading, com-dolls, mining, stock trading, forex, forex trading

Good day finance fans! Here’s an update on the price action of gold which I last posted on June 28 (kindly see my previous entry here). As you can see, the price of gold has weakened after it marked a new all-time high at $1,265.05 per ounce on June 21. Gold has a possibility to dip a little more since it has already broken its shorter term uptrend line. Despite doing so, its long term uptrend remains to be intact and as long as it is, the price of gold would likely trek higher over the longer time frame. With the stochastics in the oversold area, traders could indeed buy it back up any time soon. The presence of a bullish divergence, where the price registers higher highs and the stochastics mark lower lows, also suggest a likely bullish continuation in the coming days. In my opinion, a good long entry point here would be at the intersection of the 50% Fibonacci retracement level that I drew and the long term uptrend line. A break, however, of the long term uptrend line would be a sign of some sour things to come.

Remember that investors generally buy gold during times of economic down swings since unlike most other assets, gold does not lose its intrinsic value. With most of the biggest economies in the world already turning bearish as indicated by the breaks downs in their equity indices (S&P 500, Dow, Nasdaq, FTSE, SSEC), investors and traders alike would surely pull out their funds away from these market and into somewhere where the value of their money could be at least maintained or better. Since gold has been on a bull run as exhibited by its uptrend for almost two years now, investors would likely place their money in it. And given the influx of new funds that that came out of equities, the demand for assets such as gold would likely increase, which of course, would jack up its prices.

If the breakdowns in the mentioned indices worsen and if the Stoxx 500 follows suit, gold will likely be more in demand. Now, if I wish to ride the gold’s uptrend, I could either invest in gold itself or in the commodity currencies such as AUD, NZD, and CHF. I could likewise invest in the listed gold mining companies.

More on LaidTrades.com

EUR/AUD Provides Bearish Signals

By Anton Eljwizat – Last week’s bullish movement of the EUR/AUD cross hasn’t received much support as of late. Below, I will demonstrate that the EUR/AUD pair has already commenced a downward trend for today, and the cross may tumble another 40-110 pips in the coming days. Traders are strongly advised to take advantage of the trend at an early stage. Therefore, why not open short positions at an excellent price?

• The technical indicators that are used are the Williams Percent Ranges, Relative Strength Index (RSI), and Stochastic Slow.

• Point 1: The Slow Stochastic indicates a bearish cross, signaling that the next move may be in a downward direction.

• Point 2: The Relative Strength Index (RSI) indicates that the price of this cross currently floats in the overbought territory, signaling downward pressure.

• Point 3: The Williams Percent Ranges signals further bearishness for the pair, which in turn indicates further downward pressure to occur anytime soon.

EUR/AUD Daily Chart

Forex Market Analysis provided by Forex Yard.

© 2006 by FxYard Ltd

Disclaimer: Trading Foreign Exchange carries a high level of risk and may not be suitable for all investors. There is a possibility that you could sustain a loss of all of your investment and therefore you should not invest money that you cannot afford to lose. You should be aware of all the risks associated with Foreign Exchange trading.

Spot Crude Oil Breakout Trade

By Russell Glaser – The range trading that has trapped the price of spot crude oil appears to be over as the commodity is breaking out of the consolidation pattern.

The 15-minute chart for spot crude oil shows the commodity has been consolidating between the prices of 72.35 and 71.50 for the past 21 hours. Recently the pair broke out of the range, only to retrace back to the upper line of the range.

This presents traders with a good opportunity to trade a breakout strategy for spot crude oil. Now that the price has traced back to the upper line, traders should go long, with a target of approximately 85 pips, which is the distance of the consolidation pattern. A limit order to take profit would be at roughly $73.20, just below the resistance line at 73.25.

A protective stop should be used in case of a false breakout, and placed inside the consolidation range near the level of $72.05.

Forex Market Analysis provided by Forex Yard.

© 2006 by FxYard Ltd

Disclaimer: Trading Foreign Exchange carries a high level of risk and may not be suitable for all investors. There is a possibility that you could sustain a loss of all of your investment and therefore you should not invest money that you cannot afford to lose. You should be aware of all the risks associated with Foreign Exchange trading.

Markets Continued Previous Week Risk Taking

Source: ForexYard

The EUR/USD pair continued last week rally during Tuesday trading session, which was the first trading day in the U.S. during this short trading week. The strength of the Euro came along with the Non Manufacturing Purchasing Manager’s index which came lower than expected at 53.8. This figure was released after an array of disappointing data, adding to concern about U.S. continual growth. The EUR/USD pair traded higher through the day but paired some of its gains due to analysts warning about the Euro.

Economic News

USD – ISM Non Manufacturing Came Lower Than Expected

The dollar fell against most of its major counterparts Tuesday after data showed Non- Manufacturing PMI fell in June, raising doubts about the U.S. economy and causing investors to reduce exposure to risk. Analysts are concerned the U.S. would not grow in 2010 as anticipated earlier in spite of fiscal packages introduced during 2009-2010. These concerns are turning the U.S. Dollar weaker against its major counterparts.

The EUR/USD cross is actually currently trading higher by 60 pips today at 1.2600 levels. Against the Yen, the Dollar is trading lower by 30 pips at around 87.50 which served as a significant support line. The AUD and CAD were among the biggest gainers yesterday and closed trading at $0.8488 and 1.0560 respectively.

Today is a quiet news day for the U.S., as there are no economic data releases on the calendar today. However, Japan and Euro-zone appear to be releasing the bulk of today’s news, which means we may see a day of trading with low liquidity and therefore increased volatility. Day-traders can take advantage of these intense trading days by swinging within the larger-than-normal price fluctuations.

EUR – Rally Continued Due to Weak U.S. Disappointing PMI figures

The Euro continued its rally against the U.S. Dollar. The rally was supported by an array of weak economic data since last week. The latest figure, Non Manufacturing Purchasing Manager’s index, released yesterday came less than expected. The EUR traded much higher against the USD during yesterday’s trading session as it reached $1.2661. Thereafter it paired some of it gains, while analysts raised concerns about the EUR. The rally thus far is seen more as a correction as traders locked recent profits from betting against the EUR. The Euro is also supported by the speculation that China is buying the Euro to keep the European currency high and support local export to Europe.

The EUR also staged a rally versus the British Pound; EUR/GBP is currently trading at 0.8330, two weeks high, after hitting 19-month lows at a 0.8065.

Looking ahead to today, the most important economic indicator scheduled to be released from the Euro-Zone is the German Factory Orders at 10:00 GMT. Analysts are forecasting this figure to decrease from its previous reading. Traders will be paying close attention to today’s announcement as a stronger than expected result may continue to boost the EUR in the short-term.

JPY – Remained a Safe Heaven Currency

The JPY strengthen slightly against the U.S. Dollar as investors expressed their concerns about the U.S. economy by selling the U.S. Dollar and buying the Japanese yen. The Yen traded mixed yesterday against its major counterparts. It strengthened against the British pound, but was weaker against AUD and the EUR.

Looking ahead to today traders should pay attention to the 87.33 support line, crossing down may take the USD/JPY even lower. Some analysts estimate that the yen should rebound its recent rally against the USD.

Crude Oil – Worries about Double Dip Hit Crude Oil price

Crude Oil price was slightly higher yesterday after recovery concerns sent the price lower by more than 8% during last week trading session. It is expected to remain flat today or little change, due to low volume of economic news released. However, price might decline further in the short term even toward $65 if economic figures continue to deteriorate. Investors are worried about a possible double dip, or a renewed recession. Crude Oil is trading at 72.15, during early trading hours.

Gold prices have dropped significantly during early trading hours today, after reaching record high levels last week. Gold is considered a safe haven when expectations are for high inflation. Recent data indicating a possible deflation is sending investors away from holding Gold. Gold price decline trend is expected to continue if more U.S. figures indicate global recovery is slowing. Gold price is trading at 1189.15 during early trading hours.

Technical News

EUR/USD

The bullish trend is loosing its steam and the pair seems to consolidate around the 1.2585 level. The daily chart’s Slow Stochastic is showing a fresh bearish cross suggesting that downwards correction might take place in the nearest time frame. When the downwards breach occurs, going short with tight stops appears to be preferable strategy.

GBP/USD

The pair has been range-trading for a while now, with no specific direction. The Daily chart’s Slow Stochastic providing us with mixed signals. All oscillators on the 4 hour chart do not provide a clear direction as well. Waiting for a clearer sign on the hourlies might be a good strategy today.

USD/JPY

The cross has been dropping for the past month now, as it now stands at the 87.50 level. However, the daily Chart’s RSI is already floating in the oversold territory indicating that a bullish correction might take place in the nearest future. Going long with tight stops may turn out to be the right choice today.

USD/CHF

The pair has recorded much bearish behavior in the past several days. However, the technical data indicates that this trend may reverse anytime soon. For example, the daily chart’s Stochastic Slow signals that a bullish reversal is imminent. An upward trend today is also supported by the RSI. Going long with tight stops may turn out to pay off today.

The Wild Card

Gold

Gold prices have dropped significantly yesterday and peaked at $1189.15 an ounce. However, on the daily chart RSI is floating in an oversold territory suggests that a bullish correction is impending. This might be a great opportunity for forex traders to enter the trend at a very early stage.

Forex Market Analysis provided by Forex Yard.

© 2006 by FxYard Ltd

Disclaimer: Trading Foreign Exchange carries a high level of risk and may not be suitable for all investors. There is a possibility that you could sustain a loss of all of your investment and therefore you should not invest money that you cannot afford to lose. You should be aware of all the risks associated with Foreign Exchange trading.

Forex Daily Market Review July 07, 2010

By eToro – The Euro moved higher as investors attention focused on US weakness as opposed to the European debt crisis.  The EUR/USD touched resistance at 1.2662, before reversing course and edging down.  The Euro is likely to break through 1.2670 and test the 1.2750 level. Click here to read the full daily Review

Forex Market Analysis provided by eToro

Disclaimer: Trading in the Foreign Exchange market might carry potential rewards, but also potential risks. You must be aware of the risks and are willing to accept them in order to trade in the foreign exchange market. Don’t trade with money you can’t afford to lose.

EURUSD’s rise extends to 1.2662

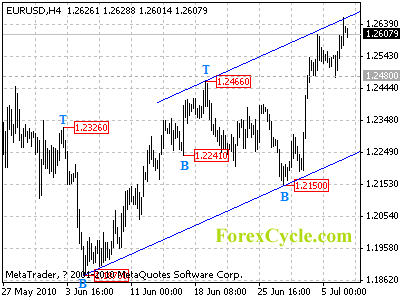
EURUSD’s rise from 1.2150 extends further to as high as 1.2662. Now the pair is facing the upper boundary of the price channel on 4-hour chart, consolidation of uptrend would more likely be seen in a couple of days. Key support is now at 1.2480, a break below this level will indicate that a cycle top has be formed, and the rise from 1.2150 has completed, then pullback to lower boundary of the channel could be seen. However, as long as 1.2480 support holds, the pair remains in uptrend from 1.2150, and another rise to 1.3000 is still possible.

eurusd

Daily Forex Forecast

Forex Daily Market Commentary

By GCI Forex Research

Fundamental Outlook at 1400 GMT (EDT + 0400)

The euro appreciated vis-à-vis the U.S. dollar today as the single currency tested offers around the US$ 1.2655 level and was supported around the $1.2480 level.  The common currency reached its highest level since 21 May as dealers were less risk-averse on the heels of stronger global equity markets.  Liquidity was normalized following the U.S. Independence Day holiday weekend.  Yields on German and French government bonds are hovering near record lows and Austria successfully sold €1.32 billion in bonds today.  Germany plans to auction as much as €5 billion in ten-year debt tomorrow.  Most traders expect European Central Bank will keep monetary policy unchanged on Thursday.  ECB President Trichet will speak after the ECB’s decision is announced and he is expected to discuss liquidity provisions by the ECB and  the stress tests that will be conducted on eurozone banks.  An anonymous ECB official today reported the central bank is pleased with the manner in which the euro has stabilized and suggested the ECB may continue with its extraordinary monetary policy measures until 2011.  There is also talk that German ECB officials want to end the ECB’s asset purchase program this year.  ECB official Noyer said economic growth needs to be “balanced and sustainable.”  Data to be released in the eurozone tomorrow include EMU-16 Q1 gross domestic product, German May factory orders, and the French May trade balance.  In U.S. news, data released today saw the June ISM non-manufacturing index decline more-than-expected to 53.8, lower than the May print of 55.4.  Data to be released tomorrow include MBA mortgage applications.  Richmond Fed President Lacker was quoted in the Japanese media as saying consumer spending is “moderately strong” while Dallas Fed President Fisher reported households are “cautious.”  Economists are closely scrutinizing U.S. economic data to see if the recent moderation in economic growth worsens and the U.S. encounters a double dip recession.  The U.S. economy is also experiencing disinflationary pressures.  Euro offers are cited around the US$ 1.2720 level.

¥/ CNY

The yen depreciated vis-à-vis the U.S. dollar today as the greenback tested offers around the ¥87.95 level and was supported around the ¥87.40 level.  U.S. dollar sentiment eroded further and the pair stopped just short of testing key technical support around the ¥87.20 level.  The yen reversed course and was given across the board as dealers cited better risk-taking that followed the release of stronger-than-expected Australian May trade surplus data.  Data released in Japan overnight saw the May leading index fall to 98.7 while the May coincident index ticked lower to 101.2.   Bank of Japan official Toyama yesterday said the Tokyo interbank offered rate is “substantially” deviating from appropriate levels.  Tibor fell yesterday for a fourth consecutive day to 0.380%, its lowest level since July 2006.  The yen will likely remain strong provided growth estimates for the U.S. and Europe remain muted, absent any intervention from the Japanese government.  The Japanese media continues to report Bank of Japan may lift its 2010 economic growth forecast to around 2.5% from the current forecast of 1.8%.  Dealers are paying close attention to Japanese politics where Prime Minister Kan’s Democratic Party of Japan party could lose its upper-house majority on 11 July.  Kan and the DPJ are seeking to increase taxes.  Data to be released in Japan this week include May machine orders and current account data on Wednesday.  The Nikkei 225 stock index climbed 0.77% to close at ¥9,338.04.  U.S. dollar bids are cited around the ¥86.29 level.   The euro moved higher vis-à-vis the yen as the single currency tested offers around the ¥110.85 level and was supported around the ¥109.15 level.  The British pound moved higher vis-à-vis the yen as sterling tested offers around the ¥133.65 level while the Swiss franc moved higher vis-à-vis the yen and tested offers around the ¥83.05 level. In Chinese news, the U.S. dollar appreciated vis-à-vis the Chinese yuan as the greenback closed at CNY 6.7805 in the over-the-counter market, up from CNY 6.7758.  The State Administration of Foreign Exchange noted a depreciation in the U.S. dollar will not cause “real” losses from foreign reserve investments.  Agricultural Bank plans to raise as much as US$ 20.1 billion by selling equity in Shanghai and Hong Kong.  Dealers are reporting People’s Bank of China has purchased significant amount of Japanese government bonds, approximately US$ 6 billion between January and April.  The big news in China yesterday was a slide in the HSBC June services index to 55.6 from 56.4 and these data follow recent weaker data in the manufacturing sector.  Some economists are scaling back their Chinese GDP growth forecasts for the fourth quarter to an annualized 8%.  Notably, the Chinese economy expanded 11.9% y/y in the first three quarters of 2010.  Premier Wen this weekend reported the Chinese government will remain flexible on account of “very complicated” economic situations in China and abroad.

£

The British pound appreciated vis-à-vis the U.S. dollar today as cable tested offers around the US$ 1.5225 level and was supported around the US$ 1.5080 level.  Bank of England is expected to keep its headline Bank rate target unchanged this week at 0.50% and keep its asset purchase program unchanged at £200 billion.  BCC today reported the BoE is unlikely to change its Bank Rate before May 2011.  It was announced yesterday that economic forecaster Martin Weale will join the BoE Monetary Policy Committee as an external member.  Traders will pay very close attention to Thursday’s MPC vote to see if there are additional calls for higher rates.  Traders await the release of the BRC June shop price index.  Cable bids are cited around the US$ 1.4620 level.  The euro appreciated vis-à-vis the British pound as the single currency tested offers around the £0.8325 level and was supported around the £0.8265 level.

CHF

The Swiss franc appreciated vis-à-vis the U.S. dollar today as the greenback tested bids around the CHF 1.0560 level and was capped around the CHF 1.0665 level.  Data released in Switzerland today saw June consumer price inflation off 0.4% m/m and up 0.5% y/y, a moderation of price pressures.  The June unemployment rate will be released on Thursday and is expected to come in around 3.7%.  Swiss National Bank’s foreign currency holdings declined last month to CHF 225.8 billion from CHF 232.1 billion in May as SNB officials stopped selling francs for euro or U.S. dollars.  Swiss National Bank President Hildebrand yesterday said he is “closely monitoring” the franc, adding its fluctuation has “clearly increased.”  U.S. dollar offers are cited around the CHF 1.0980 level.  The euro appreciated vis-à-vis the Swiss franc as the single currency tested offers around the CHF 1.3410 level while the British pound moved lower vis-à-vis the Swiss franc and tested bids around the CHF 1.6035 level.

Forex Daily Market Commentary provided by GCI Financial Ltd.

GCI Financial Ltd (”GCI”) is a regulated securities and commodities trading firm, specializing in online Foreign Exchange (”Forex”) brokerage. GCI executes billions of dollars per month in foreign exchange transactions alone. In addition to Forex, GCI is a primary market maker in Contracts for Difference (”CFDs”) on shares, indices and futures, and offers one of the fastest growing online CFD trading services. GCI has over 10,000 clients worldwide, including individual traders, institutions, and money managers. GCI provides an advanced, secure, and comprehensive online trading system. Client funds are insured and held in a separate customer account. In addition, GCI Financial Ltd maintains Net Capital in excess of minimum regulatory requirements.

DISCLAIMER: GCI’s Daily Market Commentary is provided for informational purposes only. The information contained in these reports is gathered from reputable news sources and is not intended to be U.S.ed as investment advice. GCI assumes no responsibility or liability from gains or losses incurred by the information herein contained.

FOREX Update: US Dollar on defensive as Stocks rally. ISM Non-Manufacturing data edges lower in June.

By CountingPips.com

The U.S. dollar has been on the defensive against the major currencies in the early part of the U.S. forex trading session on Tuesday while U.S. stocks have traded to higher levels. The dollar has been falling against the euro, Japanese yen, Australian dollar, Swiss franc, New Zealand dollar, Canadian dollar and the British pound on the first day following the U.S. long weekend, according to currency data from Oanda.

The euro has jumped versus the dollar to a new high since May 21st as the EUR/USD has advanced from today’s 1.2506 opening (00:00 GMT) to trading at approximately 1.2645 before noon of the U.S. trading session.

US stock markets, meanwhile, have gained early in their session today to start off the week as the Dow Jones industrial average has increased over 100 points while the NASDAQ has advanced over 30 points and the S&P 500 has increased by over 10 points so far. Oil has traded higher by $1.62 to level at $73.76 per barrel while gold has decreased by almost $16.00 today to level at $1,191.40 per ounce.

ISM Non-Manufacturing data edges lower

U.S. Non-Manufacturing economic data, released today by the Institute for Supply Management, showed that non-manufacturing economic activity grew in June for the 6th straight month although at a slower pace than May. June’s ISM Report On Business index readings for economic activity were at 53.8 percent following May’s 55.4 percent level.

The June score was worse than economic forecasts which were expecting the ISM index reading to register 55.0 percent but was still in expansion territory. A score above 50 is considered to be growth and less than 50 is considered to be contraction in that sector.

Anthony Nieves, chair of the Institute for Supply Management Non-Manufacturing Business Survey Committee, talked about the survey’s numbers saying, “The New Orders Index decreased 2.7 percentage points to 54.4 percent, and the Employment Index decreased 0.7 percentage point to 49.7 percent, reflecting contraction after one month of growth. The Prices Index decreased 6.8 percentage points to 53.8 percent in June, indicating that prices are still increasing but at a slower rate than in May. According to the NMI, 15 non-manufacturing industries reported growth in June. Respondents’ comments are mostly positive about business conditions; however, there is concern about the effect of employment on the economic recovery.”