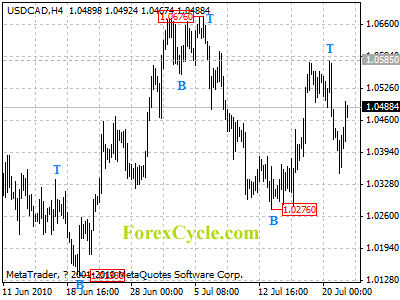
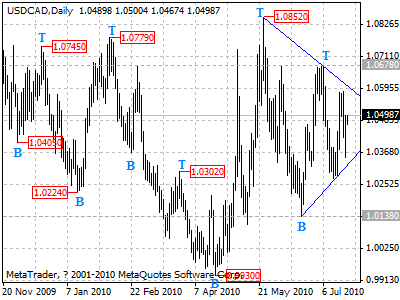
USDCAD is forming a triangle pattern on daily chart. Resistance is at the upper boundary of the pattern, now at 1.0605, a clear break above this level will indicate that the uptrend form 0.9930 has resumed, then another rise towards 1.0852 (May 25 high) could be seen. Support is located at the lower boundary of the pattern, now at 1.0321, a clear below this level could bring price towards 1.0000 area.

