Prechter Called the Uptrend ‘Out’ in April

By Elliott Wave International

Even non-sports fans have heard by now about the recent debacle known as Baseballgate.

With two outs in the ninth inning, a first-base umpire called “SAFE” when the runner was clearly “OUT.” But this was no ordinary missed call; it cost Detroit Tigers pitcher Armando Galarraga a perfect game.

And as the blogosphere flooded with memories of other historic slip-ups that cost “so and so” star “this and that” honor. Demands for the commissioner of baseball to reverse the bad call grew louder by the hour.

It was indeed a very bad call. But the biggest, baddest call of all was not made on a sports field. It was made in the field of finance — specifically on the stock market. To wit: The mainstream umpires of finance stood near first base, and in April made this emphatic call for the uptrend in stocks:

SAFE!!

Call Your Own Shots — Remove Dangerous Mainstream Assumptions from Your Investment Process. Elliott Wave International’s FREE, 118-page Independent Investor eBook shows you exactly what moves markets and what doesn’t. You might be surprised to discover it’s not the Fed or “surprise” news events. Click here to learn more and download your free, 118-page ebook.

In case you missed the event, here’s an instant replay:

  • “Stocks Remain In A Powerful Bull Market.” (April 10 Bloomberg)
  • “Stocks Haven’t Lost Their Appeal As The Market Goes Up, Up, And Away.” (April 21 US News & World Report)
  • “You can use any number of words to describe this bull market. Frothy is not one of them. This market is reasonably priced.” (April 21 AP)
  • “US Stocks Post Longest Winning Streak Since 2004. The recovery should be sustainable and that will drive the market.” (April 24 Bloomberg)
  • “All the economic reports are pointing up… despite lingering worries over debt problems in Greece. Right now, there is virtually no evidence of a top.” (April 30 USA Today)

Yet from its April 26 peak, the DJIA turned down in a jaw-dropping 1000-plus point selloff. The market suffered its worst May since 1940.

The markets have no commissioner to reverse the bad call of the financial mainstream. But at least one team of analysts remained ahead of the most game-changing moves in the world’s leading stock market, including a forecast that called the rally “OUT” in April 2010. Consider the following insight from EWI President Robert Prechter:

On April 16, Prechter published his April Elliott Wave Theorist titled “”Deadly Bearish Picture.” Notice the dates.

We can project a top…between April 15 and May 7, 2010. It is rare to have technical indicators all lined up on one side of the ledger. They were lined up this way — on the bullish side — in late February-early March of 2009. Today, they are just as aligned, but on the bearish side.”

April 26 marks the high for the DJIA, followed by the devastating drop on May 7 — exactly within the date range Prechter’s forecast called for.

Call Your Own Shots — Remove Dangerous Mainstream Assumptions from Your Investment Process. Elliott Wave International’s FREE, 118-page Independent Investor eBook shows you exactly what moves markets and what doesn’t. You might be surprised to discover it’s not the Fed or “surprise” news events. Click here to learn more and download your free, 118-page ebook.

This article was syndicated by Elliott Wave International. EWI is the world’s largest market forecasting firm. Its staff of full-time analysts lead by Chartered Market Technician Robert Prechter provides 24-hour-a-day market analysis to institutional and private investors around the world.

Short Term Straddle On the Euro

fiber june 9, eurusd june 9, eur june 9, euro june 9, consolidation, straddle

Remember when I told you in my last post about the fiber (EURUSD) that the anti-dollar currencies, the euro in particular, could gap down to start the week? Well, guess what happened? Ha! If you look at the pair’s one hour chart, you can see that the pair indeed gapped down to open the week. Like the Aussie in my other post, the euro also continued to fall when the gap got filled up. It then fell by about a hundred pips to mark a new 2010 low at 1.1874. After, it rallied close to 1.200 before being boxed between 1.1911 and the latter. A break above 1.200 could send the pair back to the previous supports at 1.2100 or even at 1.2150. A fall below this year’s low at 1.1874, on the other hand, could place it back on its course towards the downside target (1.1600) of the descending triangle that got recently broken in its daily chart. In any case, the pair would likely continue its trek downside over the long term until it breaks its long term downtrend line and reverses.

(Update) Fundamentally, the pair just cleared the rectangle’s resistance at 1.2000 due to the rally in the US equities markets. US stocks as well as the non-dollar currencies are presently on the rise  (as of this writing) due to a 50% year-over-year advance in Chinese exports. Wow! Given this, the euro could aim for 1.2100 or 1.2150 over the short term before encountering some selling pressure again. While a 50% jump sounds astonishing in a way, it also means that China has ‘crowded out’ the exports of the other countries like the ones in the euro zone. This, of course, does not reflect positively on the euro zone’s economy and the EUR. Another factor that could eventually push the euro down is when Greece defaults or postpones its dues. In fact, according to  recent poll,about 75% believes that Greece would default soon while 40% sees the country abandoning the euro. If any of these two takes place, the euro would definitely take a blow. Dollar-parity, anyone?

More on LaidTrades.com

Zooming Over the Aussie

audusd june 9, australian dollar june 9, aussie june 9, breakdown, USD june 9, AUD june 9

Let us now take a closer look on the AUDUSD. Looking at its  1-hour chart, the pair indeed gapped down to start this week’s trading. Remember that in my post about the pair (click here), I already mentioned the possibility of such price action. The pair opened weak then rallied for awhile  but when the gap was filled it turned around and lost about 75 pips. Recently, the pair broke above the 0.8215 resistance before meeting a wall at the previous support at 0.8288.

Presently, the pair is trading the 0.8215 support and the short term uptrend line. A break below these levels could send the Aussie down near 0.8100. On the brighter note, the pair could reach at least 0.8364 if and when it is able to clear 0.8285.

On the sentimental side, the Aussie gapped down against the greenback when the Asian market ‘priced-in’ the latest developments in Europe and in the US as of Friday. This currency, though, could get some lift if the Reserve Bank of New Zealand, the RBA’s smaller cousin across the Tasman sea, decides to finally hike their rates tomorrow from 2.50% to 2.75%. This, however, could only give the Kiwi as well as the Aussie some temporary lift as the price-shifting factor remains to be the unfolding event in the euro zone. In a recent poll, about 75% believe that Greece will eventually default on their dues. In case this happens, the euro as well as the other non-dollar currencies like the AUD would lose some bigtime support. Any developments that would signal such  would already  weigh on the non-dollar currencies like the Aussie.

More on LaidTrades.com

Doji Candlestick Signals Change in the Trend for Spot Gold

By Russell Glaser – The price of spot gold rose to a new record high as the bullish streak in the commodity continues. However, the commodity was unable to hold the gains through the New York trading session and a possible reversal pattern has formed that could signal a change in the long term trend.

Spot gold prices climbed to a record high of $1251.75 before retreating to its opening day price at $1237.70.

As the commodity closed on its opening day price, a long-legged doji candlestick has formed. This presents a possible reversal signal in the trend of the commodity.

The doji candlestick pattern was formed at a significant price move in the commodity as the price set an all time high yesterday. This only magnifies the significance of the doji candlestick and should serve as a warning of a top in the market and a shift in the trend.

It should also be noted that the doji appears following a long bullish candle from Monday’s trading session. This is emphasizes the forewarning that a top is approaching

More conservative traders may want to couple the signal with another technical indicator in order to verify a change is actually occurring in the trend, however the Japanese candlestick pattern should certainly not be ignored.

Forex Market Analysis provided by Forex Yard.

© 2006 by FxYard Ltd

Disclaimer: Trading Foreign Exchange carries a high level of risk and may not be suitable for all investors. There is a possibility that you could sustain a loss of all of your investment and therefore you should not invest money that you cannot afford to lose. You should be aware of all the risks associated with Foreign Exchange trading.

Euro Climbs Prior to Bernanke Testimony, Gold Falls from Record High

By ForexYardThe Euro pushed higher in the morning hours of the European trading session as the EUR/USD tests the 1.1990 resistance level. This follows the release of better than expected Japanese industrial data. The dollar was lower prior to testimony by Federal Reserve Chairman Ben Bernanke’s this afternoon.

The EUR/USD was higher at 1.1980 after opening the day at 1.1953. The Cable was higher at 1.4500 from an opening day price of 1.4427, while the USD/JPY was unchanged.

Traders are expecting to hear positive remarks regarding the recovery of the U.S. economy in the Fed Chief’s testimony before Congress. The Fed’s Beige Book is due to be released today. Strong numbers could help to boost risk sentiment in the face of the European fiscal troubles. This would help higher yielding currencies such as the euro and the Aussie dollar.

Earlier today the mood in the market was set by better than expected economic data as Japanese core machine orders surprised traders with an output of 4.0% on expectations of a rise of only 1.2%.

Spot gold has fallen today following yesterday’s new record high price of $1251.76. The price of spot gold is down at $1235.

Spot crude oil is trading higher at $72.45 prior to the release of the weekly crude oil inventory report at 14:30 GMT today. The next resistance level for the commodity rests at $75.45.

Forex Market Analysis provided by Forex Yard.

© 2006 by FxYard Ltd

Disclaimer: Trading Foreign Exchange carries a high level of risk and may not be suitable for all investors. There is a possibility that you could sustain a loss of all of your investment and therefore you should not invest money that you cannot afford to lose. You should be aware of all the risks associated with Foreign Exchange trading.

GBP Expecting to Rebound Versus CAD

By Anton Eljwizat – The GBP/CAD pair has experienced much bearishness in the last few days as it currently trades at 151.40. The current bearish trend is expected to come to an end anytime soon, and a bullish correction may be in the making. I will illustrate below that the GBP/CAD may very well be heading for a reversal. Traders are strongly advised to take advantage of the trend at an early stage.

• Below is the 4-hour chart of the GBP/CAD currency pair.

• The technical indicators that are used are the Slow Stochastic and Relative Strength Index.

• Point 1: There is a “doji” candlestick that has formed on the chart, indicating that a reversal should take place.

• Point 2: The Slow Stochastic indicates a bullish cross, signaling that the next move may be in an upward direction.

• Point 3: The Relative Strength Index (RSI) signals that the price of this pair currently floats in the over-sold territory, indicating upward pressure.

GBP/CAD 4-Hour Chart

Forex Market Analysis provided by Forex Yard.

© 2006 by FxYard Ltd

Disclaimer: Trading Foreign Exchange carries a high level of risk and may not be suitable for all investors. There is a possibility that you could sustain a loss of all of your investment and therefore you should not invest money that you cannot afford to lose. You should be aware of all the risks associated with Foreign Exchange trading.

Forex Daily Market Review 09.06.2010

By eToro – The Euro tested the 1.19 level, as traders seemed to be unimpressed with European financial minister’s special purpose vehicle to purchase bonds.  The Euro should continue to test lower prices with 1.1667 as the next support level. Click here to read the full daily Review

Market Analysis provided by eToro

Disclaimer: Trading in the Foreign Exchange market might carry potential rewards, but also potential risks. You must be aware of the risks and are willing to accept them in order to trade in the foreign exchange market. Don’t trade with money you can’t afford to lose.

The EUR Pares Gains Following Swiss Franc Rally

Source: ForexYard

The U.S dollar recovered versus the EUR on Wednesday after a swift move lower by the Swiss franc against both currencies. The EUR reversed its earlier gains as European shares fell, with concerns that Euro Zone debt problems would stifle the region’s economic growth, keeping investors averse to risky assets.

Economic News

USD – Dollar Hits 4 Year High on Rates Outlook

The U.S. currency moved towards a 4 year high against the EUR on speculation U.S. policy makers will reiterate that the economic recovery is gaining pace. The greenback gained to $1.1946 per euro from $1.1973 yesterday. The Dollar climbed as high as $1.1877 per euro on June 7, the strongest since March 2006. Against the yen, the U.S, dollar was flat at 91.34.

Currency traders also absorbed comments from Federal Reserve Chairman Ben Bernanke late Monday. He said he didn’t expect the U.S. economy to suffer a double-dip recession. The Dollar may continue to advance vs. the EUR on speculation the Federal Reserve will begin to normalize its monetary policy before the ECB with the U.S. economy recovering at a faster pace. Analysts said that both these factors are supportive of a strengthening Dollar.

EUR – EUR/CHF Rebounds Sharply

The EUR rose on Tuesday as investors booked profits a day after the currency hit its lowest level against the dollar since early 2006. Against the Dollar, the EUR rose above $1.20 after tumbling to $1.1876 on Monday, its lowest level since March 2006. But analysts said the market was still anxious about debt levels in several Euro Zone countries and debt auctions this week from Portugal and Spain.

The EUR also hit an all-time trough below 1.38 Swiss francs but rebounded sharply, with traders citing Swiss National Bank (SNB) intervention to weaken the franc. Data showing how much Switzerland has benefited from the European debt crisis pushed the Swiss franc to a new high versus the EUR. Analysts said that may have prompted some intervention by the Swiss National Bank — either by buying EUR against the franc or the U.S. dollar. The EUR abruptly rebounded from a low against the Swiss franc earlier spurred talk of intervention by the Swiss National Bank. The SNB has intervened since 2009 to prevent excess franc strength but slowed its EUR purchases recently as the EUR fell below 1.40 francs.

The market remains bearish on the EUR generally, with Monday’s four-year low of $1.1876 still a downside target, followed by expected options triggers around $1.1850.

JPY – Yen Falls on Asian Stocks Rally

The Japanese yen weakened from an 8 year high against the EUR as Asian shares rebounded and Federal Reserve Chairman Ben Bernanke said the U.S. economic recovery was intact. The currency also weakened on speculation that a new Japanese government may favor a weak-yen policy. Japan’s currency declined to 109.61 per EUR from 108.95 in New York yesterday, when it touched 108.07, the weakest since November 2001. Against the U.S. dollar the Yen fell to 91.74 from 91.37.

OIL – Oil Trades above $72 Ahead of U.S Data

Crude oil rose on Tuesday as the EUR bounced higher, lifting oil ahead of inventory data expected to show U.S. crude stocks fell last week. U.S. crude inventories were expected to have fallen for the second straight week as import volumes declined, analysts said ahead of the weekly stocks reports. Crude gained as much as 30 cents, or 0.4%, to $71.74 a barrel. Oil climbed yesterday after Federal Reserve Chairman Ben Bernanke said that the improvement in the world’s largest energy-consuming country is “moderate paced.”

Technical News

EUR/USD

The pair has recorded bearish behavior in the past several days. However, the technical data indicates that this trend may reverse anytime soon. For example, the daily chart’s Slow Stochastic signals that a bullish reversal is imminent. An upward trend today is also supported by the weekly chart’s RSI. Going long with tight stops may be the right move today.

GBP/USD

The 4-hour chart is showing mixed signals with its RSI fluctuating in the neutral territory. However, there is a fresh bullish cross forming on the daily chart’s Slow Stochastic, indicating a bullish correction might take place in the nearest future. When the upward breach occurs, going long with tight stops appears to be the preferred strategy.

USD/JPY

The pair has been range-trading for a while now, with no specific direction. The daily chart’s Slow Stochastic is providing us with mixed signals. The 4 hour charts do not provide a clear direction as well. Waiting for a clearer sign on the hourlies might be a good strategy today.

USD/CHF

The USD/CHF has gone increasingly bearish in the past 2 days, and currently stands at the 1.1530 level. The weekly chart’s RSI indicates this currency cross may fall further today. However, the 4-hour chart’s RSI signals that a bullish reversal may take place today. Entering the pair when the signs are clearer seems to be the wise choice today.

The Wild Card

AUD/NZD

This pair’s sustained upward movement has finally pushed its price into the over-bought territory on the 4-hour chart’s RSI. Not only that, but there actually appears to be a bearish cross on the Slow Stochastic pointing towards an imminent downward correction. Forex traders have the opportunity to wait for the downward breach on the hourly chart and go short in order to ride out the impending wave.

Forex Market Analysis provided by Forex Yard.

© 2006 by FxYard Ltd

Disclaimer: Trading Foreign Exchange carries a high level of risk and may not be suitable for all investors. There is a possibility that you could sustain a loss of all of your investment and therefore you should not invest money that you cannot afford to lose. You should be aware of all the risks associated with Foreign Exchange trading.

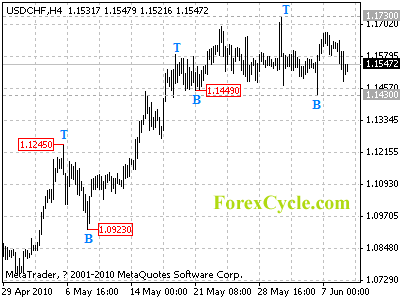
USDCHF stays in a trading range between 1.1430 and 1.1730

USDCHF stays in a trading range between 1.1430 and 1.1730. Lengthier consolidation in the range would more likely be seen in a couple of days. As long as 1.1430 support holds, the price action in the range is treated as consolidation of uptrend form 1.0434 (Apr 1 low), another rise to 1.1900 is still possible after consolidation and a break above 1.1730 could signal resumption of uptrend. However, a break below 1.1430 will indicate that the uptrend from 1.0434 has completed at 1.1730 already, then deeper decline could be seen to 1.1200-1.1300 area.

usdchf

Daily Forex Analysis

The Pound Got Pounded

gbpjpy june 8, guppy june 8, gepp june 8, sterling pound june 8, british pound june 8, JPY june 8, japanese yen june 8,

Here’s an update on the guppy (GBPJPY). In my last post about the pair, I noted that it could find some resistance at the 61.8% Fibonacci retracement level that I marked on its old chart. It, however, surpassed that price (135.00) and reached 136.00 before turning around. When I readjusted my swing high to April 26’s high, I noticed that the 136.00 price then fell in line with the 50% Fib of the new retracements. At present, the pair already broke below the 132.00 support. If it successfully clears 131.00, it could very well revisit its 2010 low once more. Though, in my view, this level could be broken any time soon since the stochastics are still far from the oversold region. Otherwise, it could trade for awhile within a range before swinging in either direction.

Perhaps we all know now the reason behind the recent beating that the pound received. Well, for those who do not know, the sterling pound got pounded late Friday night when Hungarian officials commented on a possibility of a sovereign debt default. This news, to nobody’s suprise, sparked some risk aversion in the markets which was further intensified when the latest US NFP report printed a weaken than projected employment change.

For the coming days, in my view, the pound would be more sensitive to the developments in the euro zone rather than from the UK itself. Though, if the BOE’s decides to keep its asset purchase facility and interest rate unchanged, it could then add to the pound’s already weakened state. The Bank of England’s monetary policy decision, by the way, will be held on Thursday (June 10). So stay tune!

More on LaidTrades.com