The Return of the Aussie Bulls?

AUDUSD june 19 21, australian dollar june 19 21, aussie june 19 21, AUD june 19 21, A$, double top breakdown, double bottom breakout

In my blog last June 15, I asked whether the AUDUSD will head lower or higher. It turned out that the pair had moved north, at least for the time being, against the odds. As you can see, the pair had previously slid from a double top formation. Even before reaching its minimum downside target, it had already rallied and broken back above the pattern’s former neckline. This week’s price action which started on a very bullish note with a gap up confirmed its breakout from a shorter term double bottom. But withthe stochstics now in the extreme overbought area, the pair coul range fo awhile above the necklines of the double bottom and top before making a move for its minimum upside target (calculated by projecting the height of the double bottom formation from the point of breakout) somewhere at 0.9050. On the sour side, it could revisit this year’s low if and when it breaks below the neckline supports. In any case, this week’s moves are probably the first indication that the Australian dollar could be back on the hunt.

On the fundamental front, no major economic updates are due in Australia this week. Though, the high profile events in the other major countries would more likely influence the Aussie’s  price action. On tap this week are Germany’s Ifo business climate survey, Canada’s inflation and retail sales figures, New Zealand’s current account and 1Q GDP numbers, and the US’s FEderal funds decision and durable orders along with its weekly unemployment claims. Upbeat marks from any of these accounts could spur risk appetite, benefiting the higher yielding currencies like the AUD.

More on LaidTrades.com

Forex Weekly Market Review June 21, 2010

By eToro – The equity markets displayed a strong performance this week with the S&P 500 Index climbing 26 points or 2.4% to close the week at 1117.  The benchmark index easily moved through the 200-day moving average, which had acted as strong resistance until this week.  The correction of the dollar was the impetuous for the strong returns, which could continue into next week.

Click here for the full review

Forex Market Analysis provided by eToro

Disclaimer: Trading in the Foreign Exchange market might carry potential rewards, but also potential risks. You must be aware of the risks and are willing to accept them in order to trade in the foreign exchange market. Don’t trade with money you can’t afford to lose.

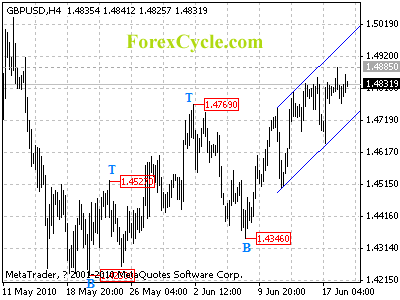
GBPUSD stays in a rising price channel

GBPUSD stays in a rising price channel and remains in uptrend from 1.4346. The fall from 1.4885 is more likely consolidation of uptrend. As long as the channel support (now at 1.4700) holds, uptrend will continue. However, a clear break below the channel support will indicate that a cycle top has been formed on 4-hour chart and the rise from 1.4346 has completed, then deeper decline could be seen to 1.4400-1.4450 area.

gbpusd

Daily Forex Forecast

GBPUSD’s bounce extends to 1.4885

GBPUSD’s bounce from 1.4230 extends further to as high as 1.4885. Now the pair is facing the upper boundary of the rising price channel. Pullback would more likely be seen next week. Support is now at the lower boundary of the rising price channel now at 1.4425, a clear break below the channel support will indicate that the long term downtrend from 1.7042 (2009 high) has resumed, then another fall to 1.4000 could be seen.

For long term analysis, GBPUSD is in bearish movement from 1.7042 (Aug 5, 2009 high). Fall to 1.4000 area to reach next cycle bottom on weekly chart is expected in next several weeks.

gbpusd

Weekly Forex Analysis

Steve Hochberg on CNBC: Markets Overbought?

Steve Hochberg on CNBC Video: Markets Overbought?

Skeptics are still worried the market has come too far, too fast. EWI’s Chief Market Analyst Steve Hochberg joins CNBC Squawk Box host Joe Kernen on April 15, 2010 to share his view.

Get More Market Analysis in Steve Hochberg’s FREE 16-Page Report
You’ve bared witness to the Great Asset Mania with signs such as unsustainable government spending, overvalued stocks and fear of a so-called double dip recession. But is it over and could it rise again? What does it mean for your investments? Originally available to subscribers at $59, you can now download this 16-page report free for a limited time Learn more here.

About the Publisher, Elliott Wave International
Founded in 1979 by Robert R. Prechter Jr., Elliott Wave International (EWI) is the world’s largest market forecasting firm. Its staff of full-time analysts provides 24-hour-a-day market analysis to institutional and private investors around the world.

FOREX: Euro dips vs Dollar today after touching 3-week high. EUR/USD trades over 1.2350

By CountingPips.com

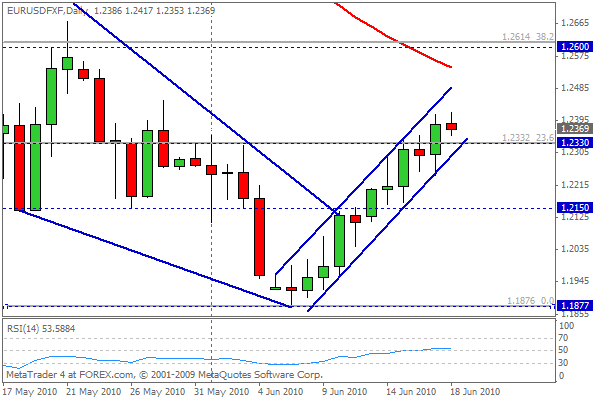
The euro has retreated slightly in forex trading against the U.S. dollar today after increasing to a three-week high point in earlier trading. The EUR/USD currency pair bounced off the 1.2417 exchange rate, its highest level since May 28th as the pair continues its rebound off of the June 7th low and is on the way to a second consecutive gaining week.

The EUR/USD opened the day near the 1.2386 mark and adavanced in early trading to 1.2417 where resistence pushed the pair lower near its current 1.2360 level. The low for today is at the 1.2353 level (Wednesday’s high point).

The EUR/USD has managed to stay above the 1.2330 level (2008 low point) and could see further upside potential with the 1.2600 area looming as potential resistance. The 1.2600 area has acted as previous support/resistance area and the 38.2 fibo retracement from 1.3817 to 1.1876 is right around the 1.2620 level. Below 1.2330, the 1.2150 level (recent support) and 21-day simple moving average (1.2227) levels are of potential support while a break below the 1.2150 level will provide downside pressure for a retest of the 1.1876 level.

EUR/USD Daily Chart

forex-eurusd

Key Levels:

1.2620 – fibo retracement level
1.2580/1.2600 – previous support/resistence
1.2543 – 50-day moving average
1.2452 – May 28th resistence
1.2417 – Intraday high 6-18
1.2330 – 2008 low support/resistence
1.2227 – 21-day moving average
1.2150 – level (recent support)
1.1876 – June 7th (4-year low)

Here Comes the Housing Market Double Dip

Here Comes the Housing Market Double Dip

By Justice Litle, Editorial Director, Taipan Publishing Group

The housing market double dip is coming… along with an unpopped Australian bubble just waiting to burst.

Remember when “safe as houses” was a legitimate expression? Now it’s a bit of an ironic joke. What counts as no joke at all, however, is the chaos investors will face when the second wave of housing market turmoil hits.

There has been such a grand buffet of top-down troubles to choose from – collapsing eurozone, overheating China, the BP oil spill – that global real estate markets have been back-burnered. Based on the way things are unfolding, though, they will soon come back to the fore.

Aussie Aussie!

Before we talk about “second waves,” let’s talk about first waves. There are yet a few housing bubbles in the world ready to pop in grand style – with vicious outcomes to count on when they do.

Take the land down under, for example. Australia has long been known as “the lucky country” for its beautiful climate and abundant natural resources. But the Aussies won’t be feeling so lucky when their bubble goes kablooey…

Hot New “Secret Backdoor” Niche Market Could Turn $5,000 Into $1.5 Million by December 2010!

A hot niche market is cranking out stunning returns of 7,100%… 12,300%… even 13,900% in a single day. Find out how to cash in on this market with these exclusive “secret backdoor” trading strategies.

The Australian housing market is a “time bomb,” says legendary investor and renowned bubble-spotter Jeremy Grantham. “You cannot possibly miss it,” he adds, further noting that “sooner or later, the rates will go up and the game is over.”

Grantham’s logic is irresistibly simple:

  • The price of housing is typically in the range of 3.5 times family income.
  • Australia’s home prices are now trading at an average of 7.5 times, i.e. superbubble territory.
  • Real estate bubbles are the same because they are all “unique and different.”
  • That is to say, the bulls always advance “special” reasons why such and such bubble won’t pop.
  • Without fail, the “special case” bubble always pops anyway. By the keen-eyed measure of Grantham’s quantitative asset management firm – which runs $106 billion at last count – every major asset bubble in all of recorded history has burst.

And thus, if Grantham’s expectations play out in accordance with the unblemished track record of historical norms, Aussie home prices would have to fall more than forty percent (!) to revert back to long-term trend.

By various measures, China, Canada, and the U.K. are also home to unpopped housing bubbles of disconcerting size. They, too, will burst. And unlike the U.S. housing bubble and bust, these latter burstings will appear against a backdrop of spent stimulus and gargantuan government debt burdens, making it that much harder for Keynesian-minded politicians to ride to the rescue with checks they can’t cash.

Chart: Gold Index

Have we mentioned that now would be a good time to learn how to go short, if you aren’t versed in the practice already? Have we further mentioned, oh, maybe just a few hundred times or so, that now is a good time to consider gold? (Perhaps it should be mentioned again, just in case.)

American Bubble Redux

For the moment at least, the worrisome housing market action is not in the “waiting to pop” countries. It is back in the United States, where an already busted market is getting ready for another lurch downward. (My fellow editor Adam Lass recently wrote about the U.S. housing market. Sign up here to check out his investment commentary.)

Meredith Whitney, the Wall Street analyst who made a name for herself predicting Citigroup would crash, is ready and waiting for more housing pain. “The housing market will surely double dip,” she said in March of this year. And now it appears she is right.

The troubles circle round in a giant feedback loop. Persistent weakness in the economy – high unemployment, high concentrations of temporary workers, and reduced wages for those who kept their jobs – are deterring would-be home buyers from shelling out on new home purchases.

Meanwhile, the much-vaunted homebuyer tax credit is fading away. Like other forms of stimulus, it was a temporary remedy… a short-term goose, not any type of permanent solution.

Thanks to the soon-to-expire credit, U.S. homebuilders are sweating bullets. They know that once the credit goes away, so will new home sales.

“U.S. builders such as LGI Homes are on a tight deadline to finish houses by the end of June,” Bloomberg reports, “so purchasers can get a federal tax credit of as much as $8,000… That’s speeding up a construction process that for some builders can take five to six months.”

In fact some builders, like KB Home, are so desperate to move inventory they are giving away teeny-bopper concert tickets. Per the WSJ:

KB Home, the nation’s largest builder, is dangling the chance to see YouTube/Twitter phenom Justin Bieber in concert. Visitors to any Las Vegas-area community before July 5 can enter to win four tickets and a soundcheck pass to Mr. Bieber’s sold-out July 24th concert at the Las Vegas Planet Hollywood Resort & Casino.

If you’re over the age of 14, you may not be familiar with Mr. Bieber…

Mr. Market doesn’t seem all that thrilled by this pre-teen enticement strategy, seeing as how KB Home’s (KBH:NYSE) stock price is down circa 35% in the past two months or so.

Squeezing Blood From a Stone

Nor is it just the builders feeling heat. “Over the past year,” The Washington Post reports, “lenders have become much more aggressive in trying to recoup money lost in foreclosures and other distressed sales, creating more grief for people who thought their real estate headaches were far behind.”

Imagine the indignity faced by men like Fernando Palacio, who lost his home to the bank… saw the property sold off in foreclosure auction… and then received a bill for a whopping $148,062, the bank’s calculated shortfall on the sale.

To go through the hell of losing a home, only to be hit by a six-figure bill afterwards – to be emotionally and fiscally broken, and then left less than broke – is almost too much financial torture for the average Joe to take. Yet this is exactly what is happening in states where lenders are allowed such maneuvers.

How YOU can “tax” THEM

Our Pulitzer Prize-nominated journalist-turned-analyst shows you the 100% legal way to “tax” the U.S. government for $1,150,000 or MORE…

He reveals everything in a FREE underground wealth exposé.

A Self-Feeding Spiral

Adding to this litany of woes: “Numerous municipalities are struggling financially,” the WSJ reports. “A Rhode Island city recently said it faces insolvency. Harrisburg, the capital of Pennsylvania, is considering a municipal bankruptcy filing….”

When banks start dumping foreclosed homes at fire-sale prices, real estate values drop. And as municipalities struggle to pay bills, property taxes rise and local services – water, trash, policing, schools etc. – are cut back.

Of course, the more that real estate values drop, the lower the income from property taxes the municipality receives. And so property taxes have to rise further in percentage terms to make up for the shortfall… or local services have to experience even deeper cuts, which in turn reduces local employment and depresses property values further. And so it goes in a self-feeding spiral.

Thank you so much, oh wise government leaders, for turning the “American dream” of home ownership into a full-fledged nightmare by distorting the U.S. housing market with a slew of harebrained gimmicks and incentives that never made sense in the first place. You sold us warm apple pie with pure B.S. filling, and we ate the whole thing.

A Target-Rich Environment

So how to respond to all this, other than shaking one’s head or gnashing one’s teeth?

By figuring out what to buy… what to sell… and what to sell short. As bond giant PIMCO observes, Real Estate Investment Trusts, or REITs, could be badly hit by the fallout from a slowing economy and a housing market double dip. Other consumer retail names are heavily exposed to a pattern of declining consumer spending among the middle and lower tiers.

For most investors, the housing market double-dip fallout will not be pleasant. But for those willing to do a little trading, it will be what one might call a “target-rich environment.

Don’t forget to follow us on Facebook and Twitter for the latest in financial market news, investment commentary and exclusive special promotions.

About the Author:

Justice Litle is the Editorial Director of Taipan Publishing Group, Editor of Justice Litle’s Macro Trader and Managing Editor to the free investing and trading e-letter Taipan Daily. Justice began his career by pursuing a Ph.D. in literature and philosophy at Oxford University in England, and continued his education at Pulacki University in Olomouc, Czech Republic, and Macquarie University in Sydney, Australia.

Euro Continues to Gain on USD As Spanish Concerns Ease

By Forex Yard EUR/USD has been hovering around the 1.2400 level throughout today’s trading session, a 3-week high for the pair. A series of U.S. economic indicators that came in below expectations, as well as fresh signs that Spanish deficits are not as bad as originally thought, were largely responsible for the Euro’s gains. Meanwhile the greenback has fallen against most of its major currency rivals, including the British Pound and Yen. USD/JPY has fallen almost 40 pips since last night.

Traders can expect a slow second half of the day as we close out the week. With no significant news events scheduled today, low volatility is expected in the marketplace. Traders should watch out, as unpredictable price movements sometimes occur in these situations. USD/CAD may prove to be particularly vulnerable to these price movements as minor Canadian news is scheduled for 12:30 GMT.

Forex Market Analysis provided by Forex Yard.

© 2006 by FxYard Ltd

Disclaimer: Trading Foreign Exchange carries a high level of risk and may not be suitable for all investors. There is a possibility that you could sustain a loss of all of your investment and therefore you should not invest money that you cannot afford to lose. You should be aware of all the risks associated with Foreign Exchange trading.

GBP Expected to Rebound Against CHF

By Anton Eljwizat – The GBP has dropped significantly versus the CHF in the past several days, and it is currently traded around 164.87. And now as evident in the data below, the 4-hour chart is giving bullish signals, indicating that GBP/CHF pair might go up. Forex traders can take advantage of this impending movement by having their Entry Orders in place to capture this reversal.

• Below is the 4-hour chart of the GBP/CHF currency pair.

• The technical indicators that are used are the William Percent Range, Relative Strength Index (RSI), and Slow Stochastic.

• Point 1: The Slow Stochastic indicates an impending bullish cross, signaling that the next move may be in an upward direction.

• Point 2: Point 1: The Relative Strength Index (RSI) indicates that the price of this cross currently floats in the oversold territory, signaling upward pressure.

• Point 3: The Williams Percent Ranges is showing that this pair is heavily over-sold and may be experiencing strong upward pressure.

GBP/CHF 4-Hour Chart

Forex Market Analysis provided by Forex Yard.

© 2006 by FxYard Ltd

Disclaimer: Trading Foreign Exchange carries a high level of risk and may not be suitable for all investors. There is a possibility that you could sustain a loss of all of your investment and therefore you should not invest money that you cannot afford to lose. You should be aware of all the risks associated with Foreign Exchange trading.

Euro Continues to Rebound on Successful Spanish Debt Auction; Swissie Soars

Source: ForexYard

Risky currencies performed well yesterday following a successful auction of Spanish bonds that helped to ease fears of the euro zone fiscal crisis, prompting investors to take on riskier positions. The Swiss franc was a big mover after the Swiss National Bank declared it would end its efforts to weaken the currency.

Economic News

USD – Higher Equities Fuel USD Weakness

The EUR/USD rose to its highest level since May 28th before falling back a bit due to weakness in U.S. equities. Traders were motivated to take on further risk following a successful auction of Spanish debentures earlier in the day. But mixed U.S. economic data sank equities as the S&P 500 finished up marginally with a gain of 0.13%.

Dollar weakness was prevalent throughout the U.S. trading session as the EUR/USD traded higher at 1.2392, up from an opening day price of 1.2272. The cable was higher as well, closing up at 1.4817 after opening at 1.4707. The dollar was stronger versus the yen as the USD/JPY traded below the support level of 90.80, only to close at 90.84.

U.S. data was mixed on a news heavy day. Core CPI came in as forecasted at 0.1%. The current account was better than expected, coming in lower at -109B on expectations of -120B. However, weekly unemployment claims were higher than expected at 472K on forecasts of only 452K. The Philly Fed Manufacturing Index was also significantly lower at 8.0 with a forecasted value of 21.1.

The calendar is lacking any major economic data releases for today’s trading. As such, traders will want to follow the movements of the major equity indices as the dollar has recently been trading in an inverse relationship to equities. Strength in stocks could propel the EUR/USD to its next resistance line which rests at 1.2450.

EUR – Swissie Strengthens After Swiss Bank Policy Shift

The Swiss franc was in the spotlight yesterday following an announcement by Swiss National Bank (SNB) Chairman Phillipp Hildebrand that the current expansionary monetary policy in not feasible over the long term horizon without compromising long term price stability. Deflationary risks have all but dissipated and growth forecasts have risen to 2.0% from 1.5%.

This effectively ends the intervention in the currency markets by the SNB. The SNB has been artificially weakening the Swissie by buying euros on the inter-bank market. This has been done to support export activity Switzerland.

Following the announcement, the USD/CHF tumbled below its most recent rising trend line, falling to a low of 1.1094. The EUR/CHF also fell sharply yesterday but the decline in the pair was held in check at the 1.3740 support level, close to the pair’s all-time low.

The euro was supported by yesterday’s successful auction of Spanish debentures. Strong demand was seen for the 10-year and 30-year bonds, but the sale was accompanied with significantly higher yields. This is due to the fiscal crisis in the euro zone.

The successful bond auction helped to boost the euro yesterday as the currency continues to recover from its lowest level versus the dollar in 4 years. Despite the recent appreciation of the euro, the currency remains fundamentally weak in the long term.

JPY – Yen Reaches Key Support Level at 90.80

The Yen was mixed versus the majors yesterday, advancing against the dollar and the euro, but falling against the pound. Much of the movements in the currency can be attributed to traders taking on greater risk in the forex market. As traders become more comfortable with the market’s stability, traders move into higher yielding currencies and sell safe havens such as the yen.

Following the successful auction of Spanish bonds and a rise in equities, traders sold the yen. Weak U.S. unemployment numbers also helped to strengthen the yen versus the dollar.

The USD/JPY traded below the recent support level of 90.80, only to close at 90.84. The EUR/JPY was higher, trading at 112.54, up from an opening day price of 112.71, while the GBP/JPY was up at 134.62 after opening at 134.18.

Now that the USD/JPY has reached the support level at 90.80 but failed to close below this price, we may see the pair bounce back up towards its next resistance level at 93.00.

Crude Oil – Spot Crude Oil Falls on Mixed U.S. Economic Data

The price of spot crude oil declined yesterday for the second day in a row following mixed U.S. economic data. Spot crude oil prices ended the day at $76.57, after an opening day price of 76.93.

U.S. Core CPI came in as forecasted at 0.1%. The current account was better than expected, coming in lower at -109B on expectations of -120B. However, weekly unemployment claims were higher than expected at 472K on forecasts of only 452K. The Philly Fed Manufacturing Index was also significantly lower at 8.0 with a forecasted value of 21.1.

Recently spot crude oil prices have been taking cues from the equity markets. Yesterday’s minute gains in the S&P 500 highlight this type of market behavior. With an absence of economic data on today’s calendar, traders should be following the performance of the major equity indices to identify the daily trend of spot crude oil prices. A break of the $78.10 resistance level will put the price of spot crude oil above the 200 day moving average.

Technical News

EUR/USD

There is a bearish cross forming on the daily chart’s Slow Stochastic indicating a bearish correction might take place in the nearest future. The downward direction on the 4-hour chart’s Slow Stochastic also supports this notion. When the downward breach occurs, going short with tight stops appears to be preferable strategy.

GBP/USD

The pair has recorded much bullish behavior in the past several days. However, the technical data indicates that this trend may reverse anytime soon. For example, the 4-hour chart’s Stochastic Slow signals that a bearish reversal is imminent. . Going short with tight stops might be a wise choice.

USD/JPY

The pair currently sits near the bottom border of the daily chart’s RSI, suggesting an upward correction may be imminent. The upward direction on the 4-hour chart’s Momentum oscillator also supports this notion. When the upwards breach occurs, going long with tight stops appears to be preferable strategy.

USD/CHF

The USD/CHF cross has experienced a bearish trend for the past 2 weeks. However, it seems that this trend may be coming to an end. The RSI of the daily chart shows the pair floating in the over-sold territory, indicating that an upward correction will happen anytime soon. Going long with tight stops might be a wise choice.

The Wild Card

NZD/USD

This pair’s sustained upward movement has finally pushed its price into the over-bought territory on the 4-hour chart’s RSI. Not only that, but there actually appears to be a bearish cross on the Slow Stochastic pointing to an imminent downward correction. Forex Forex traders have the opportunity to wait for the downward breach on the hourlies and go short in order to ride out the impending wave.

Forex Market Analysis provided by Forex Yard.

© 2006 by FxYard Ltd

Disclaimer: Trading Foreign Exchange carries a high level of risk and may not be suitable for all investors. There is a possibility that you could sustain a loss of all of your investment and therefore you should not invest money that you cannot afford to lose. You should be aware of all the risks associated with Foreign Exchange trading.