What Does NOT Move Markets? Examining 8 Claims of Market Efficiency

By Susan Walker

If everyone says that shocks from outside the financial system — so-called exogenous shocks — can affect it for better or worse, they must be right.

It just sounds so darned logical, right? Economists believe this trope to be true, mainly because they believe that investors are rational thinkers who re-evaluate their positions after every new bit of relevant information turns up.

Beginning to sound slightly impossible? Well, yes.

It turns out that logic is exactly what’s missing from this it-feels-so-right idea of rational reaction to exogenous shocks. Read an excerpt from Robert Prechter’s February 2010 Elliott Wave Theorist to see how Prechter deals with this widely held belief.

Find out what really moves markets — download the free 118-page Independent Investor eBook. The Independent Investor eBook shows you exactly what moves markets and what doesn’t. You might be surprised to discover it’s not the Fed or “surprise” news events. Learn more, and download your free ebook here.

* * * * *

Excerpted from Prechter’s February 2010 Elliott Wave Theorist, published Feb. 19, 2010

The Efficient Market Hypothesis (EMH) argues that as new information enters the marketplace, investors revalue stocks accordingly. … In such a world, the market would fluctuate narrowly around equilibrium as minor bits of news about individual companies mostly canceled each other out. Then important events, which would affect the valuation of the market as a whole, would serve as “shocks” causing investors to adjust prices to a new level, reflecting that new information. One would see these reactions in real time, and investigators of market history would face no difficulties in identifying precisely what new information caused the change in prices. …

This is a simple idea and simple to test. But almost no one ever bothers to test it. According to the mindset of conventional economists, no one needs to test it; it just feels right; it must be right. It’s the only model anyone can think of. But socionomists [those who use the Wave Principle to make social predictions] have tested this idea multiple ways. And the result is not pretty for the theories that rely upon it.

The tests that we will examine are not rigorous or statistical. Our time and resources are limited. But in refuting a theory, extreme rigor is unnecessary. If someone says, “All leaves are green,” all one need do is show him a red one to refute the claim. I hope when we are done with our brief survey, you will see that the ubiquitous claim we challenge is more akin to economists saying “All leaves are made of iron.” We will be unable to find a single example from nature that fits.

* * *

In his February 2010 Elliott Wave Theorist, Prechter then goes on to show charts that examine each of these claims that encompass both economic and political events:

Claim #1: “Interest rates drive stock prices.”
Claim #2: “Rising oil prices are bearish for stocks.”
Claim #3: “An expanding trade deficit is bad for a nation’s economy and therefore bearish for stock prices.”
Claim #4: “Earnings drive stock prices.”
Claim #5: “GDP drives stock prices.”
Claim #6: “Wars are bullish/bearish for stock prices.”
Claim #7: “Peace is bullish for stocks.”
Claim #8: “Terrorist attacks would cause the stock market to drop.”

To protect your personal finances, it’s important to think independently from the crowd, particularly when the crowd buys into what economists say.

Find out what really moves markets — download the free 118-page Independent Investor eBook. The Independent Investor eBook shows you exactly what moves markets and what doesn’t. You might be surprised to discover it’s not the Fed or “surprise” news events. Learn more, and download your free ebook here.


Susan C. Walker writes for Elliott Wave International, a market forecasting and technical analysis company.

GBP/JPY Reversal in the Works

By Anton Eljwizat – The GBP/JPY has recorded much bearish behavior in the past 2 weeks. However, the technical data indicates that this trend may reverse anytime soon. For example as described below, the daily chart’s signals that a bullish reversal is imminent. This might be a good opportunity for forex traders to enter the trend at a very early stage and at a great entry price.

• Below is the daily chart of the GBP/JPY currency pair.

• The technical indicators that are used are the William Percent Range, Relative Strength Index (RSI), and Slow Stochastic.

• Point 1: There is a “doji” candlestick that has formed on the chart, indicating that a reversal should take place.

• Point 2: The Relative Strength Index (RSI) indicates that the price of this cross currently floats in the oversold territory, signaling upward pressure.

• Point 3: The Williams Percent Range has peaked below the -80 marker, which means that there may actually be a strong level of upward pressure.

• Point 4: The Slow Stochastic indicates a bullish cross, signaling that the next move may be in an upward direction.

GBP/JPY Daily Chart

Forex Market Analysis provided by Forex Yard.

© 2006 by FxYard Ltd

Disclaimer: Trading Foreign Exchange carries a high level of risk and may not be suitable for all investors. There is a possibility that you could sustain a loss of all of your investment and therefore you should not invest money that you cannot afford to lose. You should be aware of all the risks associated with Foreign Exchange trading.

Swedish GDP Shows a Return to Recession in Q4

By Greg Holden – Following the release of Sweden’s recessionary data, the Swedish Krona (SEK) took a sharp dive against its primary counterparts. The data revealed that Sweden actually slipped back into recession during the fourth quarter of 2009.

A 0.6% decline in fourth quarter GDP put selling pressure on the Swedish Krona in this week’s trading. Expectations were for a 0.3% rise in GDP. As a result, the SEK now trades at the 7.1845 level against the USD, and the 9.7870 level versus the EUR.

The Norwegian Krone (NOK) has also been unable to hold its recent gains made against the Dollar and Euro. Paring gains this week, the NOK has recently entered a small downturn due to a downward price movement in Crude Oil.

The Norwegian Finance Ministry also published its decision to grant further flexibility in rulings on the ban of investment companies, helping more investment firms stay in positive standing before being decommissioned by government regulators.

Technical Analysis

– The chart below is the 4-hour USD/NOK chart by ForexYard.

– The indicators used are the Stochastic (slow) and the Williams Percent Range.

– This pair is currently forming a “Pennant” on the chart. This happens when a solid upward movement is halted by a narrowing range, as shown below.

– Typically, when a Pennant formation reaches the narrowest point, represented by the number 1 on the chart below, a continuation of the previous trend will likely continue. This means the pair may continue to range-trade towards Point 1, and then continue with its previous uptrend.

– Point 2: Since the price is currently at the lower border of the consolidation trend (Pennant formation), there is a bullish cross on the Stochastic (slow) which indicates an upward move should take place in the nearest future, and you can see on the chart that this is already taking place.

– Point 3: The Williams Percent Range shows that the price touched the over-sold mark and then bounced off and is currently heading up. This only highlights a level of bullish momentum that is already building in the price of this pair.

USD/NOK 4-Hour Chart

Forex Market Analysis provided by Forex Yard.

© 2006 by FxYard Ltd

Disclaimer: Trading Foreign Exchange carries a high level of risk and may not be suitable for all investors. There is a possibility that you could sustain a loss of all of your investment and therefore you should not invest money that you cannot afford to lose. You should be aware of all the risks associated with Foreign Exchange trading.

EUR Recovers Slightly as Greece’s Budget Woes Ease

Source: ForexYard

The USD fell Tuesday versus the EUR on comments from Greek officials regarding the government’s commitment to make major budget cuts necessary to reduce the deficit. Pressuring the Dollar further were hawkish statements regarding interest rate hikes from the Canadian and Australian central banks.

Economic News

USD – USD Declines on Interest Rate Hike Outlook

The USD came under pressure yesterday as Greece is expected to announce new budget cuts. The greenback was down most notably against the CAD and AUD on interest rate hike outlook for the two currencies. The Reserve Bank of Australia (RBA) raised its benchmark rate for the fourth time, as expected, by a quarter of a percentage point, to 4.0% and, while the Bank of Canada left the interest rate unchanged, an exceptionally hawkish statement boosted expectations of a sooner than expected rate hike.

The Dollar index fell to 80.512, from 80.753 in late North American trading Monday. The Aussie recently rose 0.4% to 90.36 U.S. cents. The Dollar slid 0.5% against the Japanese Yen, to buy 88.77 Yen.

Looking ahead to today traders are advised to follow the ISM Non-Manufacturing PMI report due to be released at 15:00 GMT as well as the ADP Non-Farm Employment Change estimate due to be released at 13:15 GMT. The Dollar’s level will be determined this week by Greek developments on the one hand and vital economic data from the U.S on the other.

EUR – EUR Rises on Expected Greek Budget Cuts

The EUR rose from a 9-month low against the Dollar as Greece prepared to unveil its new budget cuts, fueling optimism of an imminent solution to its debt crisis. The Greek government will announce as much as 4.8 billion Euros ($6.5 Billion) of additional spending cuts today ahead of a March 16 deadline.

The EUR climbed to $1.3633 in today’s early trading from $1.3615 in New York yesterday when it dropped to $1.3436, the weakest since May 18. The currency traded at 120.82 yen from 120.96 yen. The British pound recovered some losses yesterday to currently trade at 1.5052 USD. It had fallen sharply Monday amid concerns over potential changes in leadership.

Along with any development from Greece, traders are advised to follow the release of the British Services PMI at 9:30 GMT, a better than expected result might help push the Pound further up.

JPY – JPY at 11-Week High versus USD

The Yen climbed to an 11-week high against the Dollar on speculation Japanese companies will bring home earnings before the nation’s fiscal year that ends this month. Japan’s currency advanced versus 14 of its 16 major counterparts ahead of the end of Japan’s fiscal year March 31.

Under the new tax provisions Japanese companies are exempt from taxes on repatriated profits. The means that the JPY is expected to stay strong as Japanese investors will likely to continue buying the currency.

Crude Oil – Crude Oil Struggles to Stay above $80 a Barrel

Crude Oil traded near $80 a barrel, gaining 1.3% yesterday as equity markets gained on speculation that the European Union will bail out Greece while the nation is expected to unveil new budget cuts. Oil prices also increased as the Dollar weakened against the EUR, increasing demand for commodities as an alternative investment. Furthermore, a report form the American Petroleum Institute showed that stockpiles of distillate fuel dropped 4.07 million barrels last week.

Today traders should follow the release of the Crude Oil inventories data at 15:30 GMT. Stockpiles are expected to drop to 1.4M from 3.0M last week, a better than expected result might help solidify oil’s price above $80 a barrel.

Technical News

EUR/USD

After this morning’s upward movement, the EUR/USD pair now appears poised for a downward correction. The pair appears to be range trading between 1.3650 and 1.3450. The hourly RSI shows the price as over-bought and the 4-hour Stochastic (slow) has what appears to be a bearish cross. Going short may be today’s best tactic.

GBP/USD

The price of this pair appears to be floating in the over-bought territory on the hourly RSI, suggesting short-term downward pressure. However, the daily RSI has the pair floating deep within the over-sold territory, indicating that the pair may in fact be facing strong upward pressure. As a result, there is a chance this pair will correct downward slightly in the morning hours, but longer-term direction may in fact be upward.

USD/JPY

This pair has dropped to an 11-week low today and as a result a few indications are pointing to an upward correction. The daily Stochastic (slow) shows a fresh bullish cross and an upward moving indicator, suggesting that the price of this pair may see upward momentum gaining in today’s trading. Going long with tight stops might not be a bad idea.

USD/CHF

This pair seems to be fluctuating within a very distinct bullish channel on the 4-hour chart. As the last movement was in a downward direction, most indicators are now showing an impending bullish move. The 4-hour Stochastic (slow) shows a fresh bullish cross, which supports this notion. Going long appears to be today’s preferable strategy.

The Wild Card

AUD/NZD

This pair is showing very distinct indications for forex traders to take advantage of in today’s trading. The 4-hour Stochastic (slow) is showing 2 recent bearish crosses, and the price on the 4-hour RSI is floating deep within the over-bought territory. The daily chart also shows the price in the over-bought zone. There appears to be strong downward pressure on this pair. Going short and riding out this correction could prove to be very profitable today.

Forex Market Analysis provided by Forex Yard.

© 2006 by FxYard Ltd

Disclaimer: Trading Foreign Exchange carries a high level of risk and may not be suitable for all investors. There is a possibility that you could sustain a loss of all of your investment and therefore you should not invest money that you cannot afford to lose. You should be aware of all the risks associated with Foreign Exchange trading.

Forex Daily Market Review for 3rd Mar, 10

The U.S market continued to gain strength yesterday after Monday’s massive rally. The S&P500 finished the day with a 0.23% gain, while the Nasdaq finished higher by 0.32%.Even though it was a positive session, investors were reluctant to drive the markets significantly higher, as participants preferred to adjust their portfolios for Thursday and Friday’s sessions.

Although the U.S lacked major market moving data yesterday, individual stocks still had an influence on the session. Similar to Toyota, General Motors also joined the list of automakers that are forced to now recall their cars. According to the Toronto Star, General Motors said that more than 256000 Canadian vehicles are included in a fix in a recall to fix power steering motors for several compact models.

As mentioned in prior reports, from a technical point of view the indices seem to be heading towards their prior highs. The S&P500 broke major resistance and confirmed the break out during yesterday’s session. Even though a pull-back is due for this chart, one could expect prior resistance to act as support.

13

Forex

On the Forex market the Dollar index presented relative weakness and finished the session down by -0.3%. The index has recently formed a minor range, between 80.1-81.1 points. Even though indicators are pointing towards a minor correction, the pull-back could be short-lived, especially as the Dollar has recently shown a positive correlation with the U.S stock market. For further information see yesterday’s report.

On individual pairs the EUR/USD managed to hold its ground around 1.3570. Monday’s news had a positive effect on sentiment as the EU unemployment rate beat analyst’s double digit expectation and came out at 9.9%. According to the EU’S statistics office, around 15.7 million people were unemployed in the euro-zone, up 136,000 on the previous month. Spain was a major drag, this time round, coming out with an 18.8% unemployment rate. Yesterday’s fundamental data also from the Euro-zone also had an effect on sentiment as inflation figures showed that prices were lower than expected. This boosted confidence, regarding the ECB’s upcoming decision and should give the bank one less thing to worry about.

On the other side of the globe, Australia shocked the markets by raising its key rate to 4%. Governor Stevens addressed the markets Tuesday and stated that the rate hike was necessary to normalize Australia’s rate level and bring it “closer to average”. Market participants brushed of the news, causing only minor movement on the AUD/USD. From a technical point of view, the AUD/USD bounced higher but got stuck around resistance of $0.9043.

Canada also took the stage during the session releasing its interest rate decision. Unlike Australia, the BOC preferred to keep rates at a low of 0.25%, keeping its promise – holding rates at a low until the end of the second quarter. Even though bank members acknowledged a recent economic improvement, they were reluctant to tamper with the regaining confidence. The USD/CAD dropped during the session and now seems to be heading for its double bottom support level.

25

The Day Ahead

Things should start to pick up over the next couple of trading days as major data is scheduled to be released. Today the U.S will take the stage, releasing its ADP Non-farm Employment Change. The figure is normally scrutinized by investors as it can give clues as to the outcome of the NFP result, scheduled to be released on Friday. The market is expecting a -10k result compared to a prior -22k.

Daily Forex Market Analysis provided by eToro

Disclaimer: Trading in the Foreign Exchange market might carry potential rewards, but also potential risks. You must be aware of the risks and are willing to accept them in order to trade in the foreign exchange market. Don’t trade with money you can’t afford to lose.

© 2009 eToro Blog.

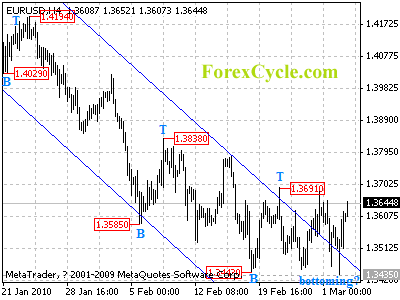
EURUSD bounced from 1.3435

After touching 1.3443 previous low, EURUSD bounced from 1.3435, suggesting that a short term cycle bottom is being formed on 4-hour chart. Further rise to test 1.3691 is expected later today, a break above this level will confirm the cycle bottom, then further rally could be seen to 1.3750-1.3800 area. However. The price action from 1.3443 is still treated as consolidation of downtrend from 1.4579, one more fall towards 1.3300 is still possible after consolidation.

eurusd

Written by ForexCycle.com

Forex Daily Market Commentary

By GCI Forex Research

Fundamental Outlook at 1500 GMT (EDT + 0500)

The euro appreciated vis-à-vis the U.S. dollar today as the single currency tested offers around the US$ 1.3620 level and was supported around the $1.3440 level.  Traders continue to express optimism that meetings between Greek officials and German officials this week will be productive and result in some sort of financial asssitance package for Greece.  Ahead of this week’s meeting, Greece announced today that it is pursuing another €6.5 billion in deficit cuts.  Greece is expected to float up to €5 billion in new 10-year bonds over the next week or two to help finance its massive budget deficit that topped out above 12% of gross domestic product in 2009.  One possible financial rescue scenario has some eurozone member countries purchasing Greek bonds to support the beleaguered country.  In addition to Greece, other eurozone countries continue to face difficult fiscal challenges including Spain, Portugal, and Ireland.  Data released in the eurozone today saw EMU-16 February producer prices climb 0.7% m/m and fall 1.0% y/y while February consumer prices were off 0.9% y/y.  Interest rates were back in focus today as Bank of Canada kept its main overnight rate unchanged at 0.25% and Reserve Bank of Australia lifted its main rate by 0.25%.  The European Central Bank is expected to keep its main refinancing rate unchanged at 1.00% for the foreseeable future.  The ECB will discuss on Thursday the idea of lending covered bonds to banks for a fee.  In U.S. news, Kansas City Fed President Hoenig made news today when he vociferously defended the need to maintain the Fed’s policymaking and supervisory independence.  Hoenig also said the Fed should begin to raise interest rates even with high unemployment.  Minneapolis Fed President Kocherlakota said there is a risk that smaller U.S. banks could precipitate the next financial crisis, adding their exposure to commercial real estate “may be exerting a significant drag on the overall economic recovery.”  Euro bids are cited around the US$ 1.3335 level.

¥/ CNY

The yen appreciated vis-à-vis the U.S. dollar today as the greenback tested bids around the ¥88.90 level and was capped around the ¥89.35 level. The verbal skirmish between Bank of Japan and the government continued with the latter saying it will not seek a change in law to permit the former to purchase new Japanese government bonds.  Yesterday, financial services minister Kamei called on the BoJ to directly purchase JGBs to financial stimulus spending.  Finance minister Kan today tempered Kamei’s remarks saying “We have to rebuild the economy, which requires spending, but we don’t have the financial reserves and if we issue bonds, that will push yields up. We have to tread a very narrow path.”  BoJ Governor Shirakawa has recently increased his anti-deflation rhetoric but has also suggested deflation is not purely a monetary phenomenon, adding a lack of final private demand is contributing to lower prices.  The central bank purchases ¥1.8 trillion if Japanese government securities every month and Kan continues to call on the central bank to take “appropriate action.”  Additionally, Kan yesterday indicated he hopes deflation will end by the end of the year whereas current BoJ forecasts have deflation continuing through at least the second half of 2011.  Data released in Japan today saw the January unemployment rate decline to 4.9%.  The Nikkei 225 stock index climbed 0.49% to close at ¥10,221.84.  U.S. dollar offers are cited around the ¥94.75 level.  The euro moved lower vis-à-vis the yen as the single currency tested bids around the ¥119.75 level and was capped around the ¥121.30 level.  The British pound moved lower vis-à-vis the yen as sterling tested bids around the ¥132.50 level while the Swiss franc moved lower vis-à-vis the yen and tested bids around the ¥81.85 level. In Chinese news, the U.S. dollar appreciated vis-à-vis the Chinese yuan as the greenback closed at CNY 6.8266 in the over-the-counter market, up from CNY 6.8263.  China is expected to continue raising its reserve ration as shorter-term bills expire.  One recent study published in the U.S. suggests China will face a significant debt crisis in 2012 on account of regional and local borrowing activities.  Data released in China yesterday saw February manufacturing PMI decline go 52.0 from 55.8, considerably weaker-than-expected.  Revised U.S. TICS data released on Friday confirmed China is the largest holder of U.S. Treasuries. Foreign holdings of U.S. debt now total US$ 2.7 trillion in aggregate.

The British pound weakened vis-à-vis the U.S. dollar today as cable tested bids around the US$ 1.4855 level and was capped around the $1.4995 level.  Cable again moved lower as traders reacted to strong-than-expected U.K. GDP data that were released on Friday.  One theory suggests Prime Minister Brown may take advantage of the stronger-than-expected GDP data by calling a general election earlier than previously expected.  Sterling is lower on the premise that the U.K. could have its first minority government in decades. The opposition Tory party is largely expected to assume more after more than one decade of Labour rule.  Data released in the U.K. today saw February PMI construction decrease slightly to 48.5 from 48.6 in January.  Cable bids are cited around the US$ 1.4455 level.  The euro moved higher vis-à-vis the British pound as the single currency tested offers around the ₤0.9090 level and was supported around the ₤0.9015 level.

Forex Daily Market Commentary provided by GCI Financial Ltd.

GCI Financial Ltd (”GCI”) is a regulated securities and commodities trading firm, specializing in online Foreign Exchange (”Forex”) brokerage. GCI executes billions of dollars per month in foreign exchange transactions alone. In addition to Forex, GCI is a primary market maker in Contracts for Difference (”CFDs”) on shares, indices and futures, and offers one of the fastest growing online CFD trading services. GCI has over 10,000 clients worldwide, including individual traders, institutions, and money managers. GCI provides an advanced, secure, and comprehensive online trading system. Client funds are insured and held in a separate customer account. In addition, GCI Financial Ltd maintains Net Capital in excess of minimum regulatory requirements.

DISCLAIMER: GCI’s Daily Market Commentary is provided for informational purposes only. The information contained in these reports is gathered from reputable news sources and is not intended to be U.S.ed as investment advice. GCI assumes no responsibility or liability from gains or losses incurred by the information herein contained.

Gold Logs Key Gains

Gold continues to exert a relative strength and has popped past our 3rd tier downtrend line.  Our 3rd tier downtrend line is key since it runs through February highs.  Hence, a test and movement beyond the $1130/oz area could be in the works.  Gold is moving higher once again without the Euro and Pound, which are both mired in fiscal and political uncertainties.  Therefore, it appears gold may become a safe haven in its own right and ignore its negative correlation with the Greenback.  However, we’ll have to continue to monitor the situation to determine whether this becomes a more lasting deviation.  Meanwhile, all is quiet on the data front today with a busy day on deck.  The UK will release HPI and Services PMI data tomorrow followed by U.S. Services PMI and ADP Non-Farm Employment Change figures.  Australia will kick off the day by printing its GDP during the Asia trading session.  Hence, volatility could reignite tomorrow considering all of these data points carry some weight.

Technically speaking, we left our trend lines as is today to give investors a clear picture of gold’s breakout.  That being said, Gold has no foreseeable downtrend lines from present price and faces technical barriers in the form of 2/22 and 1/20 highs.  As for the downside, gold has multiple potential uptrend lines serving as technical cushions along with 3/1 and 2/23 lows.  Additionally, the highly psychological $1100/oz level could serve as a strong technical cushion should it be tested.
Present Price: $1125.85/oz

Resistances: $1125.97/oz, $1128.16/oz, $1130.84/oz, $1134.13/ oz, $1135.82/oz, $1138.73/oz

Supports: $1123.30/oz, $1120.80/oz, $1119.11/oz, $1116.20/oz, $1114.26/oz, $1111.60/oz

Psychological: $1100/oz, $1125/oz, $1150/oz, February highs

(click to enlarge)

Market Commentary provided by Fast Brokers.

Disclaimer: FastBrokers’ market commentary is provided for information purposes only and under no circumstances should be regardedneither as an investment advice nor as a solicitation or an offer to sell/buy any financial product. FastBrokers assumes no responsibility or liability from gains or losses incurred by the information herein contained.

Risk Disclosure: There is a substantial risk of loss in trading futures and foreign exchange. Please carefully review all risk disclosure documents before opening an account as these financial instruments are not appropriate for all investors.

AUD/USD Heads Higher Following RBA Rate Hike

The RBA raised its benchmark rate by another 25 basis points today, signaling confidence in the performance of Australia’s economy despite fiscal uncertainties in Europe and liquidity tightening in China.  In fact, China just reported a sharp decline in bank lending during the month of February, and it will be interesting to see whether this has an impact on Pacific currencies tomorrow as the news sinks in.  Australia will keep the news flow going by printing GDP tomorrow morning.  Considering the RBA raised rates today and expressed confidence in the economy, a strong showing from GDP wouldn’t be surprising.  The Aussie hasn’t enjoyed too much topside momentum from the rate hike, meaning the currency pair could make a sizable move should GDP top estimates.  Meanwhile, it seems the Aussie’s .90 level is continuing to play a psychological role.  However, the currency pair is currently testing our 1st tier downtrend line, which runs through February highs.  Our downtrend lines above are also getting wider, meaning the Aussie has some nice room to the topside should fundamentals and psychological work in the currency’s favor.  Investors will also receive key data releases from the UK and U.S. tomorrow and all eyes will be focused on America’s ADP Non-Farm Employment Change figure.  Additionally, the BoE and ECB have monetary policy meetings on Thursday, implying that volatility could increases as the trading week progresses.

Technically speaking, the Aussie has multiple uptrend lines serving as technical cushions along with intraday, 3/1, and 2/19 lows.  As for the topside, the Aussie has multiple downtrend lines serving as technical barriers along with February highs and the highly psychological .90 level.

Price: .9033

Resistances: .9041, .9057, .9074, .9090, .9103, .9119

Supports: .9025, .9011, .8993, .8981, .8965, .8950

Psychological: .90, February highs and lows

(click to enlarge)

Market Commentary provided by Fast Brokers.

Disclaimer: FastBrokers’ market commentary is provided for information purposes only and under no circumstances should be regardedneither as an investment advice nor as a solicitation or an offer to sell/buy any financial product. FastBrokers assumes no responsibility or liability from gains or losses incurred by the information herein contained.

Risk Disclosure: There is a substantial risk of loss in trading futures and foreign exchange. Please carefully review all risk disclosure documents before opening an account as these financial instruments are not appropriate for all investors.

USD/JPY Continues Consolidation Around 89

The USD/JPY is continuing its consolidation pattern around 89 as the FX markets settle following yesterday’s high volatility in the Cable.  Japan’s Household Spending figure came in almost a full percentage point below analyst expectations and is likely helping buoy the USD/JPY with investors exerting a relative preference for the Dollar.  The U.S. has been quiet on the data front today and this is likely contributing to the FX cool down.  However, volatility could pick back up tomorrow with the U.S. and UK releasing their respective Services PMI data points.  Additionally, the U.S. will print ADP Non-Farm Employment Change data.  Hence, activity should pick up with key data points and central bank meetings on the way.  Japan will print Average Cash Earnings during tomorrow’s Asia trading session and analysts are expecting an improvement to -1.2%.  Australia will likely garner the spotlight by releasing GDP.  Furthermore, it will be interesting to see whether the large decrease in lending by China’s banks during the month of February has an impact on Pacific currencies.  It will be encouraging if the USD/JPY can continue to establish a new base from which to head north for another battle with its highly psychological 90 level.

Technically speaking, the USD/JPY has multiple uptrend lines serving as technical supports along with February lows.  As for the topside, the USD/JPY faces multiple downtrend lines along with March highs and the highly psychological 90 level should it be tested.

Present Price: 89.11

Resistances: 89.19, 89.28, 89.35, 89.41, 89.50

Supports: 89.10, 89.04, 88.93, 88.84, 88.78

Psychological: 90, February lows, March highs

(click to enlarge)

Market Commentary provided by Fast Brokers.

Disclaimer: FastBrokers’ market commentary is provided for information purposes only and under no circumstances should be regardedneither as an investment advice nor as a solicitation or an offer to sell/buy any financial product. FastBrokers assumes no responsibility or liability from gains or losses incurred by the information herein contained.

Risk Disclosure: There is a substantial risk of loss in trading futures and foreign exchange. Please carefully review all risk disclosure documents before opening an account as these financial instruments are not appropriate for all investors.