Forex Market Review: Daily Forex Analysis 31/03/2010

Forex Market Review by Finexo.com

MAJOR HEADLINES – PREVIOUS SESSION
• US Jan. S&P/Case-Shiller House Prices out at -0.7% y/y, as expected, vs. -3.1% prior
• US Mar. Consumer Confidence out at 52.5 vs. 51.0 expected and revised 46.4 prior
• US Weekly ABC Consumer Confidence out at -45 vs. -44 prior
• UK Mar. GfK Consumer Confidence out at -15 vs. -13 expected and -14 prior
• AU Feb. Retail Sales out at -1.4% m/m vs. +0.3% expected and revised 1.1% prior
• AU Feb. Private Sector Credit out at 0.4% m/m, as expected and unchanged from prior
• AU Feb Building Approvals out at -3.3% m/m, +34.2% y/y vs. 2.1%/38.1% expected and revised -5.5%/52.7% prior resp.
• JP Feb. Labour Cash Earnings out at -0.6% y/y vs. -0.1% expected and revised -0.2% prior
• NZ NBNZ Business Confidence out at 42.5 vs. 50.1 prior
• JP Mar. Small Business Confidence out at 45.8 vs. 42.3 prior
• JP Feb. Housing Starts out at -9.3% y/y vs. -1.0% expected and -8.1% prior
• JP Feb. Construction Orders out at -20.3% y/y vs. +15.7% prior
________________________________________

THEMES TO WATCH – UPCOMING SESSION
(All times GMT)
• GE Unemployment (0755)
• EU ECB’s Trichet to speak (0845)
• EU Euro-zone Unemployment (0900)
• Swiss KOF Leading Indicator (0930)
• US MBA Mortgage Applications (1100)
• US ADP Employment Change (1215)
• CA Jan GDP (1230)
• US Chicago PMI (1345)
• US Factory Orders (1400)
• US NAPM – Milwaukee (1400)

Market Comments:

The EUR gave back most of the gains made during the Asian session yesterday with pressure coming from worsening news out of Europe – Ireland’s “Bad Bank” indicating it will apply a discount of 47% vs. 30% initial estimate on blocks of bad loans, Greek bonds trading poorly with tepid demand for the 12-year auction, an IMF downgrade to German growth and a rumoured French ratings downgrade (subsequently denied with Fitch affirming the AAA rating). GBP on the other hand was buoyed by some positive data – Q4 GDP revised higher to 0.4% q/q, current account balance narrowed and Nationwide house prices were a touch firmer. For US markets, data was also on the firm side with US consumer confidence jumping to 52.5 from a revised 46.4 and beating consensus estimates of a rise to 51.0.

The month-/quarter- and Japanese financial year-end were expected to induce some volatility into currency markets on the last trading day of March, but this was only partly evident in the Asian session. The Tokyo morning fix saw heavy demand for the greenback and USDJPY rose to its highest since January 8th. Expect more volatility at the respective fixing times in Europe and the US and most analysts suggesting portfolio-rebalancing trades would be predominantly to sell dollars.
The Australian data was a disappointment and poured some cold water on the hawkish sentiment that had been building since the start of the week. Retail sales fell a surprising 1.4% in February from a month earlier versus consensus estimates of 0.3% growth and could indicate that the recent RBA rate hikes are starting to bite and the Ozzie consumer is adopting a more cautious stance. Building approvals were also softer than expected, falling for the second straight month contrary to market expectations of s rebound. Naturally, AUD fell off its perch above 0.92, though losses in Asia were limited to 50 pips or so. Given that market expectations for an RBA rate hike next week have been scaled back to 60+% from 75% previously, and possibly with more to come, it would appear a tall task for the AUD to regain the heady heights above 0.92.

Fed’s Fisher was on the wires saying that he doubts the current recovery will reverse course and instead sees it gathering momentum into 2010 and predicts growth of 3% this year. That said, he acknowledges that the economy is afflicted by excess capacity, high unemployment and an absence of price pressures.
Looking ahead, data releases in Europe focus on German and Euro-zone unemployment and Swiss KOF leading indicators. The US session sees the US ADP employment change released, the prelude to Friday’s non-farm payroll data, along with Chicago PMI and factory orders. Canada GDP for Jan is the only other release.

Forex Market Review & Analysis by Finexo.com

Disclaimer: Trading the foreign exchange (Forex) carries a high level of risk, and may not be suitable for all investors.


Today’s Forex Market Commentary

By Russell Glaser

The dollar strengthened following positive consumer confidence numbers in the U.S. and negative news for the European financial system.

• Standard & Poor’s sent a warning concerning the Greek banking and its struggles since the outbreak of the Greek financial crisis. Troubles may persist for Greek banks as high borrowing costs weigh on the Greek government.

• Ireland effectively nationalized its banking system by taking over two financial institutions and injecting cash into others.

• The IMF reduced its yearly economic growth estimate for Germany to 1.2% from 1.5%.

• U.S. Consumer Confidence rose to 52.5 on expectations of 50.1.
The EUR/USD could fall today to the support level of 1.3280 if the ADP Non-Farm Employment Change is inline or better than expectations of +40K jobs.

• Australian retail sales fell unexpectedly 1.1% on expectations of a 0.3% increase.

• Weekly crude oil inventory data is due to be released today at 15:30. Expectations are for a rise of 2.4M. The price target for spot crude oil is $83.00.

Forex Market Analysis provided by Forex Yard.

© 2006 by FxYard Ltd

Disclaimer: Trading Foreign Exchange carries a high level of risk and may not be suitable for all investors. There is a possibility that you could sustain a loss of all of your investment and therefore you should not invest money that you cannot afford to lose. You should be aware of all the risks associated with Foreign Exchange trading.
Euro Trading Lower on Financial System Worries, Positive U.S. Consumer Confidence

Source: Forex Yard

The Dollar rose versus the EUR, but was mixed in the other major crosses after renewed concerns over the European banking system weighed on the EUR and other riskier, higher yielding currencies.

Economic News

USD – Higher U.S. Consumer Confidence Boosts the Dollar

The greenback rose versus the EUR but was mixed against the majors during the New York trading session, reclaiming most of the ground it lost to the EUR after the release of the Greek bailout package. Triggering the rising Dollar was a warning by Standard & Poor’s that the weak Greek banking system has been damaged by the fiscal crisis the country is experiencing.

The EUR/USD is currently trading lower at 1.3400 after opening the day at 1.3487, while the GBP/USD was higher at 1.5070, following an opening day price of 1.4997. The USD/JPY was at 93.25 from 92.17.

The Dollar was also supported by better than expected consumer confidence numbers. U.S. CB Consumer Confidence was released with an output of 52.5, far above economists’ expectations of 50.1. This leads economists and traders to believe that the U.S. economy may begin to pick up steam in the near term, recovering faster than its European counterpart.

Today’s trading should be largely driven by economic data set to be released. The highlight will be the release of the ADP Non-Farm Employment Change. The report is set to be released at 13:15 GMT with expectations of an additional 40K jobs to the U.S. economy. A release on par with market expectations or one that exceeds the forecast could push the EUR/USD lower to its previous low at 1.3266.

EUR – Banking Fears Weigh on the Euro

The EUR slumped following a brief recovery in the 16-nation currency. Weakening the EUR was not only the warning from S&P concerning the health of the Greek banking system, but also a decision by Ireland to inject billions of euros into the ailing Irish banking system and a reduced growth forecast by the International Monetary Fund (IMF) for Germany.

The plan to aid the struggling Irish banking system, dubbed by the Irish press as Bailout Tuesday, the Irish government would seize two banking institutions, inject funds into struggling banks and take control of troubled assets at other lenders. Irish finance experts have called this the nationalization of the Irish banking system. In total, 8B euros will be used to support Irish banks. This does not include another 2.7B euro private investment that will be needed to bring Irish banks up to their needed capitalization standards.

Adding to Europe’s woes was a reduced forecast for German economic growth by the IMF. The forecast was dropped to 1.2% from 1.5%.

Interestingly enough, it appears the U.S. is putting more distance between itself and Europe as the major U.S. banking institutions are recovering and returning to profitability while European financial institutions continue to require fresh government aid. This may be reflected in the recent loss of value in the EUR.

JPY – Australian Retail Sales Disappoint, dropping the AUD/USD

The Australian Dollar weakened in the early morning hours of the trading day after the release of Australian economic data failed to meet market expectations. Retail sales for the month of February disappointed traders with numbers coming in at -1.4% on expectations of a rise of 0.3%. This sent the AUD/USD to a low of 0.9144 from an opening day price of 0.9187.

The unexpected drop in retail sales may be a signal that the recent interest rate increases by the Reserve Bank of Australia are beginning to cool the Australian economy. The overnight cash rate was increased by 25 basis points to 4% this past month.

Consumer spending makes up roughly one half of the Australian economy. Therefore, the sudden plunge in retail sales may be enough to convince the Reserve Bank of Australia to keep interest rates at their current level when the policy board meets next week. This should have a weakening affect on the Australian Dollar. The next major support level for the AUD/USD rests at 0.9000.

Crude Oil – Spot Crude Oil Trading Rises

Spot Crude Oil traded higher for the second consecutive day after better than expected consumer confidence numbers, though the gains in spot Crude Oil prices were held in check by a stronger Dollar. The rising prices are prior to the release of the weekly Crude Oil inventory reports.

Spot Crud Oil prices finished the day higher at $82.36 following an opening day price of 82.18. This follows the 3% price rise during Monday’s trading.

Traders were being cautious after Monday’s $1.70 jump in the price of spot Crude Oil, wondering if the price move was based only on technical movements or a shift in the fundamentals of the commodity. The price broke a short term resistance line of $81.50, though the $83 price level still holds for the long term resistance.

Today the market will be expecting the weekly Crude Oil inventories report from the U.S. Energy Information Agency and could either extend the gains in the commodity or drop the price towards its lower support levels. Economists are expecting Crude Oil inventories to rise 2.4M barrels following last week’s 7.3M barrel increase. An output below the 2.4M estimate could be a positive for spot Crude Oil prices and may help extend the bullish rally to the $83 resistance level by the end of the trading day.

Technical News

EUR/USD

The 2 hour and daily RSI are floating near the oversold territory indicating an impending upward movement. A bullish cross is evident on the 4 hour chart’s Slow Stochastic. Going long for the day may be advised.

GBP/USD

The 2 hour and 4 hour RSI is floating in the overbought territory indicating an imminent downward movement. Furthermore, a bearish cross is evident on the 8 hour chart. Going short for the day may be a good option.

USD/JPY

The 2 hour, 4 hour and daily RSI are floating in the overbought territory, while a bearish cross is evident on the hourly, 4 hour and daily charts’ Slow Stochastic. Furthermore a breach of the upper Bollinger Band is evident on the 2 hour, 4 hour and daily charts. Going short for the day may be advised.

USD/CHF

The pair’s indicators seem to be floating in neutral territory with the pair range trading between 1.0650 and 1.0690, however, a bearish cross is evident on the 4 hour chart’s Slow Stochastic and the 2 hour chart’s RSI is floating near the overbought territory. Going short with tight stops may be advised for today.

The Wild Card

AUD/JPY

A breach of the upper Bollinger Band is evident on the daily chart with the 2 hour, 4 hour, 8 hour and daily RSI are floating in the overbought territory. A bearish cross is evident on the 8 hour and daily charts’ Slow Stochastic. Forex traders may be advised to go short for today.

Forex Market Analysis provided by Forex Yard.

© 2006 by FxYard Ltd

Disclaimer: Trading Foreign Exchange carries a high level of risk and may not be suitable for all investors. There is a possibility that you could sustain a loss of all of your investment and therefore you should not invest money that you cannot afford to lose. You should be aware of all the risks associated with Foreign Exchange trading.

Your Cheatin’ Chart Will Tell On You

How the Dow Has Really Performed When Measured in Real Money (Gold)

By Elliott Wave International

“Your cheating chart will tell on you.”

Hank Williams may not have known about Elliott waves, but he did know when a story doesn’t add up.

Such is the case with the nominal rise of the Dow Jones Industrials from 2000 to 2007. In the language of country music, this stock index has a “Cheatin’ Chart” — it doesn’t tell the real story.

Download Robert Prechter’s FREE 40-Page Gold and Silver eBook. This valuable ebook explores the role of gold in today’s markets like no other resource has attempted. You will get more than Prechter’s long-term outlook on gold and silver; you’ll also learn how gold still plays an important role in determining the real value behind nominal share prices. Learn more, and download your Gold and Silver eBook here.

You don’t have to tell Bob Prechter this: He knows. A simple price chart of the Dow is, well, a bit too simple. First Bob explains that pricing via fiat currency is not the same as pricing the Dow in terms of real money (namely gold). Then he shows the difference.

For six long years, we’ve had declining real values in stocks. Since the 2002 bottom, we’ve had rising values in nominal terms. This is the same set-up that we saw in the early ’70s except for one thing: it’s bigger. . .Ultimately, real prices are leading dollar prices, and we’re going to see a tremendous drop in the dollar price of the Dow as well, because I’m making a case that this is a much bigger top.
Elliott Wave Theorist, December 2006

nominal dow follows the lead of real dow

If gold were our money, the major stock market indexes would have declined relentlessly from 2000 to the present, with a muted bounce in 2003. There would be no arguing the point of whether a bull or bear market was in force.
Elliott Wave Theorist, March 2006

This “oh-so-true” chart of the DJIA priced in gold showed the path that the “cheatin'” nominal Dow would eventually follow. Our forecast was that it’s just a matter of time. This analysis has played out as expected several times since the 1999 high in the Dow Jones Industrials.

The July 1999 top in the real Dow was the first in a long succession of rolling blow-offs that (The Elliott Wave Financial Forecast) successfully identified From the DJIA’s orthodox top in 2000 to the NASDAQ’s all-time high several weeks later to the top in residential real estate prices in 2005 to the nominal peaks in major stock indexes in 2007 to the wild commodity spikes in 2008, EWFF managed to anticipate many of the markets major trend changes. . .We owe these forecasting successes to the Wave Principle and its reflection of market psychology and its foreshadowing of larger social forces.
Elliott Wave Financial Forecast, July 2009

The monthly Elliott Wave Financial Forecast keeps a tireless eye on stocks, real estate, commodities and much more. We also keep track of the precious metals and the dollar — and even keep our finger on the pulse of developing social trends.

The quotes above confirm the power of Elliott wave analysis in identifying market turns in various asset classes.

Download Robert Prechter’s FREE 40-Page Gold and Silver eBook. This valuable ebook explores the role of gold in today’s markets like no other resource has attempted. You will get more than Prechter’s long-term outlook on gold and silver; you’ll also learn how gold still plays an important role in determining the real value behind nominal share prices. Learn more, and download your Gold and Silver eBook here.

Elliott Wave International (EWI) is the world’s largest market forecasting firm. EWI’s 20-plus analysts provide around-the-clock forecasts of every major market in the world via the internet and proprietary web systems like Reuters and Bloomberg. EWI’s educational services include conferences, workshops, webinars, video tapes, special reports, books and one of the internet’s richest free content programs, Club EWI.

FOREX: Euro-Dollar declines to trade near 1.3420

By CountingPips.com

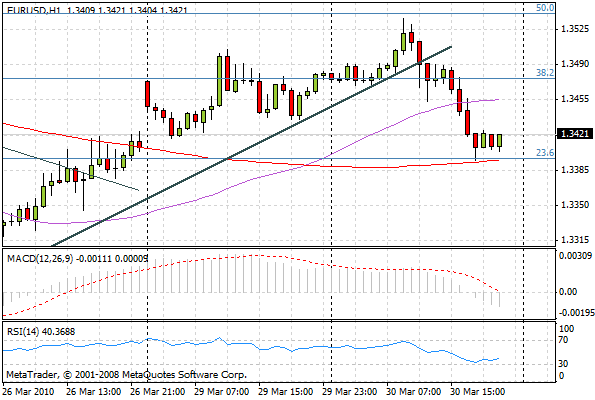
The U.S. dollar has traded higher against the euro today in forex trading after starting the day in the red against the European common currency. The Euro (EUR/USD pair) has fallen by approximately 65 pips today versus the dollar to FOREX: Euro Dollarfall below the 1.3450 level in the U.S. session after opening the day (00:00GMT) at the 1.3489 level. Earlier today, the EUR/USD advanced to an intraday high of 1.3537 at 06:00 GMT before reversing course. The EUR/USD had been on a bullish path since Friday after the European Union agreed on a plan to provide monetary support for Greece through EU and IMF loans.

EUR/USD Chart – The Euro today falling lower against the US dollar on the 1-hour chart. The pair reversed course today near the 50.0 fibonacci retracement level (on the down move from 1.3817 to 1.3267 that started on March 17th) and broke through the supportive trendline of the past few days near 1.3490. The pair found support around the 23.6 retracement level at 1.3394 and currently trades around 1.3420.

Forex EUR/USD

Consumer Confidence increases in March Survey. US House Prices edge higher.

By CountingPips.com

Consumer confidence rose more than expected in March after decrease in February, according to a report released today by the Conference Board, which produces the Consumer Confidence Index. In a survey of 5,000 households, the index showed that consumer confidence increased by 6.1 points from 46.4 in February to a standing at 52.5 in March. The Expectations index also rose in March to 70.2 from 62.9 in February while the Present Situation index advanced from 21.7 in February to 26.0 in March.

Market forecasts were expecting consumer confidence to rise to a 51.0 score for the month.

The Director of the Conference Board Consumer Research Center Lynn Franco talked about the newest survey saying, “Consumer confidence, which had declined sharply in February, managed to recoup most of the loss in March. However, despite this month’s increase, consumers continue to express concern about current business and labor market conditions. And, their outlook for the next six months is still rather pessimistic. Overall, consumer confidence levels have not changed significantly since last spring.”

U.S. house prices see small gain in January

Home prices in the U.S. improved in January to show a small increase for the eighth straight month, according to the Standard & Poors/Case-Shiller Home Price Index released today. The S & P’s/Case-Shiller Index measures sales prices of existing single-family homes in major cities nationally. The report showed that the 20-city composite index increased by 0.3 percent in January on seasonally adjusted basis after a similar 0.3 percent increase in December. On an annual basis, the 20-city composite fell by 0.7 percent in January from the January 2009 level.

David M. Blitzer, Chairman of the Index Committee at Standard & Poor’s, commented on the report saying, “The report is mixed. While we continue to see improvements in the year-over-year data for all 20 cities, the rebound in housing prices seen last fall is fading. Fewer cities experienced month-to-month gains in January than in December 2009, on both a seasonally adjusted and unadjusted basis.”

Los Angeles and San Diege led the unadjusted price gains in January with rise of 0.9 percent and 0.4 percent, respectively. Portland (-1.8%), Seattle (-1.7%) and Chicago (-1.7%) saw the largest price declines in January.

On an annual basis, San Francisco house prices have increased the most since January 2009 with a 9.0 percent advance with San Diego coming in next with a 5.9 percent rise. On the downside, Las Vegas remained the only area with a double digit annual decline at -17.9 percent annually while Detroit and Tampa were next in line with declines of 7.4 percent each.

Gold Trading: Why gold will not make new highs or lows this year

By Adam Hewison – Gold has had some dramatic moves in the last eighteen months and we expect it will have some equally dramatic moves in the future, but not right now.

Watch the New Video Now…

While I recognize that gold is one of the few commodity markets that people are really passionate about; the purpose of this article is not to take sides either with the gold bugs or those who reject the argument that gold is forever.  Rather, I want to discuss my interpretation of the markets cycle.

After spot gold made an all-time high against the dollar on December 2 at $1,226.37, gold has been in retreat mode. For the for the past several months gold has been in a broad trading range, seemingly unable to move one way or another. This process has created frustration from bulls and bears alike.

Here is the dirty little secret about the gold market. It can be a horrible investment and here’s why:

Gold first started trading in the 80s while I was on the floor of the Chicago Mercantile Exchange in Chicago as a member of the International Monetary Market, (IMM) which was at that time a division of the CME now the CME Group.  When gold opened up the public clamored to buy into the gold futures market and guess who sold it to them? Thats right it was the pros- the guys who made their living trading. As a result, gold hit an all-time high of around $850 an ounce back then and it took almost 25 years for gold to move over that level, at least in dollar terms. I dont know what your timeline is, but 25 to 30 years is an awful long time to get even again.

So what is really happening in this market?

Everyone is aware of the problems in Europe with Greece, Portugal and a host of yet to be named countries. We all know that the huge amount of money being printed, coupled with the bank failures abroad contribute to the dollars declining value. These events, in conjunction with the American governments actions, also contribute to the devaluation of the dollar. The government claims that this is beneficial to exports, but the bottom line is that the purchasing power of the American dollar continues to erode in world markets.

Based on the declining value of world currency against gold you might ask- why isnt gold trading at $2,000 or even $3,000 an ounce? What is wrong with this market? This is because a great deal of what goes into the gold market is psychological and reacts to cyclic trends driven by both psychological and economic factors.

So what does all this have to do with the price of gold now? It has everything to do with gold and nothing to do with gold.

Here is what I’ve been able to observe in the last several years in gold and seems to be holding true.  It is something that you should pay attention to if you’re interested in the next big move in the gold market.

Before gold can move higher it needs to create what I call an “energy field”.  The most recent energy fields in gold were between May 12, 2006 and September 20, 2007. This 17 month energy field saw gold prices oscillate between a broad trading range bound by $730.08 (upside) and $541.80 (downside).  That energy field produced enough power to propel gold to the new high of $1,012.40 on March 17, 2008. This marked the first time gold exceeded, in dollar terms, the highs set in the early 80s mentioned earlier.

The energy fields I have observed for gold are taking somewhere between 17 and 18 months to complete. If the energy field holds, then the December 3rd 2009 high of $1,226.37 should remain in place for quite some time. If the same cycle remains true then the recent lows that we witnessed, at $1,050, should also remain intact as they represent the 15 to 16 month cycle low.

With the lows in place the next question becomes when is the next cyclical high in gold? Based on the existing cycle, we can expect the next major gold high in 2011.

To summarize: I expect gold to be locked in a broad trading range for the next 12 months bounded by the December 09 highs of 1,226.37 and the lows of $1,050.00. If the gold cycle holds true, we expect that gold tops the $1,226.37 marker by April or May of 2011.

On the on the upside we will also be looking for gold to make a nature cyclic high in October or November of 2011. It’s impossible to predict the future with any degree of accuracy; however when we look at the cycles in gold this reads as a pretty good bet.

No matter what happens we expect gold will offer some great trading opportunities that investors and traders should be able to take advantage of.

Watch the New Gold Video Here…

As I always discuss- in trading one should approach gold or any other market with a game plan and proper money management stops. The key to success in this decade will be an investors willingness to move in and out of asset classes such as gold and be well diversified into more than one asset class. That way you wont be left holding the bag for the next 25 years. Our World Commodity Portfolio is a good example of this approach and one I believe will serve investors well in the coming years.

All the best,
Adam Hewison
President, INO.com
Co-creator, MarketClub

Volatility for Sterling Forecasted Following UK Indicators

Source: Forex Yard

Sterling traders can expect a busy trading day today as the U.K Nationwide HPI and Current Account reports are likely to shake up the market. The reports, scheduled for 06:00 GMT and 08:30 GMT respectively, may provide the Pound with the necessary momentum to make gains on both the U.S. Dollar and Euro.

Economic News

USD – Consumer Confidence Report May Lead to USD Gains

The CB Consumer Confidence Survey, set to be released at 14:00 GMT today, will likely lead to heavy trading among USD pairs. The survey asks 5000 respondents to rate how they perceive the current and future economic climate in the United States. This month’s survey may prove to be more important than others, largely due to the fact that the American unemployment levels are forecasted to improve in the near future. An increase in consumer confidence combined with solid employment figures will likely lead to significant Dollar gains.

Analysts are forecasting a figure of around 50.2 for the Consumer Confidence report. This would mark a pronounced increase over last month’s figure of 46.0, and may signal a real turning point in the U.S. economy. Traders can expect USD to rise against its major counterparts, providing the predictions come true. That being said, an unexpected drop in consumer confidence would likely hurt the Dollar, and could signal a bearish trend for the rest of the week.

Looking further ahead, traders are reminded to pay careful attention to the U.S. Non-Farm Employment Change figure set to be released on Friday. This is one of the most critical U.S. economic indicators, and it consistently creates heavy market volatility.

EUR – European Market Set For Volatile Day

Several British economic indicators are likely to lead to heavy trading in the European Market today. The Nationwide Housing Price Index, (HPI), is a leading indicator of the health of the U.K. housing industry. With the British economy largely sagging over the last few months, a positive result from this report may signal the turning point traders are looking for. Additionally, the Current Accounts report, which indicates the difference in value for imported and exported goods and services, is widely seen as a leading market indicator.

While the HPI is forecasted to show positive gains in the British housing market, the Current Accounts will likely be unchanged from last month. Traders will want to pay attention to both reports, as any positive news out of Europe will likely lead to risk taking among investors. This would likely lead to gains for both the Euro and Pound against the safe haven currencies.

JPY – Number of Indicators Set to Impact Yen Today

While the Yen has been trading with mixed results against its major counterparts as of late, today’s British and American economic reports will likely lead to a more stable direction for the Japanese currency. Providing the British Current Accounts report remains unchanged from last month as forecasted, investors will likely shy away from risk taking. This could boost the safe haven Yen in afternoon trading. This sentiment could be reinforced if the U.S. Consumer Confidence survey comes in line with expectations.

That being said, traders should be warned that any unexpected results from either indicator may cause risk taking, likely leading to the Yen falling. With no significant JPY news events scheduled for today, it appears the Yen will have to rely on external indicators for its direction in trading.

Crude Oil – Crude Prices May Drop Following British Reports

While Crude Oil prices have been fluctuating quite heavily as of late, a decrease in risk sentiment among investors may lead to a prolonged downtrend. Investors are likely to be turned off from risk taking depending on the outcomes of both British reports set to be released today. Additionally, if USD receives a boost due to the Consumer Confidence report, traders are warned that the price of oil may drop.

Of course, any trend that oil takes today may change drastically after Wednesday’s U.S. Crude Oil Inventories report. Traders should be aware that if the inventory comes in below expectations, the price of crude will likely rise in afternoon trading.

Forex Market Analysis provided by Forex Yard.

© 2006 by FxYard Ltd

Disclaimer: Trading Foreign Exchange carries a high level of risk and may not be suitable for all investors. There is a possibility that you could sustain a loss of all of your investment and therefore you should not invest money that you cannot afford to lose. You should be aware of all the risks associated with Foreign Exchange trading.

Fibonacci Techniques for Math Geeks — and Everyone Else, Too

By Editorial Staff

The word Fibonacci (pronounced fib-oh-notch-ee) can draw either blank stares or an enthusiastic response. There’s hardly any in-between ground. But for those who ask how an esoteric mathematical relationship can apply to price charts and trading, here’s a quick lesson. Everyone who uses Elliott wave analysis will sooner or later want to try using Fibo techniques, and Elliott Wave International’s Jeff Kennedy has written about five of them in a Trader’s Classroom column. For an example of why people are so fascinated by Fibonacci, read part of Kennedy’s article here:

* * * * *

How to Apply Fibonacci Math to Real-World Trading
Have you ever given an expensive toy to a small child and watched while the child had less fun playing with the toy than with the box that it came in? In fact, I can remember some of the boxes I played with as a child that became spaceships, time machines or vehicles to use on dinosaur safaris.

In many ways, Fibonacci math is just like the box kids enjoy playing with imaginatively for hours on end. It’s hard to imagine a wrong way to apply Fibonacci ratios or multiples to financial markets, and new ways are being tested every day. Let’s look at just some of the ways I apply Fibonacci math in my own analysis.

Fibonacci Retracements
Financial markets demonstrate an uncanny propensity to reverse at certain Fibonacci levels. The most common Fibonacci ratios I use to forecast retracements are .382, .500 and .618. On occasion, I find .236 and .786 useful, but I prefer to stick with the big three. You can imagine how helpful these can be: Knowing where a corrective move is likely to end often identifies high-probability trade setups (Figures 7-1 and 7-2).

figure 7-1

figure 7-2

Kennedy then goes on to explain Fibonacci extensions, circles, fans and time, using 11 charts to show what he means. Whether or not you are a math geek, you can learn a lot from this six-page introduction to Fibonacci math.

Get Your Fibonacci Techniques Right Here. Jeffrey Kennedy has been using and teaching these techniques for years, and he has written a quick description of five Fibonacci techniques in his Trader’s Classroom column — now available to you for free by signing up as a Club EWI member. Read more about the 6-page report here.

Elliott Wave International (EWI) is the worlds largest market forecasting firm. EWIs 20-plus analysts provide around-the-clock forecasts of every major market in the world via the internet and proprietary web systems like Reuters and Bloomberg. EWIs educational services include conferences, workshops, webinars, video tapes, special reports, books and one of the internets richest free content programs, Club EWI.

FOREX: AUD/USD climbs back over 0.9150

By CountingPips.com

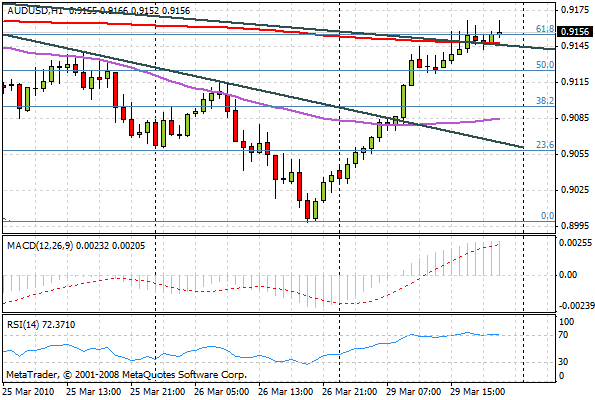
The Australian dollar has climbed back against the US dollar today in forex trading after a down week last week. The Aussie-dollar pair (AUD/USD) has advanced by over 1 percent and approximately 100 pips today in trading to rebound above the 0.9150 level in the U.S. session after opening the day (00:00GMT) at the 0.9048 level. Last week, the AUD/USD decreased by approximately 150 pips as the risk averse trading environment surrounding the Greece Debt situation and concern surrounding the euro helped bring the Aussie lower.

Today’s Aussie increase was supported by comments out of Australia by Reserve Bank of Australia governor Glenn Stevens on interest rates.  Stevens, in a television appearance (comments published in The Australian), said that interest rates shouldn’t be left “down at rock bottom any longer than you need” and that it would not be wise to “assume they will stay that way”. The hawkish tone has prompted immediate speculation of a possible RBA rate hike at the RBA’s April policy meeting.

AUD/USD 1-Hour Chart – The Aussie today accelerating higher against the US dollar from last week’s low of 0.9001 to trading above 0.9150 today. The pair has broken through a couple of recent downward trendlines (in black) and fibonacci retracement levels to trade currently at the 61.8 fibonacci retracement level of the decline from 0.9251 to 0.9001 that started on March 17th.