Robert Prechter on Herding and Markets’ “Irony and Paradox”

By EWI Editorial Staff

The following is an excerpt from a classic issue of Robert Prechter’s Elliott Wave Theorist. For a limited time, you can visit Elliott Wave International to download the rest of the 10-page issue free.

Market Herding
Have you ever watched a dog interact with its owner? The dog repeatedly looks at the owner, taking cues constantly. The owner is the leader, and the dog is a pack animal alert for every cue of what the owner wants it to do. Participants in the stock market are doing something similar. They constantly watch their fellows, alert for every clue of what they will do next. The difference is that there is no leader. The crowd is the perceived leader, but it comprises nothing but followers. When there is no leader to set the course, the herd cues only off itself, making the mood of the herd the only factor directing its actions.

Irony and Paradox
To anyone not versed in socionomics, everything the stock market does is saturated with paradox.

— When T-bills sported double-digit interest rates in 1979-1984, investors saw no reason to abandon their T-bills for stocks; when T-bill rates were low in the 2000s, investors saw no reason to put up with the “low yield” of T-bills and sought capital gains in stocks. The first period was the greatest stock-buying opportunity in two generations, and the second period was the greatest stock-selling opportunity ever.

— When long-term bonds yielded 15 percent in 1981, investors were afraid of Treasury bonds even though they were about to embark on the greatest bull market ever; in December 2008, when the Fed pledged to buy T-bonds, rising prices appeared so strongly guaranteed that the Daily Sentiment Index indicated a record 99 percent bulls, just before prices started to fall.

— When oil was $10.35 a barrel in 1998, no one made a case that the world was running out of black gold; but when it was 7-8 times more expensive, some three dozen books came out arguing that global oil production had peaked, a theme that convinced investors to begin buying oil futures…about a year before the price collapsed 78 percent.

— In the second half of the 1990s, the idea that stocks would always be the best investment “in the long run” became popular just as a long period of superior returns was coming to an ignoble end. A new study… shows that as of today the S&P has underperformed safe, boring Treasury bonds for the past 40 years, since 1969.

— Just when nearly everyone — including world-famous investors — finally panicked and conceded in February-March 2009 that the financial and economic worlds were in dire shape, the market turned around and shot upward in its fastest rally in 76 years.

And so on. The exogenous-cause model fools investors exquisitely. One reason is that rationalization follows upon mood change. Mood change comes first, and attempts at reasoning come afterward. Socionomists recognize that social mood is primary and has consequences in social action, so we never have to wrestle with paradox. This orientation does not mean that we are always right. It means only that we are not doomed to be chronically wrong.

To succeed in the market, you must learn initially to embrace irony and paradox, at least as humans are unconsciously wired to interpret things. Once you get used to the world of socionomic causality, the irony and paradox melt away, and everything makes perfect sense…


Read the rest of this classic Elliott Wave Theorist issue now, free! You’ll get 10 pages of Bob Prechter’s unique insights on:

  • Why Finance and Macroeconomics Are Not Subsets of Economics
  • How Correct Are Economists Who Forecast Macroeconomic Trends?
  • The “Beat the Market” Fallacy
  • Stock-Picking Geniuses or Just a Bull Market?
  • Index Funds and Diversification
  • Market Confidence vs. Certainty
  • Observations on Corporate Earnings
  • Why Being a Bear Doesn’t Equal “Doom & Gloom”
  • More

Visit Elliott Wave International to download your free 10-page issue.
AUD/USD Double-Top Formed; Severe Downturn on the Way?

By Greg Holden – The AUD/USD’s long-lasting bullish channel was finally breached a few weeks back and what we see happening now may be described as the formation of a “double-top,” or “M,” formation on the weekly chart, but on a somewhat minor scale.

A “double-top” formation is when the price moves to a high point, but then corrects downward only to bounce up once more and create a second peak, forming what looks like the letter “M.” Typically when this formation occurs the completion of the second top indicates an impending retracement of the previous trend which brought it to its first peak. A clear example of this can actually be seen in this pair below months prior to today.

In the middle of chart below you can see a “double-bottom” or “W” formation, which is essentially the same thing, but upside down. Notice how it dropped, formed a low point, corrected upward, then dropped to a second low point… and then retraced the entire downward movement that formed the initial low point to bring us to where we are today.

Now the previous “W” formation was an extended and very pronounced formation, which is why I say that this one is a minor version of that. Given the strength of Australia’s economy recently I wouldn’t expect it to retrace the entire movement back down to 0.6000. But a retracement to the next significant level, near 0.8000 wouldn’t be too far fetched, in my opinion.

A few technical points:

Point 1: Here you can see the “double-top” as it is forming.

Point 2: The Relative Strength Index (RSI) seems to show a steadily declining price movement, seeming to suggest that the downward move has built some momentum after breaking its bullish channel.

Point 3: The MACD/OsMA shows a wide-arcing bearish cross, which only strengthens the notion that an impending downward movement may be in the works.

AUD/USD Weekly Chart

Forex Market Analysis provided by Forex Yard.

© 2006 by FxYard Ltd

Disclaimer: Trading Foreign Exchange carries a high level of risk and may not be suitable for all investors. There is a possibility that you could sustain a loss of all of your investment and therefore you should not invest money that you cannot afford to lose. You should be aware of all the risks associated with Foreign Exchange trading.

Dollar Gains from Greece Rescue Plan

Source: ForexYard

The U.S Dollar touched a 7-month high against the EUR Thursday after European leaders indicated they will support Greece, but not necessarily deliver direct aid. The greenback added to gains after the U.S. Labor Department said initial claims for unemployment benefits dropped 43,000 to 440,000 in the last week, a bigger decline than economists had estimated.

Economic News

USD – The U.S. Dollar Rallies after Jobless Claims

The U.S Dollar trimmed losses against the Yen and rose against the EUR the most in three weeks on Thursday after data showed U.S. jobless claims fell over the last week. The number of U.S. workers filing new claims for unemployment benefits fell more than expected, reviving a demand for the U.S currency.

In early sessions the greenback weakened versus 13 of its 16 most-traded peers after the European Commission President said in Brussels that EU officials reached an accord to deal with Greece’s debt crisis. The USD fell against higher-yielding currencies such as the Australian and New Zealand dollars as the European Union reached an agreement to help Greece tackle its budget deficit.

With a number of important data releases expected today, the dollar could experience a fair amount of volatility before the trading week comes to an end. At 13:30 GMT the American economy will publish its retail sales reports, giving investors an idea as to how well the American economy fared last month and whether it is really recovering the way most are expecting. The University of Michigan’s Consumer Sentiment report will also be published at 14:55 GMT.

EUR – EUR Falls on Concern Greece Measures Not Enough

The European currency fell to a new 8-month low, revisiting a low point touched last week, amid concerns that the financial troubles of Greece and other peripheral members of the European Union may withhold growth in the region.

The single currency also dropped against the Japanese yen and British pound after European leaders sought to prop up Greece with words of support at a summit on Thursday, but failed to make concrete pledges. The EUR fell 0.6% against the Yen to 122.78 yen and lost 1.1% vs. Sterling to 87.16 pence.

Europe’s currency is headed for a 5-consecutive-week loss versus the U.S dollar as statements by European leaders left open how the EU would respond to a fresh wave of speculative attacks against the bonds of Greece, or other countries such as Spain and Portugal, which are also struggling to reduce their budget deficits.

In late trading, the EUR was down 0.3% at $1.3680, bouncing off a session low at $1.3596. The EUR climbed as high as $1.3801 earlier, following the EU announcement. Traders are focused on option barriers around $1.3550 and $1.3500, which suggests the EUR could fall near those levels.

JPY – Asian Stocks Climb on Growth Optimism

Asian stocks rose, lifting the MSCI Asia Pacific Index to its first weekly gain in four weeks, as optimism on the global economy overcame concern about Greek finances. Japan’s Nikkei 225 Stock Average advanced 1%, while Hong Kong’s Hang Seng Index rose 0.4%. Japan’s markets were closed for a holiday yesterday, when the MSCI Asia Pacific, excluding the Japan Index, climbed the most since Feb. 3.

The Japanese yen has been the main beneficiary since late last month on increasing worries that the pace of global growth will slow and that problems plaguing Greece may spread to Spain and Portugal. As a result, speculators built record short EUR positions and went long on the JPY, pushing the island currency to recent highs.

Crude Oil – Crude Touches $75 on Greece Aid

The price of Crude Oil rose Thursday, tracking a rebound in commodities and stocks on Wall Street after the European Union pledged to support Greece weather its debt crisis.

Crude Oil prices rose 1% to above $75 a barrel as a plan made by European leaders to support Greece sparked investor interest in riskier assets. However, traders remained concerned about whether the aid would be enough to pull Greece out of fiscal crisis, and the EUR slipped against the U.S. Dollar as a result.

The oil market’s focus on Wall Street and the U.S Dollar may have been due, in part, to a delay in the U.S. weekly inventory data from the Energy Information Administration (EIA), which traders scour for clues on demand in the world’s top oil user. The EIA will release its weekly report on petroleum supplies on Friday, instead of Wednesday.

Technical News

EUR/USD

This pair has been trading in a downtrend since 3 December 2009. After yesterday’s short downturn in late trading, the pair has begun to show a few signs of upward pressure to offset this movement. The daily RSI shows the price just exited the over-sold territory and remains in an upward posture, suggesting upward pressure. Going long might not be a bad idea this morning.

GBP/USD

There appears to be a bearish cross on the 4-hour Stochastic (slow) on this pair, suggesting an impending downward movement. On the other hand, the price of this pair is currently floating in the over-sold territory on the daily RSI, which highlights a level of upward pressure as well. We could see some downward corrections today, but there’s a good chance this pair will begin to change course by the beginning of next week.

USD/JPY

This pair continues to float within a narrow bullish channel, and also appears to have entered a consolidation trend recently. Once the consolidation point is reached near the 89.75 level, there’s a good change the bullish channel will continue. Going long appears to be today’s preferable strategy.

USD/CHF

The price of this pair has recently flattened out with what appears to be a pause in its movement. The hourly RSI is touching the over-sold border, while the daily RSI shows the price touching the over-bought border. Weekly momentum remains in an upward posture, but today’s movement appears to be anticipating a break in the market. Waiting for a clearer signal from this pair may be a smart move today.

The Wild Card

AUD/USD

A few months back this pair’s long-term bullish channel was breached and the pair now appears to be forming a double-top (or “M”) candlestick formation on the weekly chart. The weekly RSI shows the price cascading downward, highlighting plenty of downward momentum. The 4-hour RSI shows the pair in the over-bought territory, and the 4-hour Stochastic (slow) shows a fresh bearish cross. All suggesting that this pair is due for bearishness. Forex traders have a rare opportunity to spot this “M” formation at its second peak and ride out a tremendous wave for potentially large profits.

Forex Market Analysis provided by Forex Yard.

© 2006 by FxYard Ltd

Disclaimer: Trading Foreign Exchange carries a high level of risk and may not be suitable for all investors. There is a possibility that you could sustain a loss of all of your investment and therefore you should not invest money that you cannot afford to lose. You should be aware of all the risks associated with Foreign Exchange trading.

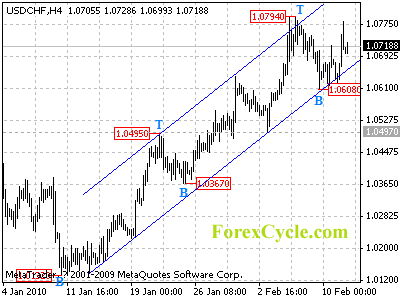
USDCHF formed a short term cycle bottom

Being supported by the lower border of the rising price channel, USDCHF formed a short term cycle bottom at 1.0608 level on 4-hour chart. Sideways movement is expected in a range between 1.0608 and 1.0794. A break above 1.0794 will signal resumption of uptrend from 1.0132, then another rise towards 1.0900 could be seen to follow. However, a breakdown below 1.0608 support will indicate that the uptrend from 1.0132 has completed at 1.0794 already, then pullback could be seen to 1.0500 or even lower.

usdchf

Daily Forex Forecast

Forex Daily Market Commentary

By GCI Forex Research

Fundamental Outlook at 1500 GMT (EDT + 0500)

The euro depreciated vis-à-vis the U.S. dollar today as the single currency tested bids around the US$ 1.3595 level and was capped around the $1.3800 figure.  The common currency continues to trade on rumours and news headlines regarding a European bailout plan for Greece’s fiscal deficit.  German Chancellor Merkel reported “Greece is part of the European Union and will not be left on its own” while U.K. Chancellor of the Exchequer Darling said a Greek resolution is in “all our interests.”  The lack of an explicit bailout package for Greece at this time indicates some likely political pressure against a deal.  EU leaders promised to “take determined and coordinated action, if needed, to safeguard financial stability in the euro area as a whole.”  European Central Bank President Trichet said “one can count on our permanent alertness.”  The EU seems to be resisting the possibility of Greece getting a bailout from the International Monetary Fund.  Aside from Greece’s problems, there is a concern that there could be contagion with the credit crisis spreading to other countries that have their own credit problems, including Spain, Ireland, and Portugal.  The euro will likely continue to suffer from downward pressure as long as there is no overt financial package to help Greece refinance its mountain of debt.  The European Union may be stalling on such an announcement as it assesses the likelihood of other eurozone countries requiring fiscal assistance.  The report of “solidarity” has so far not been enough to counter euro bears who want to see an actual deal announced.  ECB official member Nowotny warned “contagion would be worse than the negatives of helping” while EU’s Juncker reported the Masstricht Treaty’s “no bailout clause” will be respected and said the EU’s assistance will “avoid moral hazard.”  Interestingly, Greek Prime Minister Papandreou said his country is “not seeking” outside assistance to resolve its fiscal crisis.  ECB member Weber warned the German economy could shrink in Q1 and added current interest rates “are appropriate.”  Weber also added the ECB will phase out some liquidity programs and said the next likely step is a return to auctions for long-term refis, as opposed to full allotments.  In U.S. news, data released saw weekly initial jobless claims narrow to +440,000 while continuing jobless claims fell to 4.538 million.  Tomorrow’s data will include January retail sales, December business inventories, and February University of Michigan consumer sentiment.  The Federal Reserve is said to be in discussions with money market mutual funds on agreements to drain as much as US$ 1 trillion from the financial system.  The industry is about US$ 3.2 billion in size compared with around US$ 100 billion of capacity held by the eighteen primary dealers that trade directly with the Fed.  Fed Chairman Bernanke’s prepared testimony yesterday made it clear that the Fed will be unwinding some programs but averted an explicit timetable.  On the political front, Senate Democrats unveiled a new US$ 85 billion jobs stimulus plan.  Euro bids are cited around the US$ 1.3530 level.

¥/ CNY

The yen appreciated vis-à-vis the U.S. dollar today as the greenback tested bids around the ¥89.55 level and was capped around the ¥90.15 level.  Traders are awaiting Q4 2009 gross domestic product data that will be released on Monday and they are expected to show annualized growth of 3.6% for the October through December period, up from the 1.3% expansion in the third quarter.  Even if output is reported to have expanded, Bank of Japan Governor Shirakawa reported this month that “there is still a long way to go.”  Other data released in Japan this week saw December machinery orders up 20% m/m, defying expectations of an 8% increase.  It was also reported that January producer prices declined for a thirteenth consecutive month, off 2.1% – the longest streak in six years.  Even though this was better than December’s 3.9% slide, the negative print coincided with increases in commodity costs and these data simply reaffirm the deflationary pressures evident in the economy from a lack of final private demand.  BoJ Deputy Governor Yamaguchi this week warned economic growth “may stall” temporarily and said “growth may be in a pretty severe state through this summer, so we can’t really expect a rapid expansion.”  The Nikkei 225 stock index lost 0.19% yesterday to close at ¥9,932.90.  U.S. dollar offers are cited around the ¥94.75 level.  The euro moved lower vis-à-vis the yen as the single currency tested bids around the ¥122.05 level and was capped around the ¥124.15 level.  The British pound moved higher vis-à-vis the yen as sterling tested offers around the ¥140.95 level while the Swiss franc moved lower vis-à-vis the yen and tested bids around the ¥83.25 level. In Chinese news, the U.S. dollar appreciated vis-à-vis the Chinese yuan as the greenback closed at CNY 6.8338 in the over-the-counter market, up from CNY 6.8320.  People’s Bank of China reconfirmed it will “gradually guide monetary conditions back to normal levels from the counter-crisis mode.”  Data released in China today saw the M2 money supply up 26% y/y and it was reported that CNY 1.39 trillion of new loans were issued last month. Also, January producer prices expanded 4.3% y/y and consumer prices came in lighter-than-expected, up +1.5% y/y.  There is some speculation that the yuan has depreciated over the past couple of days ahead of the Chinese New Year as a signal that China is displeased with the U.S.’s recent military deal with Taiwan.

The British pound moved higher vis-à-vis the U.S. dollar today as cable tested offers around the US$ 1.5715 level and was supported around the $1.5560 level.  Bank of England Governor King reported the U.K. economy is “bumping along the bottom.”  Bank of England released its quarterly inflation report yesterday and noted inflation remains low in the U.K. and added the strength of the economic recovery of the U.K. economy remains “highly uncertain.”  Notably, BoE Governor King reported economic growth has decelerated from November 2009 but said Q4 GDP numbers could be upwardly revised.  Specifically on the inflation front, the central bank said inflation could move above 3% this year but added it should moderate within two years.  King also noted it is too early to say if the Bank will expand its quantitative easing purchase program by resuming bond and asset purchases.  Data released in the U.K. yesterday saw December manufacturing production climb 0.9% m/m and decline 1.9% y/y while December industrial production was up 0.5% m/m and off 3.6% y/y. Cable bids are cited around the US$ 1.5340 level.  The euro moved lower vis-à-vis the British pound as the single currency tested bids around the ₤0.8700 figure and was capped around the ₤0.8840 level.

CHF

The Swiss franc depreciated vis-à-vis the U.S. dollar today as the greenback tested offers around the CHF 1.0680 level and was supported around the CHF 1.0615 level.  Data released in Switzerland today saw January consumer price inflation decline 0.1% m/m and climb 1% y/y, a faster-than-expected acceleration.   Swiss National Bank member Jordan this week indicated it is premature to raise interest rates from their near zero per cent level.  Jordan also reported the SNB will continue to prevent an “excessive” appreciate of the Swiss franc, adding the franc is seen as a “safe haven.”  U.S. dollar offers are cited around the CHF 1.0810 level.  The euro moved lower vis-à-vis the Swiss franc as the single currency tested bids around the CHF 1.4655 level while the British pound appreciated vis-à-vis the Swiss franc and tested offers around the CHF 1.6845 level.

Forex Daily Market Commentary provided by GCI Financial Ltd.

GCI Financial Ltd (”GCI”) is a regulated securities and commodities trading firm, specializing in online Foreign Exchange (”Forex”) brokerage. GCI executes billions of dollars per month in foreign exchange transactions alone. In addition to Forex, GCI is a primary market maker in Contracts for Difference (”CFDs”) on shares, indices and futures, and offers one of the fastest growing online CFD trading services. GCI has over 10,000 clients worldwide, including individual traders, institutions, and money managers. GCI provides an advanced, secure, and comprehensive online trading system. Client funds are insured and held in a separate customer account. In addition, GCI Financial Ltd maintains Net Capital in excess of minimum regulatory requirements.

DISCLAIMER: GCI’s Daily Market Commentary is provided for informational purposes only. The information contained in these reports is gathered from reputable news sources and is not intended to be U.S.ed as investment advice. GCI assumes no responsibility or liability from gains or losses incurred by the information herein contained.

FOREX: Australian dollar jumps on better than expected jobs report

By CountingPips.com

The Australian dollar has surged in forex trading today as Australian employment data rose by more than expected in January. Australian employment increased by 52,700 jobs in January to a total of 10,966,300 employed workers as both full-time and part-time positions advanced, according to data from the Australian Bureau of Statistics. Full time workers increased by 15,900 while part-time workers climbed by 36,900 for the month. The job report easily surpassed market forecasts that were expecting total jobs to increase by 15,000.

December’s employment data was also better than previously estimated as the jobs data was revised higher to show a gain of 37,500 workers. The unemployment rate fell by 0.2 percent in January from 5.5 percent to 5.3 percent as unemployed workers decreased by 22,300 to a total of 612,000.

The unemployment rate decline surpassed market forecasts that were predicting the rate to increase to 5.6 percent.

The jobs news pushed the Australian dollar sharply higher versus the major currencies in the forex markets. The Aussie gained versus the euro, U.S. dollar, British pound, New Zealand dollar, Canadian dollar and the Japanese yen.

The AUD/USD currency pair touched its highest level in eight days while the combination of the jobs report and the euro’s decline on the Greece debt situation has helped propel the EUR/AUD to its lowest trading level since September of 2000.

EUR/AUD Monthly Chart – The Euro continues falling against the Australian Dollar today for the third day in a row. This EUR/AUD is trading at its lowest exchange rate level since September 2000 around the 1.5340 level.

AUD/USD Surges Following Impressive Employment Data

By Fast Brokers – The Aussie surged during the Asia trading session after Australia’s Employment change number printed over 3 times stronger than analyst expectations and the headline Unemployment Rate sank to 5.5%.  The encouraging improvement in Australian Unemployment sent the Aussie surging higher as investors speculated that the RBA will keep its monetary policy tight in the anticipation of higher consumption and consumer prices.  Meanwhile, China’s CPI printed weaker than anticipated even though new loans surged.  Hence, it seems China can leave its liquidity relatively loose since prices are under control, appositive development for Australia and anticipated demand for its commodities.  However, the Aussie is trading off of intraday highs as the Dollar appreciates across the board in reaction to the EU Summit and a decline in U.S. weekly Unemployment Claims.  The EU announced that it plans to help Greece deal with its troubling fiscal situation, yet provided few details.  Investors are reacting negatively to the lack of clarity, sending the Euro tumbling lower.  Additionally, an improvement in U.S. employment is a positive for the Dollar since the Fed has implied that it is waiting for a turnaround in unemployment before tightening liquidity.  Meanwhile, volatility could pick up tomorrow with the release of Germany’s Prelim GDP followed by U.S. retail sales and consumer confidence data.  Hence, investors should keep a sharp eye on broad-based activity in the Dollar and gold since Australia will be quiet on the data front tomorrow.  That being said, the Aussie could maintain a positive bias considering today’s impressive employment data.

Technically speaking, we’ve readjusted our trend lines to compensate for today’s leg up.  To the topside the Aussie faces multiple downtrend lines along with 2/3, 2/1, and 1/28 highs.  Additionally, the psychological .89 and .90 levels could serve as technical barriers should they be tested.  As for the downside, the Aussie has multiple uptrend lines serving as technical cushions along with 2/2 and 2/10 lows.

Price: .8851

Resistances:   .8869, .8885, .8901, .8921, .8935, .8956

Supports: .8842, .8826, .8808, .8794, .8778, .8762

Psychological: .88, .89, February highs and lows.

(click chart to enlarge)

Market Commentary provided by Fast Brokers.

Disclaimer: FastBrokers’ market commentary is provided for information purposes only and under no circumstances should be regardedneither as an investment advice nor as a solicitation or an offer to sell/buy any financial product. FastBrokers assumes no responsibility or liability from gains or losses incurred by the information herein contained.

Risk Disclosure: There is a substantial risk of loss in trading futures and foreign exchange. Please carefully review all risk disclosure documents before opening an account as these financial instruments are not appropriate for all investors.

USD/JPY Fluctuates Below 90

By Fast Brokers – The USD/JPY continues to fluctuate below its highly psychological 90 level despite heightened volatility in the Euro and Aussie.  Japan’s surge in CapEx (20.1%), suggesting a pickup in manufacturing and economic activity.  However, it will be interesting to see how Toyota recalls impact CapEx the next time around.  Regardless, it’s a welcome development for a beleaguered Japanese economy battling deflationary pressures.  The risk trade received some good news today in the form of strong Australian employment data and weaker than expected CPI data from China.  Such developments would normally be positive for the USD/JPY, yet the currency pair seems to be held down by economic uncertainty in the EU.  Speaking of which, investors should continue to monitor the Euro’s reaction the to the EU’s decision to assist Greece with its debt issues.  Meanwhile, the U.S. released stronger than expected weekly Unemployment Claims, a positive development for the Dollar.  The EU will release Germany’s Prelim GDP tomorrow followed by retail sales and consumer sentiment numbers from the U.S.  Hence, the trading week could end on a volatile note.  Yen traders will likely be paying close attention to U.S. retail sales numbers since they could give further insight in regards to the state of Japan’s manufacturing sector.
Technically speaking, the USD/JPY still has multiple uptrend lines serving as technical cushions along with intraday, 2/10 and 2/5 lows.  As for the topside, the USD/JPY faces multiple downtrend lines along with intraday, 1/28, and 1/29 highs.  Furthermore, the psychological 90 area could continue to serve as a technical barrier.

Present Price: 89.70

Resistances: 89.88, 89.99, 89.99, 90.17, 90.32, 90.50

Supports: 89.72, 89.62., 89.50, 89.37, 89.23, 89.13, 89

Psychological: 90, February highs and lows

(click chart to enlarge)

Market Commentary provided by Fast Brokers.

Disclaimer: FastBrokers’ market commentary is provided for information purposes only and under no circumstances should be regardedneither as an investment advice nor as a solicitation or an offer to sell/buy any financial product. FastBrokers assumes no responsibility or liability from gains or losses incurred by the information herein contained.

Risk Disclosure: There is a substantial risk of loss in trading futures and foreign exchange. Please carefully review all risk disclosure documents before opening an account as these financial instruments are not appropriate for all investors.

GBP/USD Gravitates around February Lows

By Fast Brokers – The Cable is battling to stay above previous February lows and the psychological 1.55 level as the Dollar strengthens across the board during the U.S. trading session.  Weekly U.S. Unemployment Claims printed stronger than analyst expectations, leading investors towards the Dollar amidst economic uncertainty in Europe.  Speaking of which, although the EU has come to a decision to help Greece the Euro is weakening, telling us assistance from the EU may have already been priced in earlier this week.  Meanwhile, investors also appear to be brushing aside stronger than expected Australian employment data and weaker than expected CPI data from China, both positive developments for the risk trade. Therefore, investor uncertainty concerning the ramifications of European debt problems seems to be bearing on the market.  Although the UK is quiet on the economic data front today, Manufacturing Production printed much stronger than analyst estimates yesterday.  However, investors should keep in mind that services drive the UK economy, and Services PMI data disappointed last week.  Hence, the UK still faces economic headwinds despite noticeable signs of improvement.  Also weighing on the Pound is weaker than expected projections for UK GDP and CPI growth released yesterday in the BoE’s inflation report.  The BoE’s modest economic outlook for the UK is a bit discouraging and may also be yielding weakness in the Pound.  Meanwhile, attention will remain focused on the EU and its plan to guide Greece out of its debt problems in addition to Germany’s Prelim GDP data due tomorrow.  Additionally, the U.S. will release Retail Sales and Prelim UoM Consumer Sentiment data.  Hence, the trading week could end on a volatile note.

Technically speaking, the Cable has multiple downtrend lines serving as technical barriers along with intraday and 2/10 highs.  We’ve created some new uptrend lines, albeit tight ones, to serve as technical cushions along with the psychological 1.55 area.

Present Price: 1.5608

Resistances: 1.5621, 1.5637, 1.5659, 1.5690, 1.5717, 1.5744

Supports: 1.5593, 1.5572, 1.5558, 1.5533, 1.5502

Psychological: 1.55

(click chart to enlarge)

Market Commentary provided by Fast Brokers.

Disclaimer: FastBrokers’ market commentary is provided for information purposes only and under no circumstances should be regardedneither as an investment advice nor as a solicitation or an offer to sell/buy any financial product. FastBrokers assumes no responsibility or liability from gains or losses incurred by the information herein contained.

Risk Disclosure: There is a substantial risk of loss in trading futures and foreign exchange. Please carefully review all risk disclosure documents before opening an account as these financial instruments are not appropriate for all investors.

EUR/USD Weakens in Wake of Positive U.S. Data

By Fast Brokers – The EUR/USD is pulling back after U.S. Unemployment Claims came in at 440k, 20k below analyst estimates.  The stronger than expected U.S. employment data is sending investors towards the Dollar as an EU resolution for Greece becomes more certain.  Although the details of the plan haven’t been revealed yet, the Euro seems to be selling off on the news since the concept of EU relief was priced into the currency earlier this week.  Meanwhile, we notice a pullback in gold as well, indicating that investors are opting to be risk-averse right now.   On that note, the risk trade did receive a bit of good news during the Asia trading session.  Australian employment data printed stronger than analyst expectations and China’s CPI data was cooler than estimates.  Hence, the RBA has more incentive to maintain a tight monetary stance while China may feel less pressure to tighten liquidity at this point in time.  Both developments are positive for the risk trade.  However, debt issues in the EU have ignited investor uncertainty which is bearing down on risk right now.  Although the EU has been quiet on the economic data front this week, it will reenter the fray tomorrow by releasing German Prelim GDP along with EU Flash GDP and Industrial Production.  Strong economic data could help the EUR/USD regain its footing whereas a weak showing could lead to a retest of February lows.  Meanwhile, investors should keep an eye on broad-based activity in the Dollar and gold as investors digest the EU’s decision to aid Greece.

Technically speaking, the EUR/USD faces topside technical barriers in the form of multiple downtrend lines along with intraday and 2/9 highs.  Our 2nd tier could carry some weight since it runs through 2/3 highs and the 1.40 area.  As for the downside, the EUR/USD has multiple uptrend lines serving as technical cushions along with 2/5 lows and the psychological 1.35 level should it be tested.

Present Price: 1.3670

Resistances: 1.3693, 1.3721, 1.3744, 1.3773, 1.3806, 1.3841

Supports:  1.3640, 1.3610, 1.3587, 1.3563, 1.3533, 1.35

Psychological: February highs and lows, 1.35

(click chart to enlarge)

Market Commentary provided by Fast Brokers.

Disclaimer: FastBrokers’ market commentary is provided for information purposes only and under no circumstances should be regardedneither as an investment advice nor as a solicitation or an offer to sell/buy any financial product. FastBrokers assumes no responsibility or liability from gains or losses incurred by the information herein contained.

Risk Disclosure: There is a substantial risk of loss in trading futures and foreign exchange. Please carefully review all risk disclosure documents before opening an account as these financial instruments are not appropriate for all investors.