By Dan Eduard – The Scandinavian Kroner took fresh losses against the U.S. Dollar in recent trading. This was largely due to a series of positive news events coming out of America, combined with negative economic indicators from countries such as Sweden and Norway.
The most recent U.S. Existing Home Sales Report has caused the Dollar to make impressive gains against its major counterparts. In Sweden, consumer confidence unexpectedly fell in December relative to November’s report. As a result, the Swedish Krona tumbled against the greenback, and is currently trading around 7.3285. After a Norwegian report released last week indicated that unemployment in that country recently increased, the USD/NOK pair rose, and is currently trading around 5.8720.
Looking to the week ahead, a fresh batch of news events could impact the Scandinavian Kroner. The U.S. New Home Sales Report, set to be released at 15:00 GMT Wednesday, as well as the most recent American unemployment figures set to be released on Thursday at 13:30 GMT will likely impact the market. Any positive news from these events will likely drive the Kroner lower against the greenback. That being said, all hope is not lost for those looking for a rebound from the Scandinavian currencies. As indicated by the technical analysis below, the Danish Krone is venturing into over-bought territory. This may indicate that a downward correction could be imminent.
USD/DKK Technical Analysis
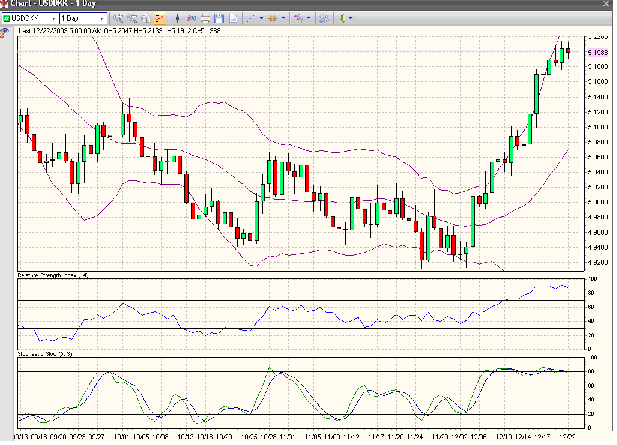
After yesterday’s bullish trading session, the pair is showing strong bearish signals. The daily chart below shows a bearish cross has formed, pointing to a future downward correction in price. The same chart also has the price floating in the over-bought zone on the RSI. This could give forex traders the opportunity to go short on this pair today.
The technical indicators used are the Slow Stochastic, Relative Strength Index (RSI), and Bollinger Bands.
Point 1: The Slow Stochastic indicates a bearish cross, signaling that the next move may be in a downward direction.
Point 2: The Relative Strength Index (RSI) signals that the price of this pair currently floats in the over-bought territory, indicating downward pressure.
Point 3: The Bollinger Bands show the most recent price move has originated at the upper border, indicating the potential to go all the way to the lower border.
Forex Market Analysis provided by Forex Yard.
© 2006 by FxYard Ltd
Disclaimer: Trading Foreign Exchange carries a high level of risk and may not be suitable for all investors. There is a possibility that you could sustain a loss of all of your investment and therefore you should not invest money that you cannot afford to lose. You should be aware of all the risks associated with Foreign Exchange trading.
