Dollar net short bets decline continued despite jump in unemployment

By IFCMarkets

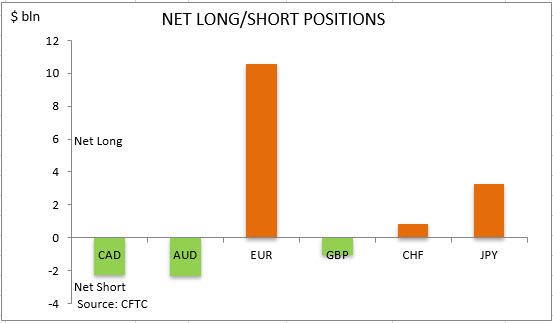
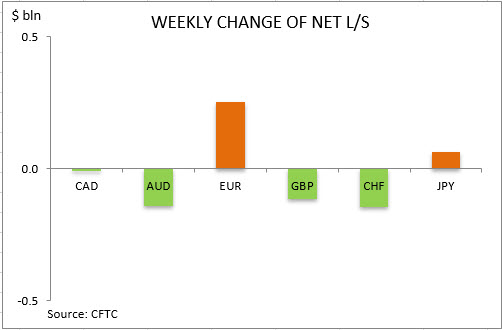
US dollar bearish bets decrease continued to $9.07 billion from $9.17 billion against the major currencies during the one week period, according to the report of the Commodity Futures Trading Commission (CFTC) covering data up to May 2 and released on Friday May 15. The marginal change in overall dollar position was mainly due to marginal decrease in bullish bets on Swiss franc, increase in bearish bets on Australian dollar and British Pound, as well as increase in euro bullish bets. Once again the Pound, Canadian and Australian dollars maintained net short positions against the dollar. The ICE US Dollar index rose as the China’s General Administration of Customs reported Chinese exports rose unexpectedly 3.5% in April from a year earlier, after falling 6.6% in March. And Dollar strengthened despite the April US jobs report indicated unemployment jumped to 14.7% due to US job losses unseen since the Great Depression of the 1930s.


CFTC Sentiment vs Exchange Rate

May 12 2020BiasEx RateTrendPosition $ mlnWeekly Change
CADbearishpositive-2291-9
AUDbearishpositive-2294-143
EURbullishnegative10593254
GBPbullishpositive-1049-116
CHFbullishneutral857-145
JPYbullishnegative325865
Total9073


commitment of traders net long short
commitment of traders weekly change
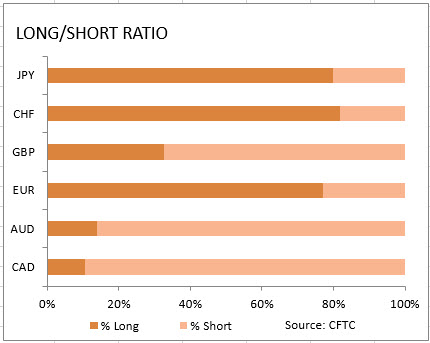
market sentiment ratio long short positions

Market Analysis provided by IFCMarkets

Note:
This overview has an informative and tutorial character and is published for free. All the data, included in the overview, are received from public sources, recognized as more or less reliable. Moreover, there is no guarantee that the indicated information is full and precise. Overviews are not updated. The whole information in each overview, including opinion, indicators, charts and anything else, is provided only for familiarization purposes and is not financial advice or а recommendation. The whole text and its any part, as well as the charts cannot be considered as an offer to make a deal with any asset. IFC Markets and its employees under any circumstances are not liable for any action taken by someone else during or after reading the overview.
WARNING: Shady “Rare” Coin Dealers Are Circling Like Vultures

By Money Metals News Service

Nervous investors have been pouring into the gold and silver markets over the past two months.

Money Metals Exchange is proud to have helped almost 20,000 new customers with a precious metals purchase in recent weeks, many of whom came over from other dealers struggling with inventory shortages and ridiculous delivery delays.

Bait and Switch Dollar

A new wave of investors is getting the message; the Federal Reserve will never stop printing currency units and punishing savers with lower interest rates, Congress will never put deficits under control, and the government-terminated U.S. economy may not recover for years.

For most clear-eyed investors, it is time to batten down the hatches.

Lots of them are diversifying into precious metals.

Unfortunately, shady coin dealers are out in force, trying to capitalize on this situation. We can see it in the proliferation of these dealers advertising on TV and radio with their celebrity spokesmen.

If investors pick up the phone and call one of these outfits, they could get severely punished for making an otherwise good decision.

Deciding to buy some gold and silver as a safe-haven makes a ton of sense. However, plenty of people with sound intentions will call the wrong dealer and let some high-pressure salesperson convince them to buy dubious “rare,” “graded,” or “proof” coins.

Instead of betting on gold and silver bullion as a safe haven, they find themselves gambling in the highly speculative and illiquid numismatic market. The winners are usually just the dealers selling coins for 2-3 times what their precious metal content is really worth.

There is zero reason to buy numismatic coins – unless you are an experienced collector. If you are an investor or someone simply looking to preserve wealth, the price-transparent bullion market is where you want to be. Don’t let yourself get derailed, regardless of how smooth or insistent the sales pitch may be.

Here are some red flags to watch out for:

  • The salesperson gives you some story about why you should avoid bullion and buy collectible coins instead.
  • The salesperson claims numismatic coins have tax advantages, asserts that only bullion can be confiscated, or claims numismatic coins will outperform bullion as an investment. These are all nonsense. (You are guaranteed immediate confiscation through the high premiums on “rare” coins.)
  • The salesperson calls regularly and uses pressure techniques.
  • The dealer claims to have a “super hot buy” and that if you don’t grab it immediately, someone else will.
  • You are told the resale value is higher than the current purchase price, as if the salesperson is really going to sell coins for a loss.
  • The dealer doesn’t publish bid prices – the price they pay to buy coins from clients. The bid will often be 30% to 50% less, if they’ll buy items back at all.

The key to making a good investment in precious metals is to buy highly liquid bullion coins, rounds and bars at low premiums. And also choose a dealer you can count on to deliver quickly and reliably.

Investors who stick to these simple guidelines will be well positioned for the dual threat of inflation and economic turmoil.

They won’t start way underwater because the coins they bought were vastly overpriced. They also won’t be stuck having to find some greater fool to buy their “rare” coins when the time comes to sell – a problem which may be compounded if hard economic times reduce the number of people buying luxuries like collectible coins.


The Money Metals News Service provides market news and crisp commentary for investors following the precious metals markets.
GBPUSD Analysis: Not as widespread as forecast UK house price decreases bullish for GBPUSD

By IFCMarkets

Not as widespread as forecast UK house price decreases bullish for GBPUSD

Minus 21 per cent of respondents reported a decline in UK house prices in April after 9% reported increases in March according to RICS House Price Balance survey, when a 25% of respondents were expected to report decreases. This is bullish for GBPUSD.

IndicatorVALUESignal
RSINeutral
MACDBuy
Donchian ChannelBuy
MA(200)Sell
FractalsBuy
Parabolic SARBuy


Summary of technical analysis

OrderBuy
Buy stopAbove 1.2140
Stop lossBelow 1.2091

Market Analysis provided by IFCMarkets

Tech and ESG are the “investment megatrends of the decade”: deVere CEO

By George Prior

Technology and responsible investing will “inevitably be the top two megatrends” of the 2020s, affirms the CEO of one of the world’s largest independent financial advisory organizations.

The bold, unambiguous message from deVere Group’s chief executive and founder, Nigel Green, comes global stocks rise as the world looks ahead to the post-pandemic era and gradual economic recovery.

Mr Green comments: “The Covid-19 crisis has accelerated innovation and disruption and has heightened expectations.  The future has happened faster.

“I believe that there are two underlying forces that will inevitably be the major investment megatrends of this decade, likely to be worth tens of trillions of dollars.

“The first is technology. The digital revolution is taking place right now in a monumental way, with our daily lives become ever more digitalized at a staggering speed.

“The rapid advancement of digital technologies is already fundamentally changing business models, institutions and society as a whole – and this trend is likely to pick up pace further as tech evolves.

“The digital revolution means the potential for new and emerging businesses and industries is greater than ever before – and both retail and institutional investors will, naturally, be drawn to the massive growth and opportunities.

“Indeed, we can see the future economy already in global stock markets which are being driven up primarily by tech-based firms.”

Against this backdrop of advancing technologies impacting all areas of our lives, including personal finance, last week deVere Group announced it is to develop a major digital finance operation from its headquarters in Dubai, UAE.

The deVere CEO says the second megatrend will be environmental, social and governance (ESG) investments.

“These unusual times have fostered a growing collective awareness and sense of mutual responsibility.

“It’s been brought into sharp focus that today’s Covid-19 crisis could be overshadowed by tomorrow’s climate crisis.

“It has demonstrated the importance of having sustainable and diverse supply chains. It has also underscored that companies with strong corporate governance and good business practice are best-positioned for the future.
“This has been evidenced by those investments with robust ESG credentials continuing to outperform throughout the recent bouts of stock market volatility.

“Again, the major growth and opportunities that that pattern of change creates cannot be, and will not be, ignored by retail and institutional investors.

Mr Green concludes: “It’s often said when investing that a ‘trend is a friend.’ A megatrend is likely, therefore, to be your best friend.

“Megatrends – like the advancing technology and the search for purposeful profits – affect how we live and work every day, therefore they impact global markets and investor outcomes.”

About:

deVere Group is one of the world’s largest independent advisors of specialist global financial solutions to international, local mass affluent, and high-net-worth clients.  It has a network of more than 70 offices across the world, over 80,000 clients and $12bn under advisement.

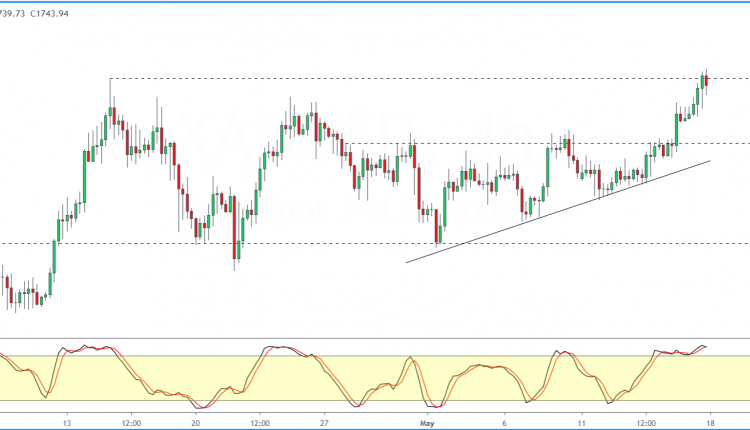
Gold’s Rally Completes The Ascending Triangle Pattern

By Orbex

The precious metal rose just under 1% on Friday, settling at 1743.94.

But, this was not before rising to intraday highs of 1751.42. This also marks the upside target of the ascending triangle pattern.

Gold prices were consolidating below the technical resistance level of 1717.65.

Following the higher lows, price action eventually broke past the resistance level.

At 1743.94, gold prices are now testing the April 14 highs.

If there is no further breakout, expect a pullback. The previous price level at 1717.65 could be tested for support.

By Orbex


Forex Technical Analysis & Forecast 18.05.2020

Article By RoboForex.com

EURUSD, “Euro vs US Dollar”

After completing the descending impulse at 1.0803 along with the correction towards 1.0825, EURUSD is expected to form a new descending impulse to break 1.0802. After that, the instrument may continue falling to reach 1.0777. And that’s just a half of another descending wave. The key downside target is at 1.0700.

EURUSD
Risk Warning: the result of previous trading operations do not guarantee the same results in the future

GBPUSD, “Great Britain Pound vs US Dollar”

GBPUSD has broken 1.2133 and is expected to continue falling inside the downtrend with the target at 1.2033. Possibly, today the pair may correct towards 1.2133. After that, the instrument may rebound from this level and then resume trading to reach the above-mentioned target.

GBPUSD
Risk Warning: the result of previous trading operations do not guarantee the same results in the future

USDRUB, “US Dollar vs Russian Ruble”

USDRUB continues falling towards 72.50. Today, the pair may reach it and then start another correction towards 74.00. Later, the market may resume trading inside the downtrend with the target at 71.30.

USDRUB
Risk Warning: the result of previous trading operations do not guarantee the same results in the future

USDJPY, “US Dollar vs Japanese Yen”

USDJPY is still consolidating around 107.03. Possibly, today the pair may resume falling to break 106.82 and then continue trading downwards with the target at 106.60.

USDJPY
Risk Warning: the result of previous trading operations do not guarantee the same results in the future

USDCHF, “US Dollar vs Swiss Franc”

After finishing the ascending impulse at 0.9735 along with the correction towards 0.9710, USDCHF is expected to grow to break 0.9735. Later, the market may continue trading upwards with the target at 0.9760.

USDCHF
Risk Warning: the result of previous trading operations do not guarantee the same results in the future

AUDUSD, “Australian Dollar vs US Dollar”

After completing another descending impulse at 0.6404, AUDUSD has corrected towards 0.6444 to test it from below. According to the main scenario, the price may resume trading downwards with the short-term target at 0.6363.

AUDUSD
Risk Warning: the result of previous trading operations do not guarantee the same results in the future

BRENT

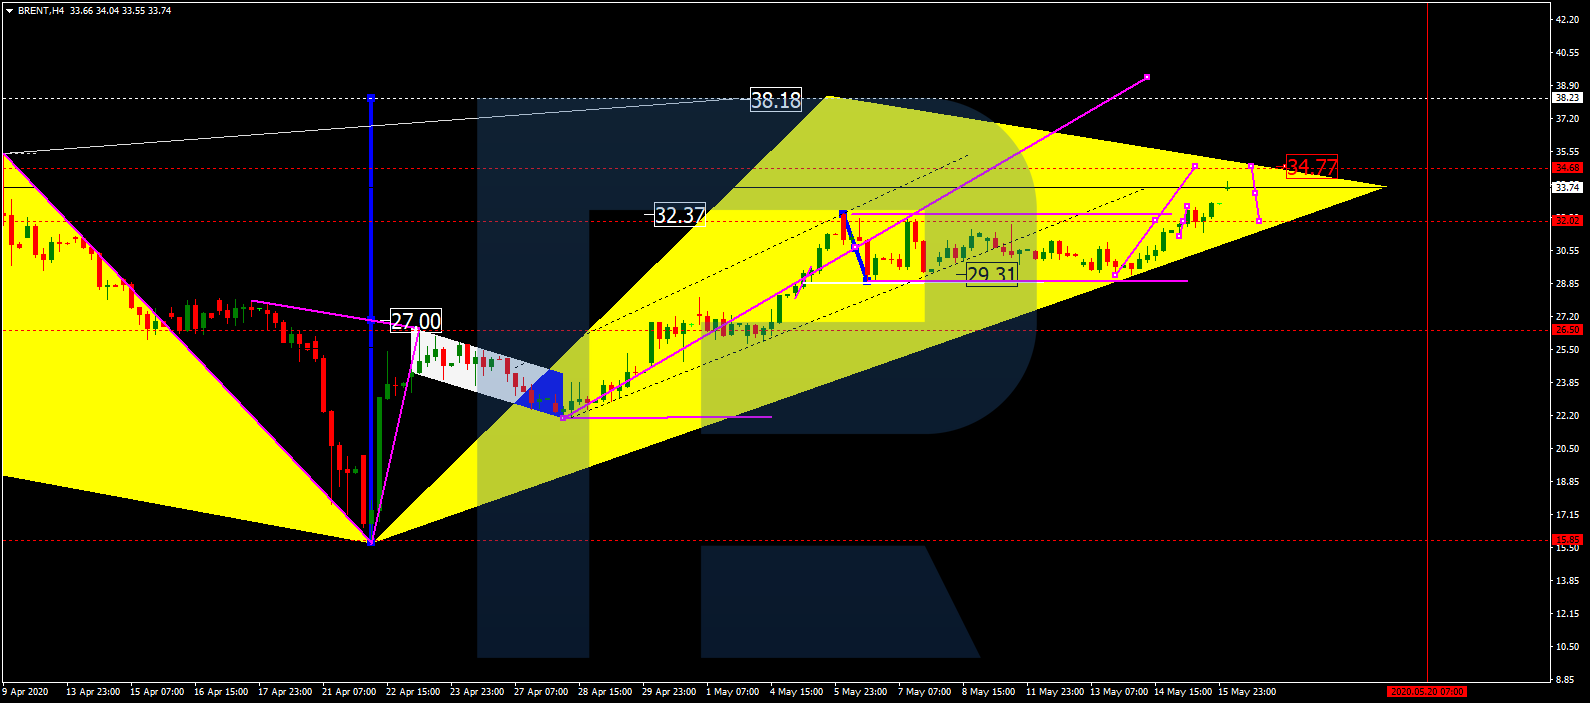
After breaking 32.15, Brent is still moving upwards to reach 34.74. After that, the instrument may form a new descending structure towards 32.15 and then start another growth with the short-term target at 36.80.

BRENT
Risk Warning: the result of previous trading operations do not guarantee the same results in the future

XAUUSD, “Gold vs US Dollar”

Gold is still trading upwards; it has already broken 1751.50 and may continue growing to reach 1773.17. Later, the market may start a new correction with the short-term target at 1751.50.

GOLD
Risk Warning: the result of previous trading operations do not guarantee the same results in the future

BTCUSD, “Bitcoin vs US Dollar”

BTCUSD continue growing. Possibly, today the pair may reach 10040.00 and then start another correction to reach 9600.00. After that, the instrument may resume trading upwards with the target at 10150.00.

BITCOIN
Risk Warning: the result of previous trading operations do not guarantee the same results in the future

S&P 500

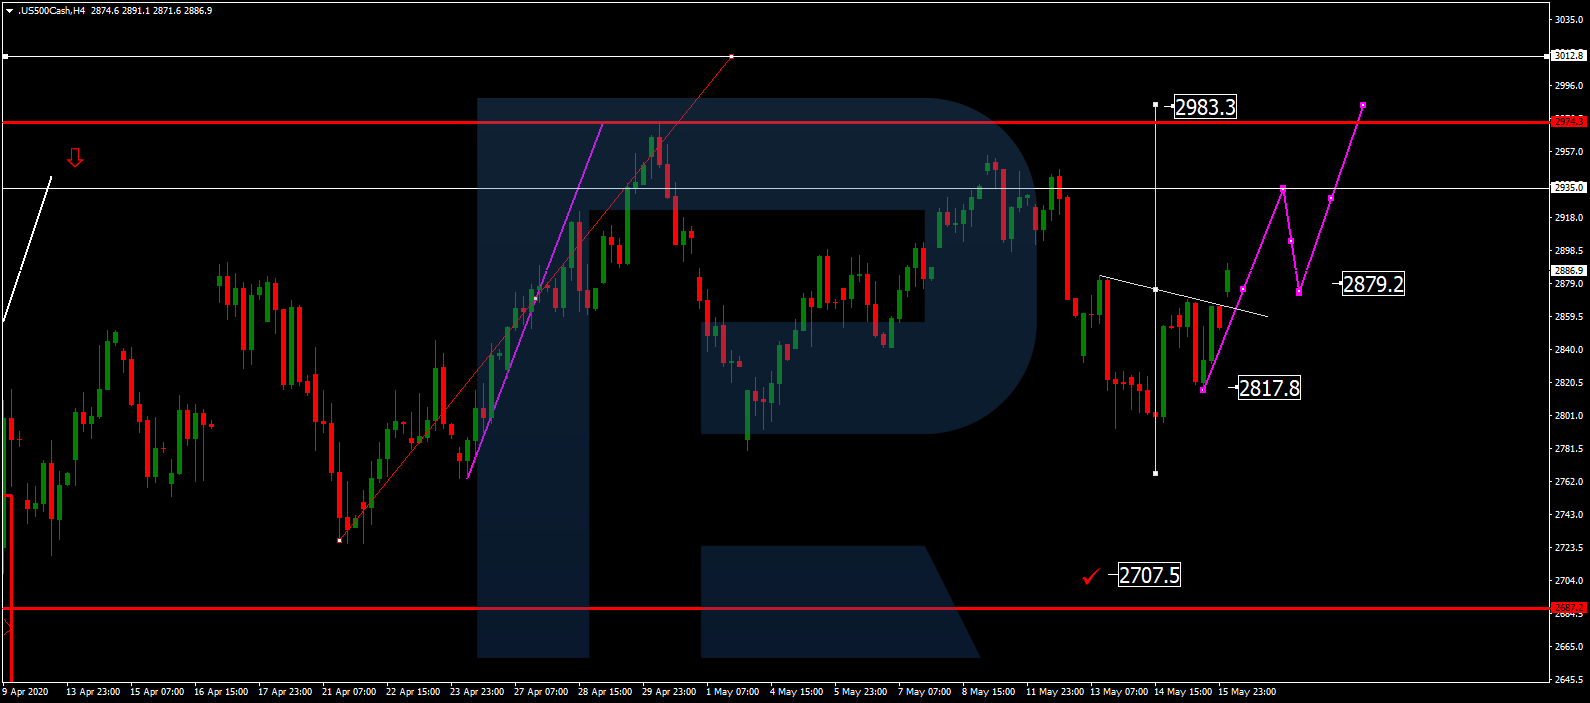
The Index is trading to break 2879.2 to the upside. The main scenario implies that the price may continue trading upwards with the short-term target at 2935.0. Later, the market may correct towards 2879.2 and then form one more ascending structure to reach 2983.3.

S&P 500

Article By RoboForex.com

Attention!
Forecasts presented in this section only reflect the author’s private opinion and should not be considered as guidance for trading. RoboForex LP bears no responsibility for trading results based on trading recommendations described in these analytical reviews.

EURUSD Price Action Looking Increasingly Weaker

By Orbex

The euro currency continues its consolidation as price action was somewhat flat into Friday’s close.

However, the intraday gains to highs near 1.0895 and the subsequent decline could mark the right shoulder of the head and shoulders pattern forming.

The neckline support at 1.0792 remains in play for the moment.

A breakout below this level will, however, validate the bearish pattern.

The initial downside target is at 1.0736 followed by 1.0702.

But, if price fails to breakdown lower, expect the consolidation below 1.1000 to continue.

By Orbex


Fibonacci Retracements Analysis 18.05.2020 (GOLD, USDCHF)

Article By RoboForex.com

XAUUSD, “Gold vs US Dollar”

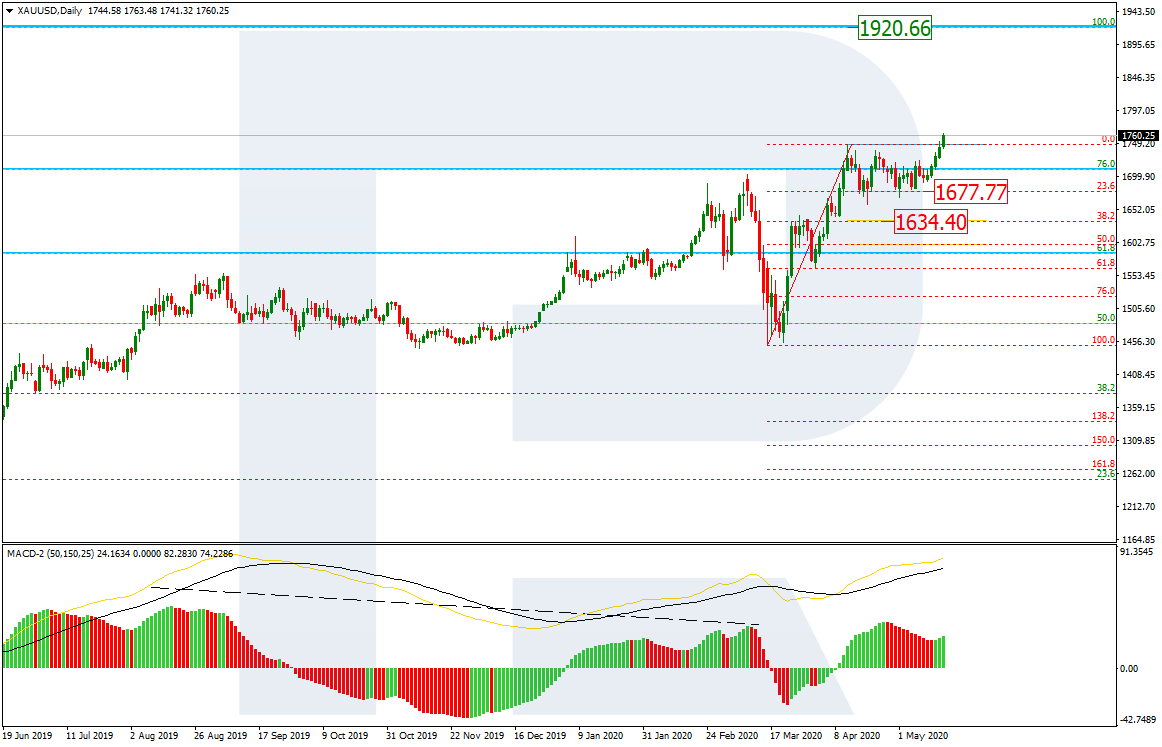
As we can see in the daily chart, after a long test of 76.0% fibo and a breakout of the previous high, XAUUSD is forming a new ascending impulse towards its all-time high at 1920.66. However, attempting to reach and test the target, the instrument is expected to rebound and correct downwards.

GOLD_D1
Risk Warning: the result of previous trading operations do not guarantee the same results in the future

In the H4 chart, after breaking the long-term consolidation range and finishing the descending correction towards 23.6% fibo at 1677.77, the pair has broken the high at 1747.77. The next upside targets may be inside the post-correctional extension area between 138.2% and 161.8% fibo at 1798.90 and 1858.60 respectively. The support is at 1677.77.

GOLD_H4
Risk Warning: the result of previous trading operations do not guarantee the same results in the future

USDCHF, “US Dollar vs Swiss Franc”

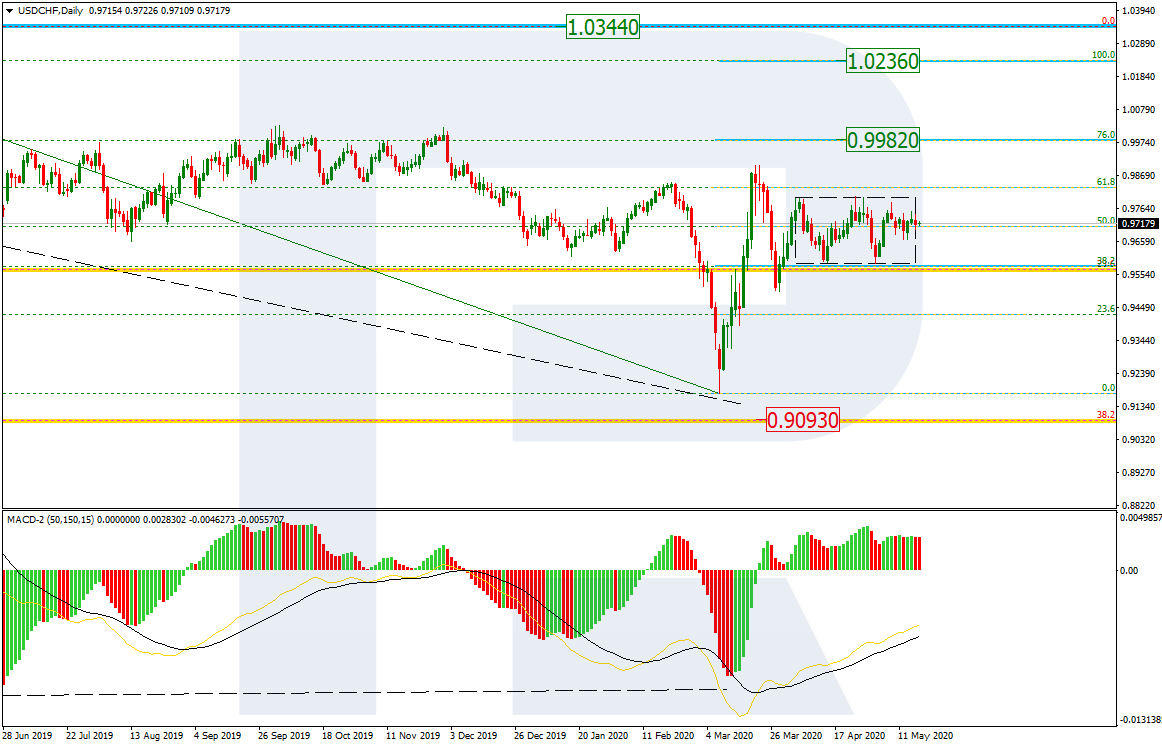
As we can see in the daily chart, USDCHF continues the long-running correction between 38.2% and 61.8% fibo. Since the MACD lines are directed upwards, the price is expected to break the current correction to the upside. The first target will be 76.0% fibo at 0.9982 and then the fractal high at 1.0236.

USDCHF_D1
Risk Warning: the result of previous trading operations do not guarantee the same results in the future

In the H4 chart, the correctional channel is squeezing between the support and resistance levels at 0.9622 and 0.9764 respectively. If the price breaks the support, it may expand the correctional channel down to 61.8% fibo at 0.9453. Otherwise, the pair may start a new growth to reach the high at 0.9901.

USDCHF_H4

Article By RoboForex.com

Attention!
Forecasts presented in this section only reflect the author’s private opinion and should not be considered as guidance for trading. RoboForex LP bears no responsibility for trading results based on trading recommendations described in these analytical reviews.

The Analytical Overview of the Main Currency Pairs on 2020.05.18

by JustForex

The EUR/USD currency pair

Technical indicators of the currency pair:
  • Prev Open: 1.08034
  • Open: 1.08159
  • % chg. over the last day: +0.10
  • Day’s range: 1.08077 – 1.08284
  • 52 wk range: 1.0777 – 1.1494

The technical pattern is still ambiguous on the EUR/USD currency pair. A trading instrument is consolidating. Currently, the local support and resistance levels are 1.0800 and 1.0825, respectively. The conflict between Washington and Beijing has escalated again after White House trade adviser, Peter Navarro, said that China hid the COVID-19 virus from the world for two months. Fed Chairman, Jerome Powell, said the US economy could decrease to 30% in the second quarter. We recommend opening positions from key levels.

Today, the publication of important economic releases is not expected.

EUR/USD

Indicators do not give accurate signals: the price has crossed 50 MA and 100 MA.

The MACD histogram is near the 0 mark.

Stochastic Oscillator is in the neutral zone, the %K line is below the %D line, which indicates the bearish sentiment.

Trading recommendations
  • Support levels: 1.0800, 1.0775
  • Resistance levels: 1.0825, 1.0850, 1.0875

If the price fixes below 1.0800, the EUR/USD currency pair is expected to fall. The movement is tending to 1.0775-1.0750.

An alternative could be the growth of EUR/USD quotes to 1.0850-1.0870.

The GBP/USD currency pair

Technical indicators of the currency pair:
  • Prev Open: 1.22215
  • Open: 1.20756
  • % chg. over the last day: -0.17
  • Day’s range: 1.20751 – 1.21254
  • 52 wk range: 1.1466 – 1.3516

GBP/USD quotes continue to show a negative trend. The British pound has updated local lows again. The trading instrument is currently consolidating. The local support and resistance levels are 1.2075 and 1.2135, respectively. The British pound has the potential for further decline relative to the greenback. We recommend opening positions from key levels.

The news feed on the UK economy is calm.

GBP/USD

Indicators do not give accurate signals: the price has fixed below 50 MA and 100 MA.

The MACD histogram is in the negative zone, but above the signal line, which gives a weak signal to sell GBP/USD.

Stochastic Oscillator is in the neutral zone, the %K line has crossed the %D line. There are no signals at the moment.

Trading recommendations
  • Support levels: 1.2075, 1.2040
  • Resistance levels: 1.2135, 1.2180, 1.2235

If the price fixes below 1.2075, a further drop in GBP/USD quotes is expected. The movement is tending to 1.2040-1.2020.

An alternative could be the growth of the GBP/USD currency pair to 1.2180-1.2220.

The USD/CAD currency pair

Technical indicators of the currency pair:
  • Prev Open: 1.40430
  • Open: 1.41067
  • % chg. over the last day: +0.43
  • Day’s range: 1.40597 – 1.41117
  • 52 wk range: 1.2949 – 1.4668

There is an ambiguous technical pattern on the USD/CAD currency pair. The loonie is in a sideways trend. At the moment, USD/CAD quotes are testing the support level of 1.4065. The 1.4115 mark is the key resistance. The Canadian dollar is supported by the recovery of “black gold” prices. A trading instrument is tending to decline. Positions should be opened from key levels.

The publication of important economic releases from Canada is not planned.

USD/CAD

Indicators do not give accurate signals: the price has crossed 50 MA.

The MACD histogram is near the 0 mark.

Stochastic Oscillator is in the neutral zone, the %K line is below the %D line, which indicates the bearish sentiment.

Trading recommendations
  • Support levels: 1.4065, 1.4020, 1.3970
  • Resistance levels: 1.4115, 1.4140, 1.4170

If the price below the support level of 1.4065, a drop in USD/CAD quotes is expected. The movement is tending to 1.4030-1.4000.

An alternative could be the growth of the USD/CAD currency pair to 1.4140-1.4170.

The USD/JPY currency pair

Technical indicators of the currency pair:
  • Prev Open: 107.250
  • Open: 107.078
  • % chg. over the last day: -0.21
  • Day’s range: 107.068 – 107.309
  • 52 wk range: 101.19 – 112.41

The USD/JPY currency pair is being traded in a flat. There is no defined trend. Financial market participants expect additional drivers. USD/JPY quotes are testing the following key support and resistance levels: 107.05 and 107.40, respectively. We recommend paying attention to the dynamics of US government bonds yield. Positions should be opened from key levels.

According to preliminary data, Japan’s GDP fell by 0.9% (q/q) in the first quarter. Experts expected a decrease by 1.2%.

USD/JPY

Indicators do not give accurate signals: the price has crossed 50 MA.

The MACD histogram is near the 0 mark.

Stochastic Oscillator is in the neutral zone, the %K line is above the %D line, which indicates the bullish sentiment.

Trading recommendations
  • Support levels: 107.05, 106.75, 106.45
  • Resistance levels: 107.40, 107.75

If the price fixes above the resistance level of 107.40, USD/JPY quotes are expected to rise. The movement is tending to 107.70-108.00.

An alternative could be a decrease in the USD/JPY currency pair to 106.80-106.60.

by JustForex

The Dollar Index Has Become Stable. The Conflict Between Washington and Beijing Has Escalated Again

by JustForex

On Friday, the US currency fell against a basket of currency majors. The US dollar index (#DX) closed in the negative zone (-0.07%). At the end of the week, ambiguous US economic statistics were published. On Thursday, the number of initial jobless claims was published, which has exceeded expected values again. So, the indicator counted to 2.981K, while experts forecasted 2.500K. On Friday, a report on retail sales was published, which fell by -16.4% instead of the expected decline by -12.0%.

China intends to take measures to protect the interests of Chinese companies in response to US actions. China calls on the United States to immediately stop speculating and create normal conditions for trade and cooperation between enterprises. China is determined to protect the legitimate interests of Chinese companies.

The “black gold” prices are rising. Currently, futures for the WTI crude oil are testing the $30.95 mark per barrel.

Market indicators

On Friday, there was the bullish sentiment in the US stock market: #SPY (+0.46%), #DIA (+0.07%), #QQQ (+0.65%).

The 10-year US government bonds yield has increased slightly. At the moment, the indicator is at the level of 0.64-0.65%.

The news feed on 2020.05.18:
  • According to preliminary data, Japan’s GDP fell by 0.9% (q/q) in the first quarter. Experts expected a decrease by 1.2%.

by JustForex