WTI Oil, ThyssenKrupp, Arconic & Brookfield lead Weekly Top Gainers/Losers

By IFCMarkets

Top Gainers – The World Market

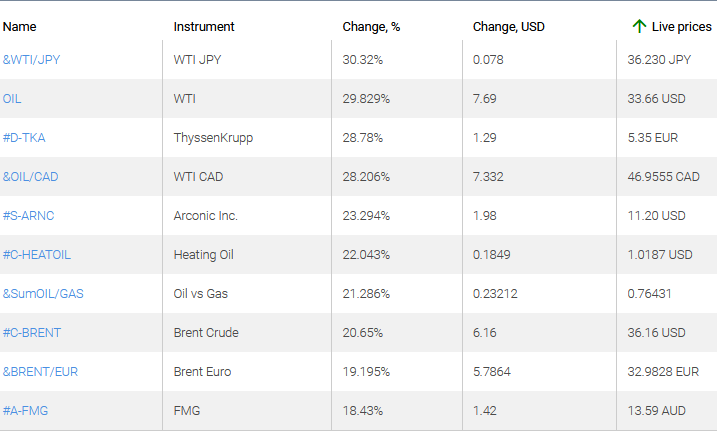
World oil prices continued to rise and oil-based instruments appeared among the leaders of growth. Currencies of commodity-dependent countries such as Australia, New Zealand, Canada, Mexico, South Africa were in high demand.

1. &WTI/JPY – a personal oil composite instrument WTI in Japanese yen.

2. Light Sweet Crude Oil (WTI) – American crude oil..

market sentiment ratio long short positions

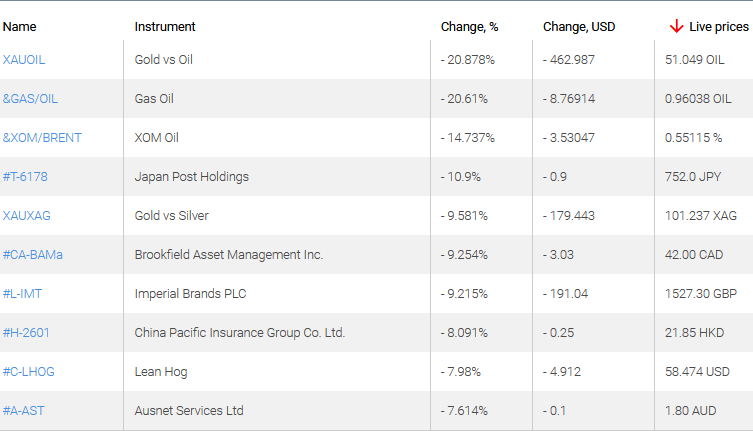
 Top Losers – The World Market

1. XAUOIL – a gold instrument Gold against WTI oil.

2. &GAS/OIL – a personal composite instrument the US natural gas against the US oil

market sentiment ratio long short positions

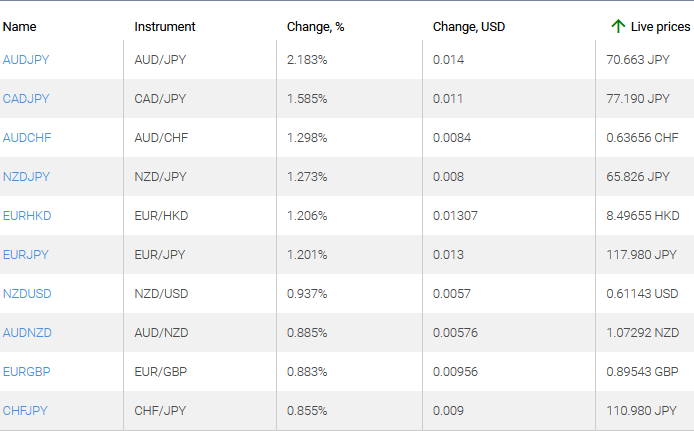
 Top Gainers – Foreign Exchange Market (Forex)

1. AUDJPY, CADJPY – the growth of these charts means the weakening of the Japanese yen against the Australian and Canadian dollars.

2. AUDCHF, NZDJPY – the growth of these charts means the strengthening of the Australian dollar against the Swiss franc and the strengthening of the New Zealand dollar against the Japanese yen.

market sentiment ratio long short positions

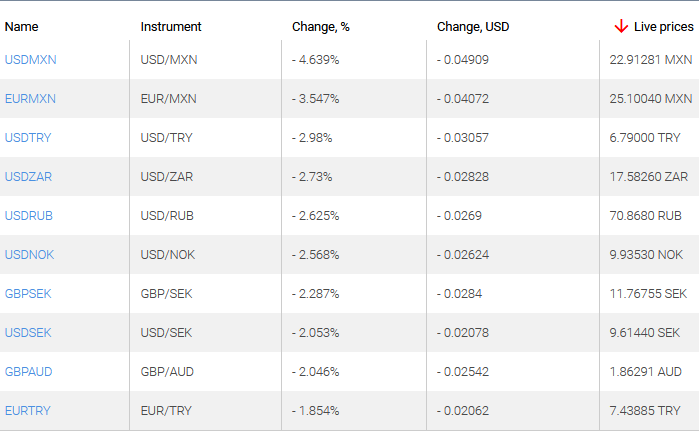
 Top Losers – Foreign Exchange Market (Forex)

1. USDMXN, EURMXN – the decrease of these charts means the strengthening of the Mexican peso against the US dollar and the euro.

2. USDZAR, USDTRY – the decrease of these charts means the weakening of the US dollar against the South African rand and Turkish lira.

market sentiment ratio long short positions

Market Analysis provided by IFCMarkets

Note:
This overview has an informative and tutorial character and is published for free. All the data, included in the overview, are received from public sources, recognized as more or less reliable. Moreover, there is no guarantee that the indicated information is full and precise. Overviews are not updated. The whole information in each overview, including opinion, indicators, charts and anything else, is provided only for familiarization purposes and is not financial advice or а recommendation. The whole text and its any part, as well as the charts cannot be considered as an offer to make a deal with any asset. IFC Markets and its employees under any circumstances are not liable for any action taken by someone else during or after reading the overview.

Markets hammered by geopolitical tensions

By Lukman Otunuga, Research Analyst, ForexTime

A darker mood engulfed financial markets on Friday as investors braced for more geopolitical tensions and drama between the United States and China

In a move that rattled global sentiment, China announced plans to impose a national security law on Hong Kong which earned a sharp rebuke from Washington. With US-China trade tensions adding to the horrible bucket list of negative themes draining investor confidence, stock markets could be instore for further pain in the week ahead.

Pound can’t catch a breath as retail sales tumble 

Buying sentiment towards the British Pound evaporated after UK retail sales tumbled by their biggest fall on record in April.

The volume of retail sales in the United Kingdom dropped a staggering 18.1% last month, dwarfing the 5.2% drop witnessed in March. With sales expected to remain depressed amid the change in spending habits and unfavourable macroeconomic conditions, Sterling could remain an easy target for anxious investors.

Looking at the technical picture, the GBPUSD is trending lower on the daily charts. A breakdown below the 1.2200 support level may open a path back towards 1.2000 which is 200 pips away. Alternatively, the GBPUSD could retest 1.2285 if 1.2200 proves to be a reliable support.

EURGBP eyes 0.9000

The impacts of a weaker Pound are being reflected in the EURGBP as the currency pair makes its way towards 0.9000.

With the outlook for Sterling clouded by Brexit uncertainty and disappointing economic data, the EURGBP is positioned to push higher. Looking at the technical standpoint, a solid daily close above 0.9000 could inspire a move towards 0.9120.

Alternatively, sustained weakness below 0.9000 may open a path back towards 0.8850.

USDCAD remains range-bound

Expect the Canadian Dollar hold its ground against G10 currencies thanks to appreciating Oil prices.

If the Canadian Dollar appreciates in the week ahead, the USDCAD may break above the 1.4050 resistance level with the next point of interest at 1.4250.

Alternatively, sustained weakness below 1.4050 should signal a move towards 1.3850.

Gold poised to shine on geopolitics  

It was a choppy week for Gold as investors juggled with conflicting themes influencing appetite towards the precious metal.

A wave of optimism over a potential coronavirus vaccine weakened the commodity earlier in the week before renewed US-China trade tensions and global growth fears rekindled widespread risk aversion. Investors still remain guarded and on high alert amid growth fears and geopolitical tensions, and this should accelerate the flight to safe-haven destinations like Gold in the week ahead.

Looking at the technical picture, a solid breakout above $1745 may open the doors towards $1760. Alternatively, a move back below $1715 could trigger a decline towards $1680.

Disclaimer: The content in this article comprises personal opinions and should not be construed as containing personal and/or other investment advice and/or an offer of and/or solicitation for any transactions in financial instruments and/or a guarantee and/or prediction of future performance. ForexTime (FXTM), its affiliates, agents, directors, officers or employees do not guarantee the accuracy, validity, timeliness or completeness, of any information or data made available and assume no liability as to any loss arising from any investment based on the same.


Forex-Time-LogoArticle by ForexTime

ForexTime Ltd (FXTM) is an award winning international online forex broker regulated by CySEC 185/12 www.forextime.com

GBPUSD Analysis: Steeper than forecast decline in UK retail sales bearish for GBPUSD

By IFCMarkets

Steeper than forecast decline in UK retail sales bearish for GBPUSD

UK retail sales fell in April more than expected: retail sales dropped in April 18.1% over month after 5.2% decline in March, when 15.8% decline was expected. This is bearish for GBPUSD.

IndicatorVALUESignal
RSINeutral
MACDSell
Donchian ChannelSell
MA(200)Sell
FractalsSell
Parabolic SARSell


Summary of technical analysis

OrderSell
Buy stopBelow 1.2158
Stop lossAbove 1.2228

Market Analysis provided by IFCMarkets

Meet the struggling gold miners who are missing out on boom in the precious metal

By Sara Geenen, University of Antwerp and Boris Verbrugge, University of Antwerp

In Mukungwe, Democratic Republic of Congo, thousands of young men and women live in makeshift huts. They have no access to sanitation or health facilities. They work as manual drillers, carriers or timber specialists in narrow underground tunnels, which exposes them to everything from toxic metals to cave-ins and even suffocation.

They work in teams under different agreements with a local paymaster, sometimes sharing what they find, sometimes receiving a wage or payments in kind. Outside the pits, others work as rock crushers, water carriers, washers or cooks. Small buyers lurk around with hand-held scales, using old coins and toothpicks to weigh the gold. For miners lucky enough to extract a little precious metal, there are dollars to be made from the dust.

In the Philippines, men, women and children work underground. They pan for gold in rivers and creeks, or use hydraulic hoses to extract gold-bearing sediments. Young men even dive for gold in narrow pitch-dark shafts at the bottom of rivers and the ocean.

This is artisanal or small-scale gold mining (ASGM), which supports tens of millions worldwide. ASGM is a broad catch-all term for practices with two things in common: very labour-intensive work and only partial government regulation at best. This guarantees cheap and flexible workers, which drives down the cost of production.

Yet there’s nothing marginal about this mining. The likes of the garimpeiro in Brazil or Mozambique, galamsey in Ghana and ninja miners in Mongolia are often the backbone of local economies. They target small, diffuse deposits that are unprofitable for multinationals, or difficult to reach because of physical or political conditions. As we argue in our recent book, they supply at least one-fifth of all newly mined gold.

Gold mining and coronavirus

This mining is connected to global gold markets through multi-layered trading-networks. From the small buyer hanging around the mines, to the master trader moving gold across the border, to the sourcing agent sent by the Swiss refinery, supply chains are long and complex. Yet there is typically little difference between the global spot price of gold and the going rate outside the mine.

In theory, this puts sellers in a strong position now that gold prices are at eight-year highs. It could be a golden opportunity for those who finance these operations, which can be anyone from veteran miners to paramilitaries, but mine workers are not necessarily benefiting.

They are particularly vulnerable to coronavirus, since there is no social distancing in crowded mining tunnels. Many already have badly damaged lungs, and little access to doctors – let alone publicly funded healthcare.

Mining communities often depend on imported goods. Our contacts tell us that in mining areas in the Democratic Republic of the Congo, basic food prices have risen fivefold.

Then there is lockdown disruption. In some areas of the Philippines, for example, frantic government efforts to combat the virus are preventing miners and buyers from reaching mines. Exporters are stockpiling gold at international airports, waiting for commercial flights to resume and for Middle Eastern and Indian gold bazaars to reopen.

Thanks to this combination of soaring gold prices, supply chain restrictions and cash shortages, the difference between local and global gold prices has widened. In Burkina Faso, Sierra Leone and Peru, it is as much as 40%. Our contacts say that in parts of the Philippines, it exceeds 60%.

For gold traders with cash reserves and the skills and contacts to circumvent pandemic restrictions, this is a lifetime opportunity. In the African Great Lakes region, the NGO Impact reports on rich dealers using private jets to buy cheap gold.

Such buyers are often backed by high-level politicians and military and non-state armed groups. Mine workers often have little choice but to accept highly unequal terms of trade. These times expose the inequalities in the market, and the vulnerabilities of those doing the dirty work.

What should be done?

On the health front, governments must raise COVID-19 awareness and prevent it spreading in these communities. They should continue working with donors to encourage mining practices that limit people’s dust intake and exposure to toxic metals. Together, they need to develop public healthcare systems that extend to these informal workers.

Governments also need to restore miners’ access to the global market, perhaps buying ASGM gold even on a tax-free, no-questions-asked basis. Admittedly, state gold-buying programmes are tricky, as demonstrated in the Philippines, where all production is supposed to be bought and refined by the central bank, but traders have long smuggled gold to Hong Kong.

Governments could also build on responsible sourcing initiatives by the likes of the Responsible Jewellery Council and London Bullion Market Association. These only allow sourcing from “legitimate ASGM” that is tax-registered and formally regulated, or at least undertakes “good faith efforts” to operate legally.

Yet with complex supply chains and proving the origin of the gold difficult, these initiatives may push refineries to ignore small-scale mining altogether. These initiatives also detract from what arguably matters most: the unhealthy and exploitative conditions in most ASGM.

Instead, governments could push a more pragmatic solution, such as the Alliance for Responsible Mining’s CRAFT code, which doesn’t require miners to be part of a formal organisation, while also emphasising safety.

Responsible sourcing initiatives should prioritise working with governments and local organisations to improve public infrastructure and services in these mines. They should facilitate miners’ access to safe mining technologies and the financial services so that they can invest in them. Small-scale mining sustains millions of people: with so much else for governments to worry about, keeping these communities thriving should be the main priority.

About the Author:

Sara Geenen, Assistant professor in Globalisation, International Development and Poverty, University of Antwerp and Boris Verbrugge, Post-doctoral Researcher in Development Studies, University of Antwerp

This article is republished from The Conversation under a Creative Commons license. Read the original article.
 

Forex Technical Analysis & Forecast 22.05.2020

Article By RoboForex.com

EURUSD, “Euro vs US Dollar”

EURUSD is trading downwards to reach 1.0922. Later, the market may correct towards 1.0969 and then resume trading inside the downtrend with the target at 1.0840.

EURUSD
Risk Warning: the result of previous trading operations do not guarantee the same results in the future

GBPUSD, “Great Britain Pound vs US Dollar”

GBPUSD continues falling towards 1.2170. After that, the instrument may correct to reach 1.2222 and then continue trading downwards with the first target at 1.2100.

GBPUSD
Risk Warning: the result of previous trading operations do not guarantee the same results in the future

USDRUB, “US Dollar vs Russian Ruble”

USDRUB has extended the descending wave down to 70.70; right now, it is consolidating below this level. Today, the pair may correct towards 72.60 to test it from below and then resume trading inside the downtrend with the target at 69.44.

USDRUB
Risk Warning: the result of previous trading operations do not guarantee the same results in the future

USDJPY, “US Dollar vs Japanese Yen”

USDJPY is moving downwards to break 107.30. After that, the instrument may continue falling with the short-term target at 106.66.

USDJPY
Risk Warning: the result of previous trading operations do not guarantee the same results in the future

USDCHF, “US Dollar vs Swiss Franc”

After breaking 0.9700 to the upside, USDCHF is expected to continue growing towards 0.9737. Later, the market may start a new correction to reach 0.9696 and then form one more ascending structure with the first target at 0.9750.

USDCHF
Risk Warning: the result of previous trading operations do not guarantee the same results in the future

AUDUSD, “Australian Dollar vs US Dollar”

After reaching the downside target at 0.6533, AUDUSD is expected to consolidate above this level. If later the price breaks this range to the upside, the market may start a new correction to reach 0.6575; if to the downside – form a new descending structure with the target at 0.6478.

AUDUSD
Risk Warning: the result of previous trading operations do not guarantee the same results in the future

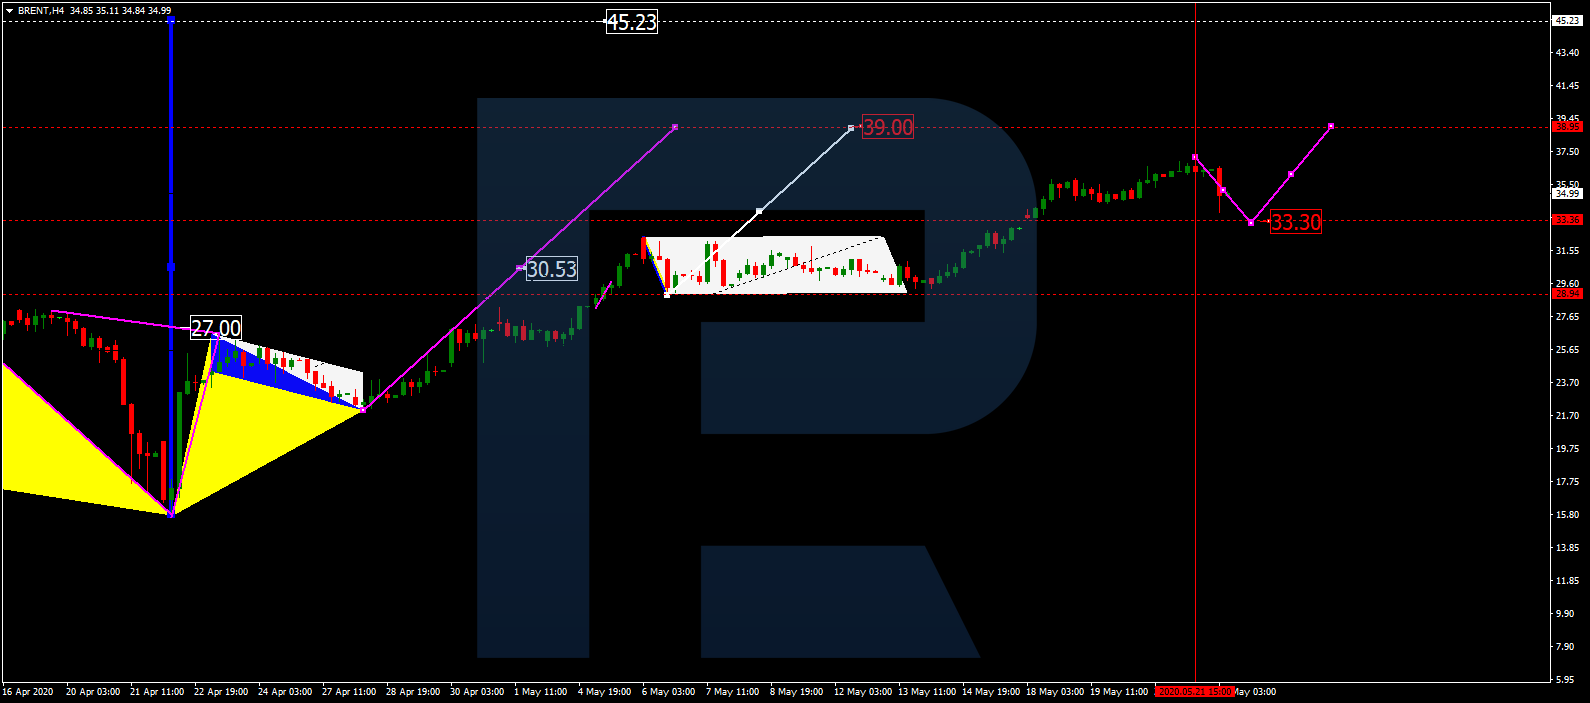
BRENT

Brent is correcting towards 33.33. After that, the instrument may resume trading upwards with the short-term target at 39.00 and then start another correction towards 32.50.

BRENT
Risk Warning: the result of previous trading operations do not guarantee the same results in the future

XAUUSD, “Gold vs US Dollar”

After finishing the descending wave at 1721.80, Gold is expected to form one more ascending wave to reach 1737.20 (at least). After that, the instrument may start a new decline towards 1710.10 and complete a Flag correctional pattern.

GOLD
Risk Warning: the result of previous trading operations do not guarantee the same results in the future

BTCUSD, “Bitcoin vs US Dollar”

After completing the correction at 8888.80, BTCUSD is expected to consolidate near the lows. If later the price breaks this range to the upside, the market may start a new growth to break 9500.00 and then continue trading upwards with the target at 10150.00; if to the downside – form a new descending structure to reach 8300.00.

BITCOIN
Risk Warning: the result of previous trading operations do not guarantee the same results in the future

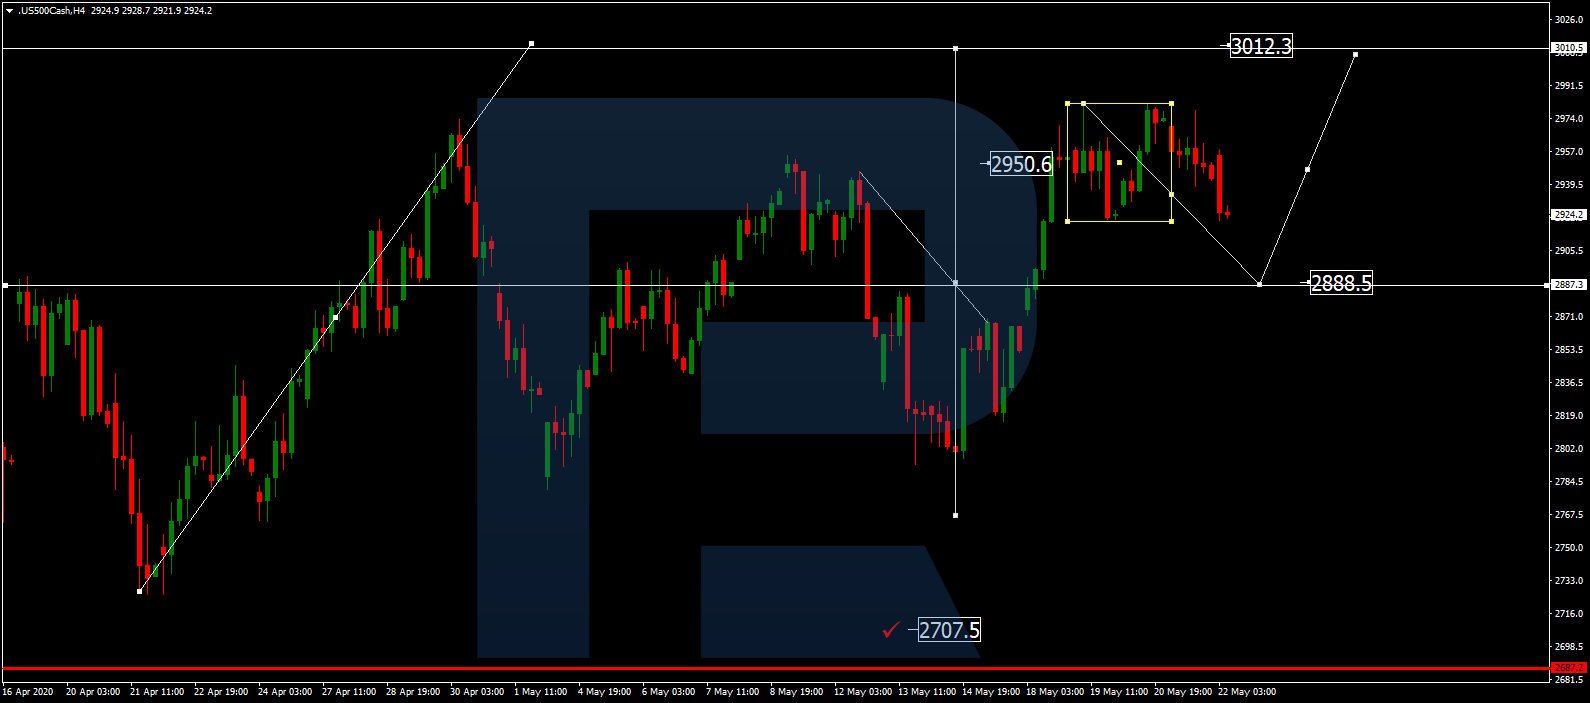
S&P 500

The Index is consolidating not far from the downside border. Possibly, the pair may break 2920.0 downwards and start a new correction to reach 2888.5. Later, the market may form one more ascending structure with the target at 3012.5.

S&P 500

Article By RoboForex.com

Attention!
Forecasts presented in this section only reflect the author’s private opinion and should not be considered as guidance for trading. RoboForex LP bears no responsibility for trading results based on trading recommendations described in these analytical reviews.

Fibonacci Retracements Analysis 22.05.2020 (BITCOIN, ETHEREUM)

Article By RoboForex.com

BTCUSD, “Bitcoin vs US Dollar”

As we can see in the H4 chart, some time ago, BTCUSD attempted to reach the high and tried to stay close to it for a while. However, bulls were not strong enough to continue pushing the asset upwards, and, as a result, the instrument started a new decline towards 23.6% fibo. In the nearest future, the price is expected to continue falling to reach 38.2%, 50.0%, and 61.8% fibo at 7727.00, 7002.00, and 627800 respectively.

BTCUSD_H4
Risk Warning: the result of previous trading operations do not guarantee the same results in the future

The H1 chart shows more detailed structure of the current correctional wave. We can see that the wave is approaching 23.6% fibo.

BTCUSD_H1
Risk Warning: the result of previous trading operations do not guarantee the same results in the future

ETHUSD, “Ethereum vs. US Dollar”

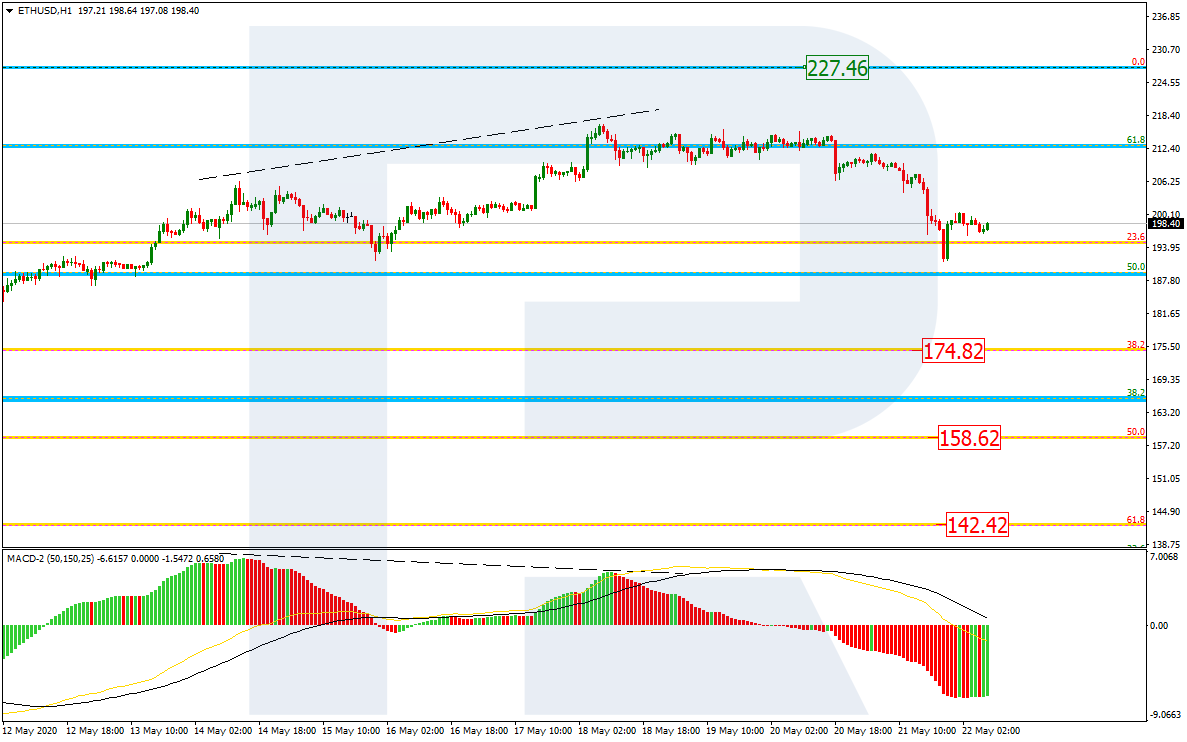
As we can see in the H4 chart, after re-testing 61.8% fibo and rebounding it, ETHUSD has failed to reach the high at 227.46; right now, it is moving downwards. After reaching 23.6% fibo, the descending wave may continue towards 38.2%, 50.0%, and 61.8% fibo at 174.82, 158.62, and 142.42 respectively.

ETHUSD_H4
Risk Warning: the result of previous trading operations do not guarantee the same results in the future

In the H1 chart, the divergence made the pair fall and reach 23.6% once again.

ETHEREUM_H1

Article By RoboForex.com

Attention!
Forecasts presented in this section only reflect the author’s private opinion and should not be considered as guidance for trading. RoboForex LP bears no responsibility for trading results based on trading recommendations described in these analytical reviews.

Demand for Risky Assets Has Weakened due to Tensions Between the US and China

by JustForex

The US currency has been growing against a basket of currency majors. The US dollar index (#DX) closed in the positive zone (+0.27%). The growing tension between the US and China after the PRC announced its intention to consider the Hong Kong national security bill, is in the spotlight. This bill provides for a ban on separatist activities and is aimed at countering terrorism and any outside interference. In turn, the United States has prepared a bill imposing sanctions against Chinese officials and organizations that monitor compliance with national security laws in Hong Kong.

Yesterday, ambiguous US economic data were published. The number of initial jobless claims has risen by 2,438K again, while experts predicted an increase by 2,400K. However, previous data was revised upwards from 2,981 K to 2,687 K. Philadelphia Fed manufacturing index fell by 43.1 instead of 41.5.

The “black gold” prices are consolidating. Currently, futures for the WTI crude oil are testing the $32.05 mark per barrel.

Market indicators

Yesterday, there was the bearish sentiment in the US stock market: #SPY (-0.69%), #DIA (-0.29%), #QQQ (-1.09%).

The 10-year US government bonds yield has declined. At the moment, the indicator is at the level of 0.64-0.65%.

The news feed on 2020.05.22:
  • – UK retail sales data at 09:00 (GMT+3:00);
    – ECB monetary policy meeting account at 14:30 (GMT+3:00);
    – Canada’s retail sales report at 15:30 (GMT+3:00).

by JustForex

Lean Hogs Analysis: Rising Chinese pork imports bullish for LHOG

By IFCMarkets

Rising Chinese pork imports bullish for LHOG

China’s pork deficit due to African Swine Fever (ASF) has resulted in rising Chinese pork imports. China imported 95,892 tons of US pork, up 250% from a year ago, according to the US Meat Export Federation. And while China is working to rebuild its pig herd, analysts estimate China’s pork imports will continue to rise this year. China’s reported Q1 pork imports are up 118% to nearly 1.2 million tons. The US accounts for 23% while the EU remains the primary supplier with a 61% market share. Rising Chinese imports are bullish for LHOG. However, US pork prices are pressured by increasing supply as meat processing plants restart after covid-19 shutdowns. At the same time demand is lower despite coming Memorial Day holiday next Monday. American pork slaughterhouses were operating through Wednesday at 85% of year ago levels as workers returned to plants. Wholesale pork prices climbed for the first time in four days but are still 18% below a five-year high of $121.66 per 100 pounds, according to US Department of Agriculture. Rising US supply and lower demand are downside risk for pork.

IndicatorVALUESignal
RSINeutral
MACDBuy
Donchian ChannelNeutral
MA(200)Buy
FractalsNeutral
Parabolic SARBuy


Summary of technical analysis

OrderBuy
Buy stopAbove 58.73
Stop lossBelow 55.74

Market Analysis provided by IFCMarkets

The Analytical Overview of the Main Currency Pairs on 2020.05.22

by JustForex

The EUR/USD currency pair

Technical indicators of the currency pair:
  • Prev Open: 1.09794
  • Open: 1.09493
  • % chg. over the last day: -0.26
  • Day’s range: 1.09065 – 1.09573
  • 52 wk range: 1.0777 – 1.1494

EUR/USD quotes have been declining. The euro has updated local lows. Demand for risky assets has weakened amid a new wave of tension between Washington and Beijing. Donald Trump said the United States would react “very strongly” if China imposed national security laws in Hong Kong in response to last year’s democratic protests. The US Senate also passed a bill that allows the delisting of Chinese companies from stock exchanges. At the moment, the EUR/USD currency pair is consolidating in the range of 1.0900-1.0940. We expect the ECB meeting account. A trading instrument has the potential for further decline. We recommend opening positions from key levels.

The Economic News Feed for 22.05.2020:
    • At 14:30 (GMT+3:00), the ECB monetary policy meeting account will be published.
EUR/USD

Indicators do not give accurate signals: the price has fixed between 50 MA and 100 MA.

The MACD histogram is in the negative zone and below the signal line, which gives a strong signal to sell EUR/USD.

Stochastic Oscillator is in the neutral zone, the %K line has crossed the %D line. There are no signals at the moment.

Trading recommendations
      • Support levels: 1.0900, 1.0875, 1.0840
      • Resistance levels: 1.0940, 1.0975, 1.1000

If the price fixes below the round level of 1.0900, a further fall in EUR/USD quotes is expected. The movement is tending to 1.0875-1.0840.

An alternative could be the growth of EUR/USD quotes to 1.0970-1.0990.

The GBP/USD currency pair

Technical indicators of the currency pair:
  • Prev Open: 1.22340
  • Open: 1.22153
  • % chg. over the last day: -0.13
  • Day’s range: 1.21624 – 1.22334
  • 52 wk range: 1.1466 – 1.3516

The bearish sentiment prevails on the GBP/USD currency pair. Quotes have updated local lows. At the moment, the trading instrument is testing the support level of 1.2160. The 1.2210 mark is the nearest resistance. The demand for risky assets is still low. The British pound is under pressure due to a weak report on retail sales in the UK. We do not exclude a further drop in GBP/USD quotes. We recommend opening positions from key levels.

GBP/USD

Indicators do not give accurate signals: 50 MA has crossed 100 MA.

The MACD histogram has started declining, which indicates the development of a negative trend on the GBP/USD currency pair.

Stochastic Oscillator is in the neutral zone, the %K line is below the %D line, which indicates the bearish sentiment.

Trading recommendations
  • Support levels: 1.2160, 1.2120, 1.2075
  • Resistance levels: 1.2210, 1.2245, 1.2290

If the price fixes below 1.2160, a further drop in GBP/USD quotes is expected. The movement is tending to the round level of 1.2100.

An alternative could be the growth of the GBP/USD currency pair to 1.2240-1.2280.

The USD/CAD currency pair

Technical indicators of the currency pair:
  • Prev Open: 1.39005
  • Open: 1.39549
  • % chg. over the last day: +0.38
  • Day’s range: 1.39412 – 1.40350
  • 52 wk range: 1.2949 – 1.4668

The USD/CAD currency pair has been growing after a prolonged consolidation. During yesterday’s and today’s trading sessions, the growth of quotes has exceeded 130 points. At the moment, USD/CAD quotes are testing the “mirror” resistance of 1.4035. The 1.3990 mark is the nearest support. Investors have taken a wait-and-see attitude before the report on retail sales in Canada. We also recommend paying attention to the dynamics of “black gold” prices. Positions should be opened from key levels.

At 15:30 (GMT+3:00), data on retail sales will be published in Canada.

USD/CAD

Indicators do not give accurate signals: the price has crossed 100 MA.

The MACD histogram is in the positive zone and above the signal line, indicating the bullish sentiment.

Stochastic Oscillator is in the overbought zone, the %K line has crossed the %D line. There are no signals at the moment.

Trading recommendations
  • Support levels: 1.3990, 1.3960, 1.3910
  • Resistance levels: 1.4035, 1.4065, 1.4100

If the price fixes above 1.4035, further growth of the USD/CAD quotes is expected. The movement is tending to 1.4065-1.4100.

An alternative could be a decrease in the USD/CAD currency pair to 1.3970-1.3940.

The USD/JPY currency pair

Technical indicators of the currency pair:
  • Prev Open: 107.473
  • Open: 107.634
  • % chg. over the last day: +0.09
  • Day’s range: 107.322 – 107.763
  • 52 wk range: 101.19 – 112.41

The technical pattern is still ambiguous on the USD/JPY currency pair. The trading instrument is in a sideways trend. At the moment, the local support and resistance levels are 107.35 and 107.65, respectively. The demand for “safe-haven” currencies has grown significantly. USD/JPY quotes are tending to decline. Positions should be opened from key levels.

The Bank of Japan will allocate about $279 billion to support the small business affected by the COVID-19 epidemic and prevent a recession in the economy.

USD/JPY

Indicators do not give accurate signals: the price has fixed between 50 MA and 100 MA.

The MACD histogram has moved into the negative zone, indicating the bearish sentiment.

Stochastic Oscillator is in the neutral zone, the %K line is above the %D line, which gives a signal to buy USD/JPY.

Trading recommendations
  • Support levels: 107.35, 107.10, 106.80
  • Resistance levels: 107.65, 107.85, 108.05

If the price fixes below 107.35, USD/JPY quotes are expected to fall. The movement is tending to 107.10-106.80.

An alternative could be the growth of the USD/JPY currency pair to 107.90-108.10.

by JustForex

Geopolitics gatecrashes risk-on party

By Han Tan, Market Analyst, ForexTime

The heightened uncertainties in the markets are causing further ventures into riskier waters to pause for breath, after what has been a bumpy ride for risk assets this week. Asian currencies are now weaker against the US Dollar as regional stocks are adding to Thursday’s losses, with Hong Kong’s Hang Seng index leading the decline. US equity futures are also in the red while US Treasury yields are lower by 4.3 percent. Gold is climbing back towards the $1730 handle and the Yen is advancing against all of its G10 and Asian peers.

Geopolitical risks are threatening to gatecrash an already-tense ‘risk party’ among global investors who have only just begun nibbling at the appetitisers. This craving could be soured by the prospects of escalating tensions between Washington and Beijing, be it over the coronavirus pandemic or plans to impose a new security law on Hong Kong. The recent gains in risk assets could be unwound should the ‘Tariff Man’ make a comeback or US-China capital flows be restricted at a time when the world economy is only managing its first tentative steps towards a post-lockdown recovery. China’s decision to forgo a GDP target for the year also speaks to the persistent uncertainties that markets have to contend with, which suggests that recent gains in riskier assets are on thin ice.

Although investors have been willing to look past the gloomy economic data so far, in the hope that the worst of the global pandemic has passed, such a view might be shattered if the barbs traded between the world’s two largest economies actually translate into actual policy action. Keep in mind also that Brexit risks are looming, with UK and EU negotiators set to resume talks on June 1. A sudden rise in the prospects of a no-deal Brexit would only add to the potency of downside risks and stir up market volatility.

In the interim, an extra dose of caution appears highly warranted.

Disclaimer: The content in this article comprises personal opinions and should not be construed as containing personal and/or other investment advice and/or an offer of and/or solicitation for any transactions in financial instruments and/or a guarantee and/or prediction of future performance. ForexTime (FXTM), its affiliates, agents, directors, officers or employees do not guarantee the accuracy, validity, timeliness or completeness, of any information or data made available and assume no liability as to any loss arising from any investment based on the same.


Forex-Time-LogoArticle by ForexTime

ForexTime Ltd (FXTM) is an award winning international online forex broker regulated by CySEC 185/12 www.forextime.com