Municipal bond yields show investors willing to pay premium for debt that addresses climate change

By Carolin Schellhorn, St. Joseph’s University

The Research Brief is a short take about interesting academic work.

The big idea

Municipal bond investors are increasingly confident that as climate change accelerates, cities will be forced to prioritize projects that seek to mitigate the consequences, according to a newly published analysis of bond yields I conducted.

The findings suggest investors believe such climate-related investments are safer – and more likely to be repaid – than other types of long-term city projects that may have less of a chance of happening because of limited funds. This can be seen in the higher prices – and lower rates of return – investors are willing to pay for longer-term municipal bonds certified by the Climate Bonds Initiative compared with similar debt that doesn’t carry that certification.

Why it matters

Cities and other governments have for years been fiercely debating what if anything to do about climate change. My research shows that there’s a reward, in terms of relatively low financing costs, to pursue long-term climate action now. It suggests investors have already acknowledged the consequences of human-induced climate change are real and have created a financial incentive for those cities that are trying to adapt. And this could help fuel a faster transition to a low-carbon world.

What still isn’t known

It’s unclear if this climate project premium holds for other types of debt, such as that issued by companies or federal governments. The market for Climate Bonds Initiative-certified bonds is still quite young, with about US$120 billion issued worldwide since 2014 – just a drop in the bucket for a bond market worth more than $100 trillion.

What other research is being done

Beyond the market that I looked at, there is a much larger market for self-labeled “green” and climate-aligned bonds that are not certified. Researchers are trying to determine if investors are willing to pay a premium – dubbed a “greenium” – when bonds are issued by corporations or governments to fund any environmental or climate-related projects. Currently, the results have been inconclusive, as different studies have reported conflicting results. If a premium on all green and climate-aligned bonds exists, this would supply further evidence of an investor subsidy provided to borrowers who claim to use their proceeds for environmental or climate-related purposes.

About the Author:

Carolin Schellhorn, Assistant Professor of Finance, St. Joseph’s University

This article is republished from The Conversation under a Creative Commons license. Read the original article.


 

Stock markets are unbalanced, investors warned

By George Prior

Wall Street is unbalanced, and investors are in danger of becoming complacent, warns the CEO of one of the world’s largest independent financial advisory and fintech organizations.

The warning from deVere Group’s Nigel Green comes as U.S. stock futures indicate another strong open Tuesday for Wall Street following a long holiday weekend.

Mr Green says: “Wall Street and other stock indices around the world have been, in general terms, rallying in recent weeks as investors jump on fresh Covid-19 vaccine optimism and signals that global economies are beginning to be revived.

“There’s an over-riding and far-reaching bullish sentiment in stock markets. However, there are bonafide concerns that investors are in danger of becoming complacent.

“This is because the headline figures of rallying markets are not the best barometers of the economy right now. The upswing on Wall Street, for example, is being driven by a handful of companies all within the same sector: tech.”

He continues: “This global economic downturn is different to others as there are clear winners and losers, whereas in previous ones it has been far less clear-cut and more a question of how much all firms were impacted.

“This one has produced enormous financial benefits for some, like tech, and left many struggling and others failing completely.”

The deVere CEO says that while the booming sectors such as tech, home entertainment and online retailers might “indicate what the future, post-pandemic economy looks like”, it doesn’t reflect underlying economic conditions – and this “could catch investors out.”

He notes: “Buying an exchange-traded fund, or ETF, which are investment funds traded on stock exchanges, could expose a client to a potentially unbalanced market.”

To navigate the markets when they aren’t reflecting the slew of current poor economic data, investors are urged to work with an experienced fund manager to help them “seek the significant opportunities but to mitigate potential risks.”

Mr Green concludes: “The firms which are ‘winners’ in this downturn are over-represented on many leading global indices, including the benchmark S&P500 index.

“As such, they do not necessarily serve as the ideal economic gauge for investment decisions.

“Investors must bear this imbalance in mind.”

About:

deVere Group is one of the world’s largest independent advisors of specialist global financial solutions to international, local mass affluent, and high-net-worth clients.  It has a network of more than 70 offices across the world, over 80,000 clients and $12bn under advisement.


Ichimoku Cloud Analysis 26.05.2020 (USDCAD, GBPUSD, USDJPY)

Article By RoboForex.com

USDCAD, “US Dollar vs Canadian Dollar”

USDCAD is trading at 1.3930; the instrument is moving below Ichimoku Cloud, thus indicating a descending tendency. The markets could indicate that the price may test Tenkan-Sen and Kijun-Sen at 1.3960 and then resume moving downwards to reach 1.3845. Another signal in favor of further downtrend will be a rebound from the descending channel’s upside border. However, the bearish scenario may no longer be valid if the price breaks the cloud’s upside border and fixes above 1.4010. In this case, the pair may continue growing towards 1.4095.

USDCAD
Risk Warning: the result of previous trading operations do not guarantee the same results in the future

GBPUSD, “Great Britain Pound vs US Dollar”

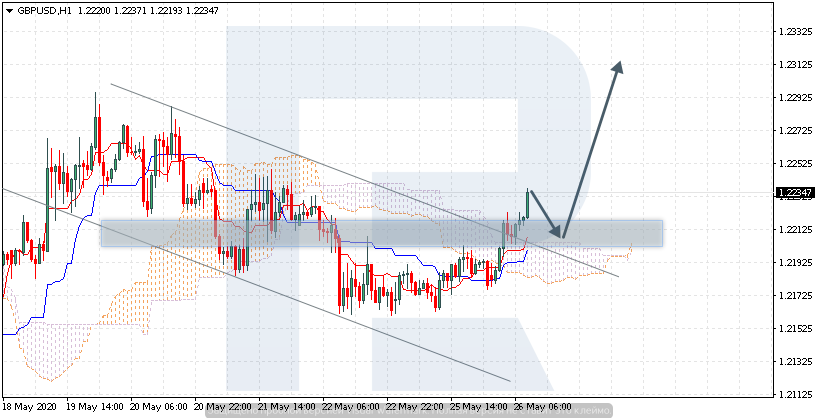
GBPUSD is trading at 1.2234; the instrument is moving above Ichimoku Cloud, thus indicating an ascending tendency. The markets could indicate that the price may test the cloud’s upside border at 1.2210 and then resume moving upwards to reach 1.2315. Another signal in favor of further uptrend will be a rebound from the support level. However, the bullish scenario may no longer be valid if the price breaks the cloud’s downside border and fixes below 1.2165. In this case, the pair may continue falling towards 1.2075.

GBPUSD
Risk Warning: the result of previous trading operations do not guarantee the same results in the future

USDJPY, “US Dollar vs Japanese Yen”

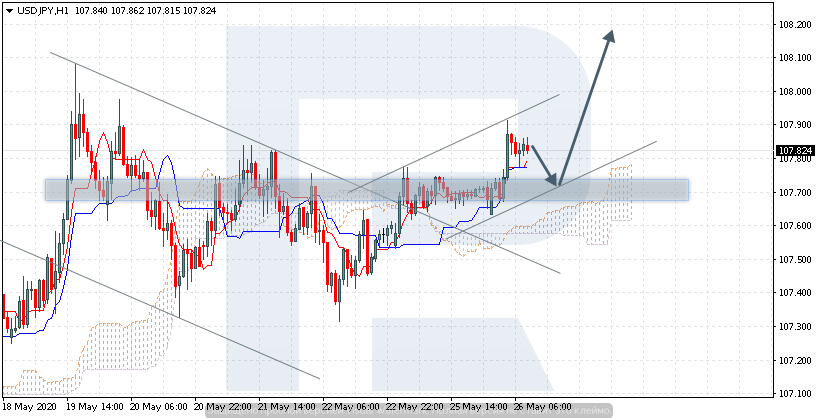
USDJPY is trading at 107.82; the instrument is moving above Ichimoku Cloud, thus indicating an ascending tendency. The markets could indicate that the price may test Tenkan-Sen and Kijun-Sen at 107.75 and then resume moving upwards to reach 108.25. Another signal is favor of further uptrend will be a rebound from the rising channel’s downside border. However, the bullish scenario may no longer be valid if the price breaks the cloud’s downside border and fixes below 107.50. In this case, the pair may continue falling towards 105.65.

USDJPY

Article By RoboForex.com

Attention!
Forecasts presented in this section only reflect the author’s private opinion and should not be considered as guidance for trading. RoboForex LP bears no responsibility for trading results based on trading recommendations described in these analytical reviews.

UK Lockdown To End As Death Toll Plummets?

By Orbex

Lowest UK COVID Deaths Since Lockdown Began

The UK registered its lowest number of daily deaths since the lockdown began on March 23rd yesterday. As of writing, 121 people were confirmed to have died from the virus.

Along with the drop in the death toll, the Department of Health in the UK announced that it had recorded its lowest daily number of new infections (1625) in nine weeks.

Together, these data points are encouraging the view that the lockdown has been effective in stopping the spread of the virus.

Lockdown to be Reviewed this Week

The UK lockdown is due to be reviewed this week. In light of the heavily reduced infection rate, it is likely to be eased further.

While an end to social distancing is not expected just yet, the UK PM is expected to announce the lifting of more business restrictions. This will allow for the return of hospitality businesses with outdoor areas.

Given the significant negative impact of the lock-downs on the UK economy, the further easing of measures will be cheered by investors as focus shifts towards the recovery. Last week, UK manufacturing data for May (flash PMI) came in above expectations, suggesting that the worst of the damage is behind us now.

Risks to the Recovery

However, there are still downside risks to be aware of. The biggest of these is the prospect of a second wave.

If the easing of lockdown measures results in the infection rate rising back up to R1 (1 other person infected for every person carrying the virus) this could easily result in lockdown measures being reintroduced. This would weigh heavily on the economy.

Aside from that issue, there are also concerns about how quickly activity will pick up even once businesses do reopen. Many polls suggest a great deal of reluctance among the public with regard to returning to pre-virus activity.

BOE Confirms Negative Rates Under Discussion 

The BOE has outlined its concern over the pace of the expected recovery. Indeed, the level of concern was reflected in comments made from the BOE governor last week, Andrew Bailey.

He said that negative rates were under “active review” for the first time in the BOE’s history. This comes just a week after the BOE said that negative rates were not under consideration. This suggests a dramatic increase in the BOE’s concern for the economy.

GBPNZD Holding At Major Support Level

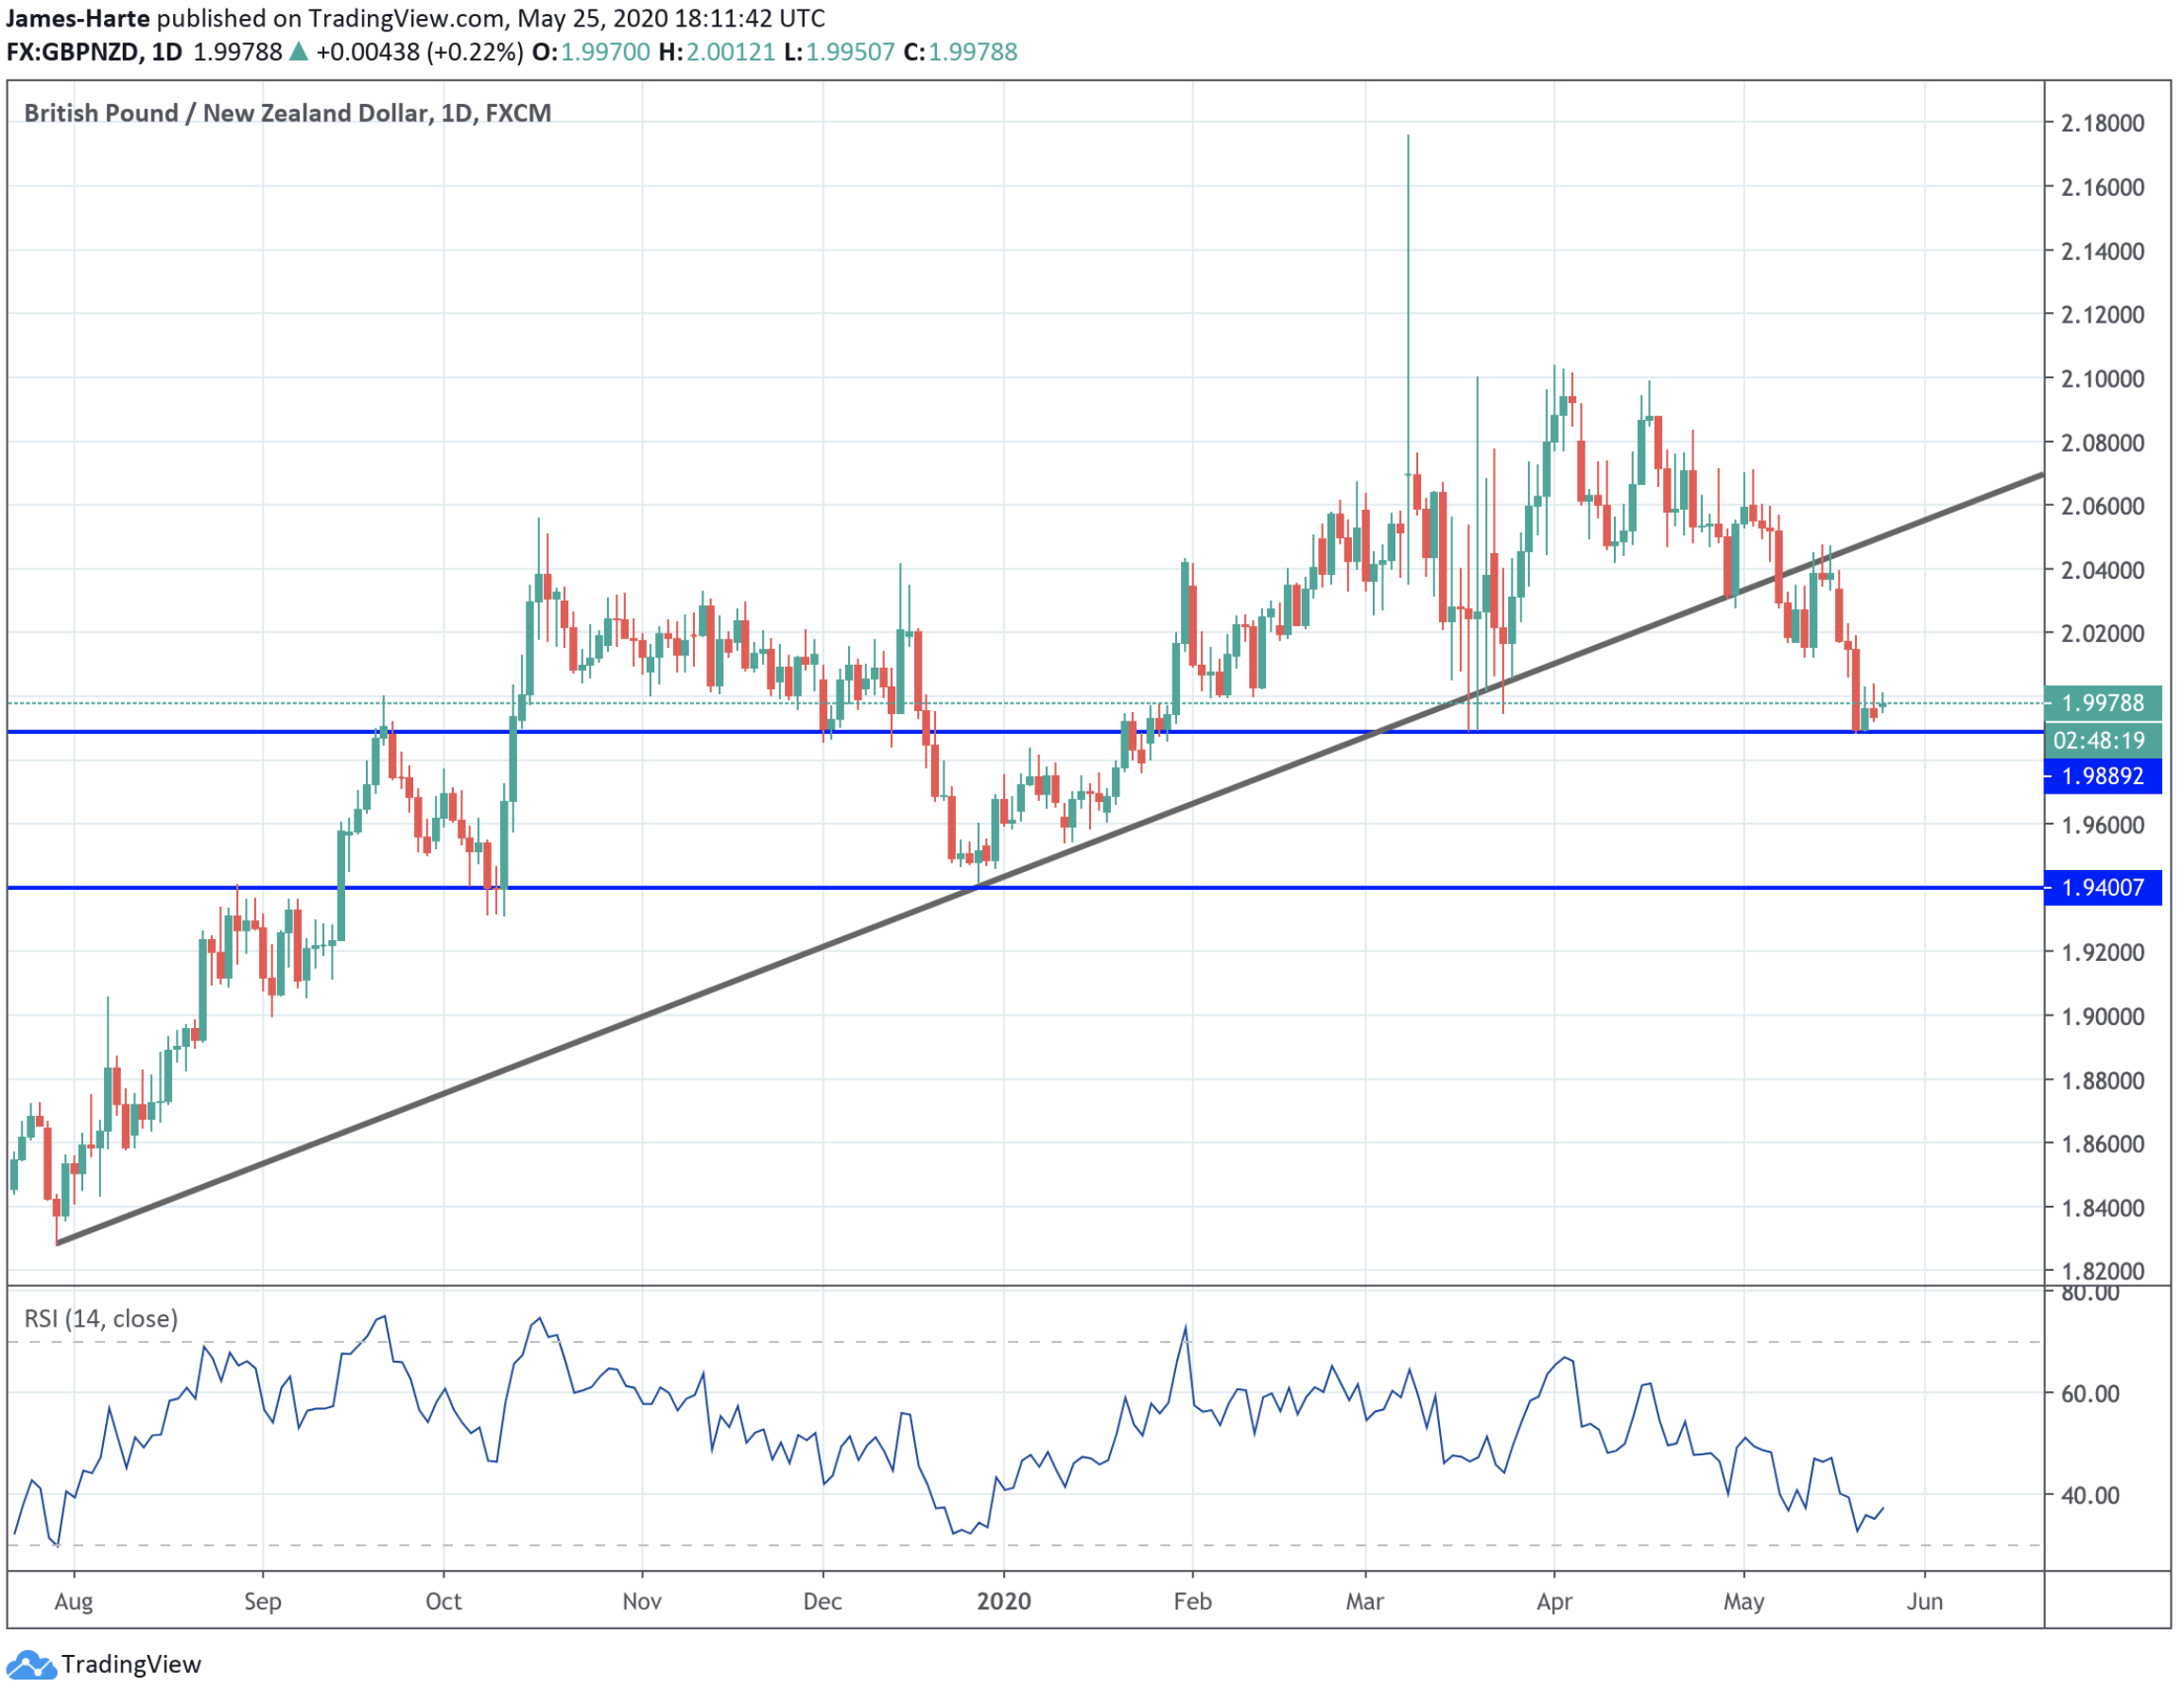
GBPNZD has been trending steadily lower following the sharp reversal from 2020 highs earlier in the year.

After breaking below the bullish trendline from mid-2020 lows, price is now sitting on the 1.9882 level support.

This is a key structural level that, if broken, will open up the way for a run down to deeper support at the 1.9400 level next, taking GBPNZD negative on the year.

By Orbex


Japanese Candlesticks Analysis 26.05.2020 (GOLD, NZDUSD, GBPUSD)

Article By RoboForex.com

XAUUSD, “Gold vs US Dollar”

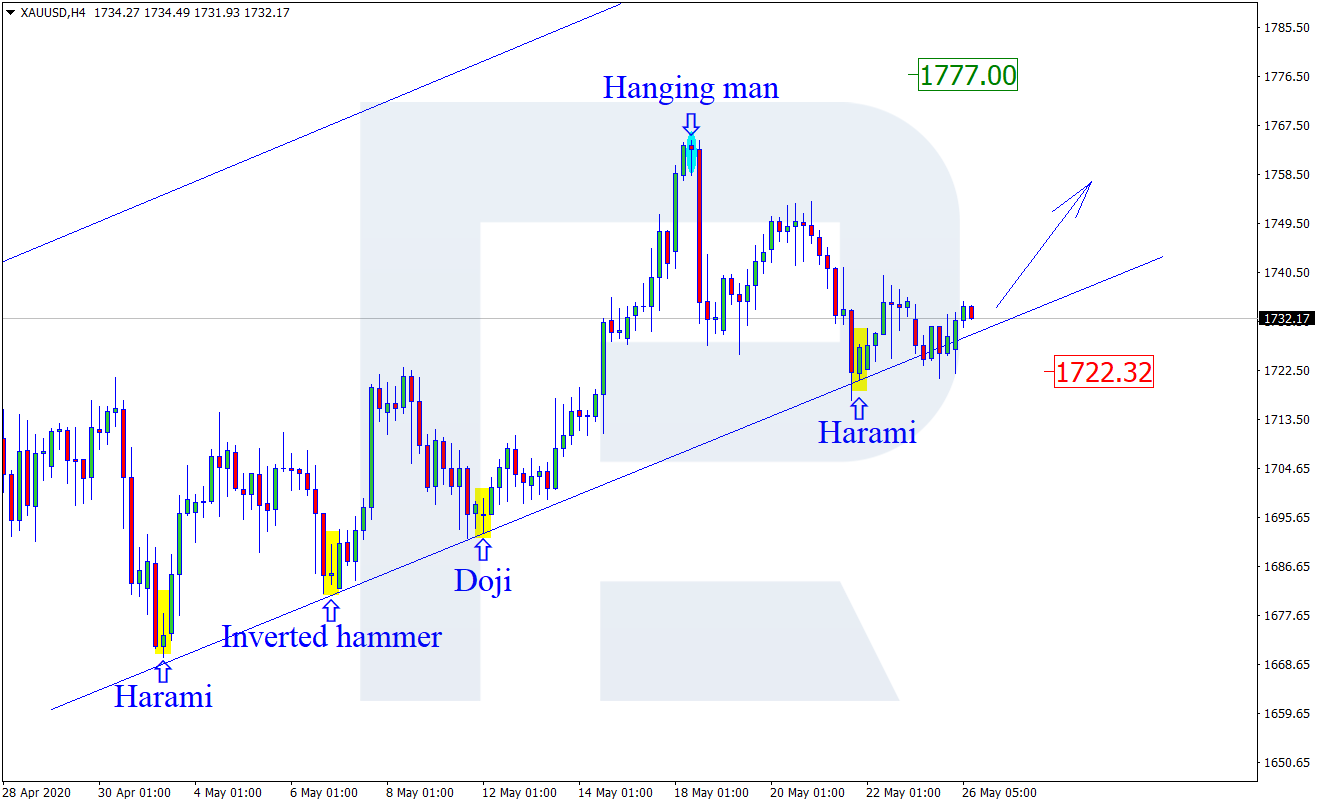
As we can see in the H4 chart, after forming several reversal patterns, including Harami, close to the rising channel’s downside border, XAUUSD is reversing. If later the price rebounds from the border, the uptrend may resume. In this case, the upside target may be at 1777.00.

XAUUSD
Risk Warning: the result of previous trading operations do not guarantee the same results in the future

NZDUSD, “New Zealand vs. US Dollar”

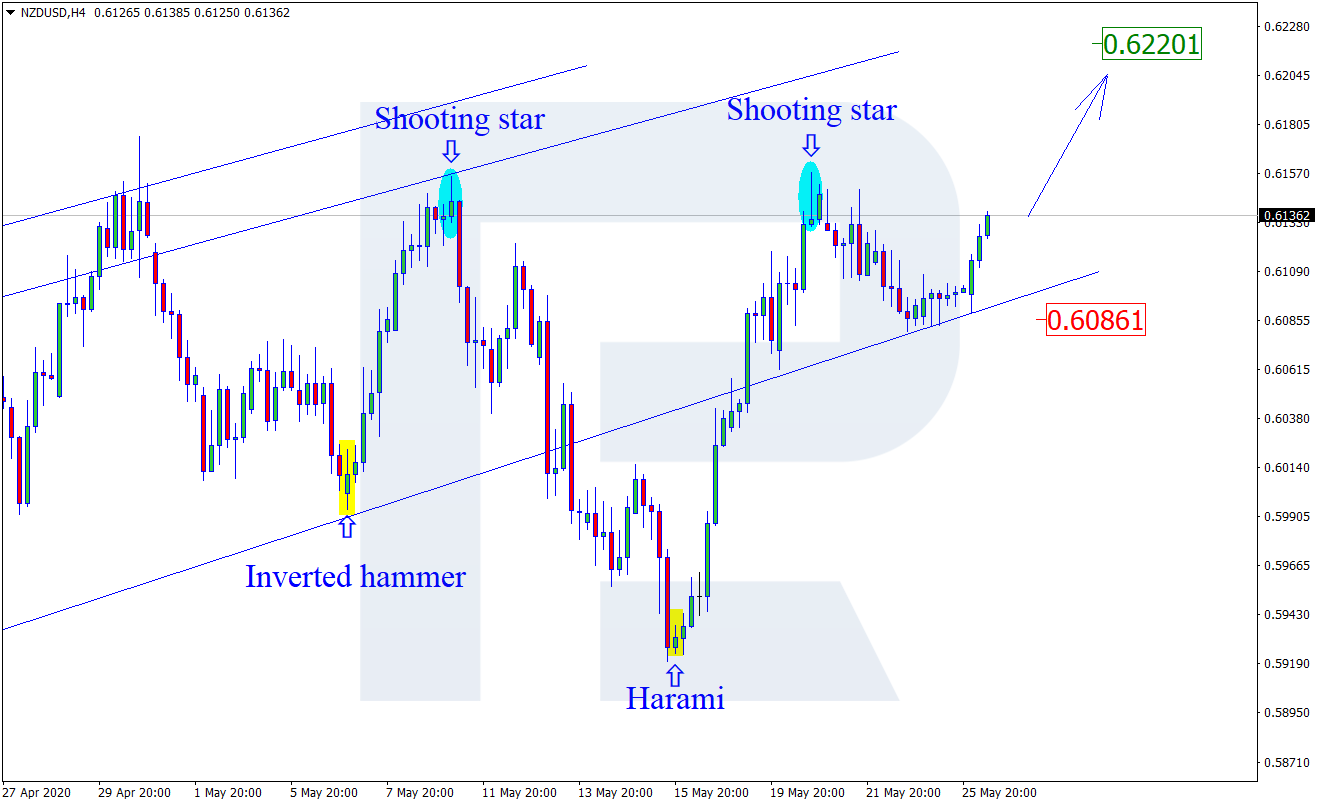
As we can see in the H4 chart, after finishing the correction and testing the rising channel’s downside border, NZDUSD has formed several reversal patterns not far from the support level and rebounded from it to the upside; right now, it is still moving upwards. The upside target remains at 0.6220.

NZDUSD
Risk Warning: the result of previous trading operations do not guarantee the same results in the future

GBPUSD, “Great Britain Pound vs US Dollar”

As we can see in the H4 chart, after rebounding from the support level, forming a Hammer pattern, and reversing, GBPUSD has finished another correction and completed several more reversal patterns; right now, it is still growing. The upside target is at 1.2358. However, there is another scenario, which implies that the instrument may fall to return to 1.2010.

GBPUSD

Article By RoboForex.com

Attention!
Forecasts presented in this section only reflect the author’s private opinion and should not be considered as guidance for trading. RoboForex LP bears no responsibility for trading results based on trading recommendations described in these analytical reviews.

Demand for Risky Assets Has Grown. More and More Countries Are Removing Restrictions

by JustForex

The US dollar has been declining against a basket of currency majors. The US dollar index (#DX) has updated local lows. Demand for risky assets has grown significantly when more and more countries start easing quarantine restrictions, which gives hope for economic recovery after the impact of the pandemic. So, in Japan, the state of emergency was canceled; in India, domestic air traffic resumes, in the Eurozone countries, more and more restrictive measures are being removed. At the same time, Novavax, an American pharmaceutical company, said it has started clinical trials of a vaccine against the COVID-19 virus.

Meanwhile, Executive Director of the World Health Organization’s Health Emergencies Programme, Mike Ryan, believes the world is still in the middle of the first wave of the COVID-19 pandemic. “Right now, we’re not in the second wave. We’re right in the middle of the first wave globally,” said M. Ryan. This is evidenced by the epidemiological situation in Central and South America, South Asia and Africa, where the number of cases is growing sharply every day. He also noted that coronavirus could show a sudden new peak.

The “black gold” prices continue to recover. Currently, futures for the WTI crude oil are testing the $34.10 mark per barrel.

Market indicators

Yesterday, the US stock market was closed due to the holiday.

The 10-year US government bonds yield has increased. At the moment, the indicator is at the level of 0.69-0.70%.

The news feed on 2020.05.26:
  • – Consumer confidence index in the US at 17:00 (GMT+3:00);
    – New home sales in the US at 17:00 (GMT+3:00).

by JustForex

WTI Flirts With Technical Resistance At 33.66

By Orbex

Crude oil prices are trading rather flat with price action failing to post any strong moves.

WTI Crude oil is flirting with the technical resistance level of 33.66.

This follows the price action from last week.

With a lower high forming, there is a possibility for WTI crude oil to push lower.

But, for the moment, we expect some sideways range to continue.

While the upside is capped at 33.66, the support is at the previous pivot lows of 31.72.

A breakout from either of these levels will see further direction forming.

By Orbex


Is GBPUSD Forming A Bottom?

By Orbex

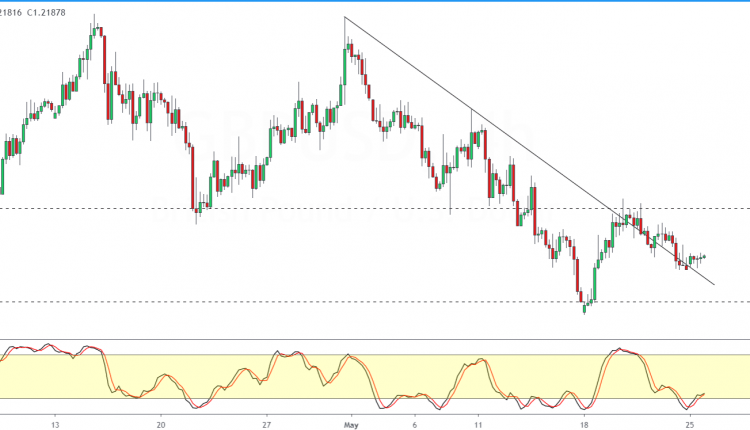
The British pound is slowing drifting lower, but amid the consolidation, we see a higher low forming.

This potentially suggests that the currency pair is forming a bottom.

Adding to this view is the strong bullish divergence we are seeing on the Stochastics oscillator.

The set up looks to a possible breakout to the upside. However, prices must breakout convincingly above the 1.2277 level where resistance looks strong.

A close above this level will set the stage for further gains to come.

By Orbex


The Analytical Overview of the Main Currency Pairs on 2020.05.26

by JustForex

The EUR/USD currency pair

Technical indicators of the currency pair:
  • Prev Open: 1.08955
  • Open: 1.08954
  • % chg. over the last day: -0.01
  • Day’s range: 1.08912 – 1.09387
  • 52 wk range: 1.0777 – 1.1494

The EUR/USD currency pair has been growing. The trading instrument has updated local highs. The demand for risky assets has grown amid the gradual lifting of restrictions imposed to fight the COVID-19 epidemic worldwide. Novavax, an American biotechnology company, said it has started clinical trials of the COVID-19 vaccine, which also supports the demand for risky assets. At the moment, EUR/USD quotes are consolidating in the range of 1.0905-1.0940. We do not exclude further growth of the single currency against the greenback. We expect important economic releases from the US. Positions should be opened from key levels.

The Economic News Feed for 26.05.2020:
  • – US consumer confidence index at 17:00 (GMT+3:00);
  • – New home sales in the US at 17:00 (GMT+3:00).
EUR/USD

Indicators signal the power of buyers: the price has fixed above 50 MA and 100 MA.

The MACD histogram is in the positive zone and above the signal line, which gives a strong signal to buy EUR/USD.

Stochastic Oscillator is in the overbought zone, the %K line has crossed the %D line. There are no signals at the moment.

Trading recommendations
  • Support levels: 1.0905, 1.0870, 1.0840
  • Resistance levels: 1.0940, 1.0975, 1.1000

If the price fixes above 1.0940, further growth of EUR/USD quotes is expected. The movement is tending to 1.0970-1.1000.

An alternative could be a decrease in the EUR/USD currency pair to 1.0875-1.0840.

The GBP/USD currency pair

Technical indicators of the currency pair:
  • Prev Open: 1.21726
  • Open: 1.21825
  • % chg. over the last day: +0.05
  • Day’s range: 1.21742 – 1.22683
  • 52 wk range: 1.1466 – 1.3516

Purchases prevail on the GBP/USD currency pair. The British pound has updated local highs. The demand for risky assets has grown significantly. At the moment, GBP/USD quotes are testing the supply zone of 1.2275-1.2300. The 1.2225 mark is already a “mirror” support. The technical pattern signals a further growth of the GBP/USD currency pair. Tensions between Washington and Beijing are still in the focus of investors’ attention. We recommend opening positions from key levels.

GBP/USD

Indicators signal the power of buyers: the price has fixed above 100 MA.

The MACD histogram is in the positive zone and above the signal line, indicating the bullish sentiment.

Stochastic Oscillator is in the overbought zone, the %K line is above the %D line, which gives a weak signal to buy GBP/USD.

Trading recommendations
  • Support levels: 1.2225, 1.2190, 1.2160
  • Resistance levels: 1.2275, 1.2300, 1.2335

If the price fixes above 1.2275, further growth of GBP/USD quotes is expected. The movement is tending to 1.2300-1.2330.

An alternative could be a decrease in the GBP/USD currency pair to 1.2200-1.2170.

The USD/CAD currency pair

Technical indicators of the currency pair:
  • Prev Open: 1.39882
  • Open: 1.39773
  • % chg. over the last day: -0.07
  • Day’s range: 1.39123 – 1.39853
  • 52 wk range: 1.2949 – 1.4668

USD/CAD quotes have been declining again. The trading instrument has updated local lows. At the moment, the USD/CAD currency pair is testing the 1.3910 mark. The 1.3970 mark is the key resistance. The greenback demand has weakened. The loonie is supported by the positive dynamics of the “black gold” prices. The Canadian dollar has the potential for further growth against the US currency. Positions should be opened from key levels.

We recommend paying attention to economic reports from the US.

USD/CAD

Indicators signal the power of sellers: the price has fixed below 50 MA and 100 MA.

The MACD histogram is in the negative zone, indicating the bearish sentiment.

Stochastic Oscillator is in the oversold zone, the %K line has crossed the %D line. There are no signals at the moment.

Trading recommendations
  • Support levels: 1.3910, 1.3870
  • Resistance levels: 1.3970, 1.4000, 1.4045

If the price fixes below 1.3910, a further drop in USD/CAD quotes is expected. The movement is tending to 1.3870-1.3850.

An alternative could be the growth of the USD/CAD currency pair to 1.4000-1.4020.

The USD/JPY currency pair

Technical indicators of the currency pair:
  • Prev Open: 107.572
  • Open: 107.664
  • % chg. over the last day: +0.08
  • Day’s range: 107.663 – 107.922
  • 52 wk range: 101.19 – 112.41

The technical pattern is still ambiguous on the USD/JPY currency pair. A trading instrument is being traded in a flat. At the moment, USD/JPY quotes are testing the supply zone of 107.90-108.05. The 107.65 mark is the nearest support. The demand for “safe-haven” currencies has weakened significantly. The USD/JPY currency pair is tending to grow. We recommend paying attention to the dynamics of US government bonds yield. Positions should be opened from key levels.

The Bank of Japan does not exclude the introduction of additional economic stimulus measures to mitigate the effects of the COVID-19 pandemic.

USD/JPY

Indicators signal the power of buyers: the price has fixed above 50 MA and 100 MA.

The MACD histogram is in the positive zone, indicating the bullish sentiment.

Stochastic Oscillator is in the neutral zone, the %K line is below the %D line, which gives a signal to sell USD/JPY.

Trading recommendations
  • Support levels: 107.65, 107.35, 107.10
  • Resistance levels: 107.90, 108.05, 108.30

If the price fixes above 107.90, USD/JPY quotes are expected to rise. The movement is tending to 108.10-108.40.

An alternative could be a decrease in the USD/JPY currency pair to 107.40-107.20.

by JustForex

EURUSD Firmly Testing Support At 1.0885

By Orbex

The EURUSD currency pair briefly managed to rise off the support area near 1.0885 – 1.0879 level.

However, this bounce saw prices falling back once again, giving up modest gains.

For the moment, the consolidation appears to continue. Therefore, the support area near 1.0885 – 1.0879 will be critical in order for the currency pair to post any gains.

Given the bias, there is a possibility that the EURUSD will break down below this support area.

This will potentially see prices pulling back even further, erasing the gains made over the last few weeks.

By Orbex