The Analytical Overview of the Main Currency Pairs on 2020.05.27

by JustForex

The EUR/USD currency pair

Technical indicators of the currency pair:
  • Prev Open: 1.08954
  • Open: 1.09814
  • % chg. over the last day: +0.75
  • Day’s range: 1.09512 – 1.09850
  • 52 wk range: 1.0777 – 1.1494

During yesterday’s trading session, the greenback weakened significantly against its main competitors. The growth of EUR/USD quotes has exceeded 85 points. Demand for risky assets is still high amid the gradual lifting of restrictions around the world. Additional support is provided by the hope of creating a vaccine against the COVID-19 virus. At the moment, EUR/USD quotes are consolidating in the range of 1.0940-1.0975. Today, financial market participants will assess the Fed’s “Beige Book”, which will show the economic condition of 12 federal districts in a crisis caused by the coronavirus pandemic. We recommend opening positions from key levels.

The Economic News Feed for 27.05.2020:

At 21:00 (GMT+3:00), the Fed’s “Beige Book” will be published.

We also recommend paying attention to the speech by the head of the ECB.

EUR/USD

Indicators signal the power of buyers: the price has fixed above 50 MA and 100 MA.

The MACD histogram is in the positive zone, but below the signal line, which gives a weak signal to buy EUR/USD.

Stochastic Oscillator has started exiting the oversold zone, the %K line is above the %D line, which indicates the bullish sentiment.

Trading recommendations
  • Support levels: 1.0940, 1.0915, 1.0870
  • Resistance levels: 1.0975, 1.1000, 1.1030

If the price fixes above 1.0975, further growth of EUR/USD quotes is expected. The movement is tending to 1.1020-1.1040.

An alternative could be a decrease in the EUR/USD currency pair to 1.0915-1.0880.

The GBP/USD currency pair

Technical indicators of the currency pair:
  • Prev Open: 1.21825
  • Open: 1.23337
  • % chg. over the last day: +1.18
  • Day’s range: 1.22898 – 1.23390
  • 52 wk range: 1.1466 – 1.3516

The British pound has strengthened significantly against the US currency. Yesterday, the growth of GBP/USD quotes exceeded 150 points. The trading instrument has reached two-week highs. The demand for risky assets remains high. Currently, the GBP/USD currency pair is consolidating. The local support and resistance levels are 1.2280 and 1.2325, respectively. The British pound has the potential for further growth. We expect the Fed’s “Beige Book”. We recommend opening positions from key levels.

The news feed on the UK economy is calm.

GBP/USD

Indicators signal the power of buyers: the price has fixed above 50 MA and 100 MA.

The MACD histogram is in the positive zone, but below the signal line, which gives a weak signal to buy GBP/USD.

Stochastic Oscillator is in the neutral zone, the %K line has crossed the %D line. There are no signals at the moment.

Trading recommendations
  • Support levels: 1.2280, 1.2235, 1.2190
  • Resistance levels: 1.2325, 1.2360

If the price fixes above 1.2325, further growth of GBP/USD quotes is expected. The movement is tending to 1.2360-1.2400.

An alternative could be a decrease in the GBP/USD currency pair to 1.2240-1.2220.

The USD/CAD currency pair

Technical indicators of the currency pair:
  • Prev Open: 1.39773
  • Open: 1.37758
  • % chg. over the last day: -1.48
  • Day’s range: 1.37588 – 1.38052
  • 52 wk range: 1.2949 – 1.4668

There are aggressive sales on the USD/CAD currency pair. Yesterday, the loonie added over 200 points against the US dollar. The trading instrument has overcome and fixed below the key extremes. At the moment, USD/CAD quotes are consolidating in the range of 1.3755-1.3810. The Canadian dollar has the potential for further growth relative to the greenback. We recommend paying attention to the dynamics of “black gold” prices, as well as the news feed on the US economy. Positions should be opened from key levels.

USD/CAD

Indicators signal the power of sellers: the price has fixed below 50 MA and 100 MA.

The MACD histogram is in the negative zone, indicating the bearish sentiment.

Stochastic Oscillator is in the neutral zone, the %K line has crossed the %D line. There are no signals at the moment.

Trading recommendations
  • Support levels: 1.3755, 1.3700
  • Resistance levels: 1.3810, 1.3870, 1.3900

If the price fixes below 1.3755, a further drop in USD/CAD quotes is expected. The movement is tending to 1.3700-1.3680.

An alternative could be the growth of the USD/CAD currency pair to 1.3850-1.3880.

The USD/JPY currency pair

Technical indicators of the currency pair:
  • Prev Open: 107.664
  • Open: 107.563
  • % chg. over the last day: -0.15
  • Day’s range: 107.363 – 107.616
  • 52 wk range: 101.19 – 112.41

USD/JPY quotes are consolidating. The technical pattern is ambiguous. At the moment, the local support and resistance levels are 107.40 and 107.65, respectively. Financial market participants expect additional drivers. Today, the Fed’s “Beige Book” is in the spotlight. We also recommend paying attention to the dynamics of US government bonds yield. Positions should be opened from key levels.

The news feed on Japan’s economy is calm.

USD/JPY

Indicators do not give accurate signals: the price has crossed 100 MA.

The MACD histogram is in the negative zone, indicating the bearish sentiment.

Stochastic Oscillator is in the neutral zone, the %K line is above the %D line, which gives a signal to buy USD/JPY.

Trading recommendations
  • Support levels: 107.40, 107.10, 106.85
  • Resistance levels: 107.65, 107.90, 108.95

If the price fixes below 107.40, USD/JPY quotes are expected to fall. The movement is tending to the round level of 107.00.

An alternative could be the growth of the USD/JPY currency pair to 107.90-108.10.

by JustForex

Gold bulls still in charge, but is a short-term correction coming?

By Admiral Markets

Source: Economic Events May 27, 2020 – Admiral Markets’ Forex Calendar

Gold remains bullish after pushing to new yearly highs last week. Nevertheless, the short-term (and the technical bearish divergence in the RSI(14) on a daily time-frame) catches our interest, making us believe that a stint in the near-term below 1,700 USD is an option.

On the other hand, and as long as we trade above 1,660 USD, we rather expect a coming stint to the all-time high of around 1,920 USD.

The economic calendar is quite thin this Wednesday, with only the speech from Fed member and St. Louis Fed president Bullard could be of interest, even though, in our opinion, it seems unlikely that their rhetoric will massively diverge from recent comments from Fed chairman Powell.

In front of the US congress on May 13, Powell testified that the Fed will do everything and flood markets with trillions of US dollar if necessary to avoid a collapse of the US economy which were underlined in Powell’s appearance on CBS “60 Minutes” where he said “In the long run and even in the medium run, you wouldn’t want to bet against the American economy” while acknowledging that the unemployment rate could hit as high as 25%.

That in mind and if we get to see a sustainable drop in 10-year US Treasury yields below 0.60% in the days to come leaves us with a bullish expectation and a target around 1,920, as initially already said, as long as we trade above 1,660 USD:

Source: Admiral Markets MT5 with MT5-SE Add-on Gold Daily chart (between February 25, 2019, to May 26, 2020). Accessed: May 26, 2020, at 10:00pm GMT – Please note: Past performance is not a reliable indicator of future results, or future performance.

In 2015, the value of Gold fell by 10.4%, in 2016, it increased by 8.1%, in 2017, it increased by 13.1%, in 2018, it fell by 1.6%, in 2019, it increased by 18.9%, meaning that after five years, it was up by 28%.

Discover the world’s #1 multi-asset platform

Admiral Markets offers professional traders the ability to trade with a custom, upgraded version of MetaTrader 5, allowing you to experience trading at a significantly higher, more rewarding level. Experience benefits such as the addition of the Market Heat Map, so you can compare various currency pairs to see which ones might be lucrative investments, access real-time trading data, and so much more. Click the banner below to start your FREE download of MT5 Supreme Edition!

Download MetaTrader 5 and begin trading today!

Disclaimer: The given data provides additional information regarding all analysis, estimates, prognosis, forecasts or other similar assessments or information (hereinafter “Analysis”) published on the website of Admiral Markets. Before making any investment decisions please pay close attention to the following:

  1. This is a marketing communication. The analysis is published for informative purposes only and are in no way to be construed as investment advice or recommendation. It has not been prepared in accordance with legal requirements designed to promote the independence of investment research, and that it is not subject to any prohibition on dealing ahead of the dissemination of investment research.
  2. Any investment decision is made by each client alone whereas Admiral Markets shall not be responsible for any loss or damage arising from any such decision, whether or not based on the Analysis.
  3. Each of the Analysis is prepared by an independent analyst (Jens Klatt, Professional Trader and Analyst, hereinafter “Author”) based on the Author’s personal estimations.
  4. To ensure that the interests of the clients would be protected and objectivity of the Analysis would not be damaged Admiral Markets has established relevant internal procedures for prevention and management of conflicts of interest.
  5. Whilst every reasonable effort is taken to ensure that all sources of the Analysis are reliable and that all information is presented, as much as possible, in an understandable, timely, precise and complete manner, Admiral Markets does not guarantee the accuracy or completeness of any information contained within the Analysis. The presented figures refer that refer to any past performance is not a reliable indicator of future results.
  6. The contents of the Analysis should not be construed as an express or implied promise, guarantee or implication by Admiral Markets that the client shall profit from the strategies therein or that losses in connection therewith may or shall be limited.
  7. Any kind of previous or modeled performance of financial instruments indicated within the Publication should not be construed as an express or implied promise, guarantee or implication by Admiral Markets for any future performance. The value of the financial instrument may both increase and decrease and the preservation of the asset value is not guaranteed.
  8. The projections included in the Analysis may be subject to additional fees, taxes or other charges, depending on the subject of the Publication. The price list applicable to the services provided by Admiral Markets is publicly available from the website of Admiral Markets.

Leveraged products (including contracts for difference) are speculative in nature and may result in losses or profit. Before you start trading, you should make sure that you understand all the risks

By Admiral Markets

EU50 Analysis: Better than forecast euro area data bullish for EU50

By IFCMarkets

Better than forecast euro area data bullish for EU50

Euro area economic data in the last couple of weeks were not as bad as feared: contraction in private business sector activities slowed in May, investor morale improved further and consumer confidence improved more than expected. Markit’s Composite PMI for euro-zone went up to 30.5 in May 2020 from 13.6 in April when a reading of 25 was expected, according to preliminary estimate. Readings above 50 indicate activities expansion, below indicate contraction. The ZEW indicator of economic sentiment for the euro-zone rose from 25.2 in April to 46 in May, the highest reading since August 2015. And Eurostat survey results showed the consumer confidence index in euro-zone rose from the previous month’s 11-year low -22 to -18.8 in May, when a reading of -24.0 was forecast. Readings above 0 indicate optimism, below indicate pessimism. Better data are bullish for EU50. Nevertheless, further deterioration of euro-zone’s economic performance is a downside risk: Eurostat is due to report the change in business confidence for euro area on Thursday, and a steeper than forecast deterioration is a downside risk for EU50.

IndicatorVALUESignal
RSINeutral
MACDBuy
Donchian ChannelNeutral
MA(50)Buy
FractalsBuy
Parabolic SARBuy


Summary of technical analysis

OrderBuy
Buy stopAbove 3017.32
Stop lossBelow 2696.91

Market Analysis provided by IFCMarkets

EURCHF Analysis: SNB may lower the rate

By IFCMarkets

SNB may lower the rate

The upward movement means the strengthening of the euro against the Swiss franc. The current SNB rate is -0.75%. The last time it was reduced by 0.25% from -0.5% in January 2015. The Swiss Central Bank regular meeting is to be held on June 17, 2020 and a lower rate of -1% is expected. Switzerland released positive data on foreign trade for April and the labor market for the 1st quarter of 2020. Recall that the ECB rate of 0% looks more attractive than that of the SNB. Eurozone inflation data for May will be released on Friday. The outlook is positive for the euro.

IndicatorVALUESignal
RSINeutral
MACDBuy
MA(200)Buy
FractalsNeutral
Parabolic SARBuy
Bollinger BandsNeutral


Summary of technical analysis

OrderBuy
Buy stopAbove 1,064
Stop lossBelow 1,056

Market Analysis provided by IFCMarkets

Is A Blow-Off Top Setting Up

By TheTechnicalTraders 

– Our research team has become increasingly concerned that the US Fed support for the markets has pushed price levels well above true valuation levels and that a risk of a downside price move is still rather high.  Recently, we published a research article highlighting our Adaptive Dynamic Learning (ADL) predictive modeling system results showing the US stock market was 12% to 15% overvalued based on our ADL results.  Today, Tuesday, May 26, the markets opened much higher which extends that true valuation gap.

We understand that everyone expects the markets to go back to where they were before the COVID-19 virus event happened – and that is likely going to happen over time.  Our research team believes the disruption of the global economy over the past 70+ days will result in a very difficult Q2: 2020 and some very big downside numbers.  Globally, we believe the disruption to the consumer and services sector has been strong enough to really disrupt forward expectations and earnings capabilities.  We’ve been warning our friends and followers to be very cautious of this upside price trend as the Fed is driving prices higher while the foundations of the global economy (consumers, services, goods, and retail) continue to crumble away.

Our biggest concern is a sharp downside rotation related to overvalued markets and sudden news or a new economic event that disrupts forward expectations.  Obviously, Q2 data will likely be a big concern for many, yet we believe something else could act as a catalyst for a reversion event.  Possibly global political news?  Possibly some type of extended collateral damage related to the global economy? Possibly something related to earnings expectations going forward through the rest of 2020 and beyond?  We believe things are not “back to normal” at this stage of the recovery and we believe the markets are moderately over-extended at this time.

Before we continue, be sure to opt-in to our free market trend signals before closing this page, so you don’t miss our next special report!

ES ADL PREDICTIVE MODELING WEEKLY CHART

This Weekly ES (S&P500 E-Mini Futures) chart shows our ADL predictive modeling system’s expected future price level targets which suggest the current market price level is 12% to 15% (or more) above these target levels. Remember, the ADL system uses a custom price mapping technology that is designed to identify “price/technical DNA markers” within historical data – then attempt to map out future price level activity and track the highest probable outcomes of these price DNA markers.  The objective of this research tool is to show us what type of price activity is highly probable based on historical data and predictive modeling research.  This unique trigger on the ES chart consisted of 5 historical DNA markers and suggests a future probability of 70% to 87% regarding future price target levels.

One aspect of our research while using the ADL predictive modeling system and our other tools it the concept of “price anomalies”.  These are rallies or sell-offs that extend beyond support or resistance levels and when price levels trend away from ADL predicted target levels.  We created the term “price anomaly” and explain it to our members as “some external force is pushing the price above or below the projected target level.  Once this force abates or diminishes, the price will likely move, very quickly, to levels near the ADL predicted target levels.”.

Currently, the US Fed is engaging in a moderate support effort for the US stock market and it is reportedly buying $5+ billion a day in bonds and assets.  Although it may seem impossible to fight the fed, we believe the markets (like nature) are almost impossible to fool and control.  We believe that price will react to market conditions and that future price rotation (both up and down) will continue to be more volatile than many traders expect.

CUSTOM VOLATILITY INDEX WEEKLY CHART

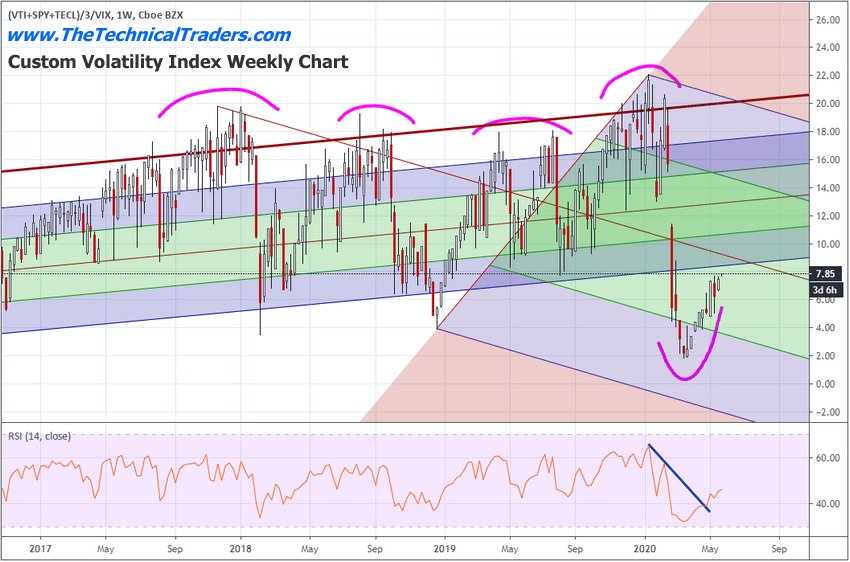
This Custom Volatility Index chart highlights the extremely low levels recently established by the COVID-19 market sell-off.  These new low levels have created the deepest sell-off levels on this chart in 20+ years.  It has also established a new, highly volatile, downward price channel that our researchers are following to help us determine where resistance will likely be found.

We believe a new downward price rotation is setting up for some time in the near future that will establish a tighter price channel and assist us in determining when and where the ultimate price bottom will setup and complete.  With the VIX levels still near 27~29, we are certain that volatility has not decreased even though price levels have attempted a solid recovery over the past 8+ weeks.

CUSTOM SMART CASH INDEX WEEKLY CHART

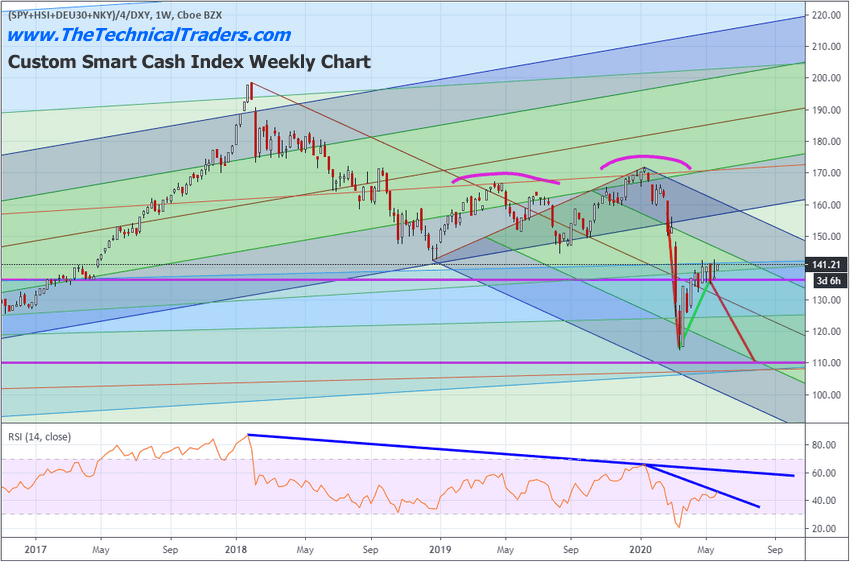
This Weekly Custom Smart Cash Index chart highlights the true function of price within the US stock market and highlights the overall weakness still at play within the current markets.  Even though the NQ has rallied to near all-time highs, the Smart Cash Index is showing the broader market is still rather weak and that recent price activity has stalled into a sideways/flag formation.  The broader market buying that took place near the end of March 2020 and throughout April 2020 has stalled.  The Fed became the market for the past 8+ weeks and as the Fed diminishes its activity, it will be up to the markets to manage trends and future expectations going forward.

Our researchers are concerned that a sudden breakdown in the Smart Cash index may prompt a bigger downside price move in the global markets.  Our research team has continued to issue warnings to our members to run protective stops on any open long positions, to properly size trades to avoid excessive risks and to properly hedge your trading using precious metals, miners, and Bonds.  In short, these risks are very real.  You can still make a profit trading the long side of the markets, but we suggest that you take all the necessary steps to protect your trades.

CUSTOM US STOCK MARKET INDEX WEEKLY CHART

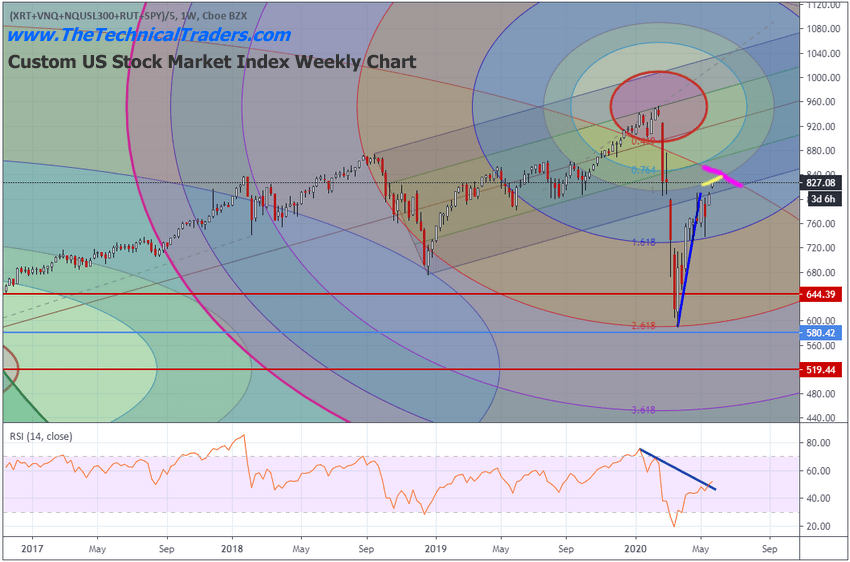
This last Weekly Custom US Stock Market chart highlights two very important levels related to our Fibonacci Price Amplitude Arcs.  These arcs represent critical Fibonacci support and resistance levels that arc across time and price levels.  It is important to understand these levels will present very real inflections in price – at least we expect them to create price inflections.

Currently, there is the YELLOW Fibonacci price arc that is acting as resistance near the current highs and the MAGENTA Fibonacci price arc that is much longer-term.  This longer-term Fibonacci price arc may be stronger than the current shorter-term arc.  Our researchers believe the current Fibonacci arc levels on this chart will prompt price to “flag out” in a sideways price channel before potentially breaking downward.

As we continue to watch for weakness across these charts and trends, we urge skilled technical traders to be prepared for a sharp spike in volatility over the next 4+ weeks.  It appears we are only 2 to 4+ weeks away from reaching these major price inflection points.  Currently, we believe a downside move is the most probable outcome based on our ADL predictive modeling system results as well as the technical patterns seen on these charts.

Overall, we believe the increased volatility levels in the US stock market will present some incredible trading opportunities for technical traders.  Big swings, near-perfect technical patterns and setups, quick profits, and broader sector rotations.  This is the type of market where skilled technical traders can really enjoy a target-rich environment.  We just have to be selective in how we determine when to enter trades and to not take excessive risks.

I’m offering you the chance to learn to profit, as I do with my own money, from market trends that I hand-pick for my own trading.  These are not wild, crazy trades – these are simple, effective, and slower types of trades that consistently build wealth.  I issue about 4 to 8+ trades a month for my members and adjust trade allocation based on my proprietary allocation strategy– the objective is to gain profits while managing overall risks.

You don’t have to spend days or weeks trying to learn my system.  You don’t have to try to learn to make these decisions on your own or follow the markets 24/7 – I do that for you.  All you have to do is follow my research and trading signals and start benefiting from my research and trades.  My new mobile app makes it simple – download the app, sign in and everything is delivered to your phone, tablet, or desktop.

I offer membership services for active traders, long-term investors, and wealth/asset managers.  Each of these services is driven by my own experience and my proprietary trading systems and modeling systems.  I have a small team of dedicated researchers and developers that do nothing but research and find trading signals for my members.  Our objective is to help you protect and grow your wealth.

Please take a moment to visit TheTechnicalTraders.com to learn more.  I can’t say it any better than this…  I want to help you create success while helping you protect and preserve your wealth – it’s that simple.

Chris Vermeulen
Chief Market Strategist

TheTechnicalTraders.com


3 Tips for Investing in Your First Business

Investing in other businesses has never been easier for those who have the resources and know-how necessary to do so. But investing is not a get rich quick scheme, and it isn’t even guaranteed to make you money in the long-run. Before you pull the trigger on any business investment, it is vital that you do your due diligence and know exactly what you are getting into. Here are three tips for first-time investors looking to minimize their risks.

Make Sure the Business is Properly Insured

Business insurance provides businesses with essential financial protection against the most common liabilities that they face. For example, business insurance can protect policyholders from the liabilities they would face from an employee or customer injuring themselves while on company property. There is also data breach insurance to protect businesses from liabilities arising from data breaches.

Ensuring that a business is adequately insured before you invest in it will help to avoid any nasty surprises down the line. You don’t want to sink your cash into a business that ends up going broke because of its legal liabilities. You can check out insurance for business owners from The Hartford, whose site will enable you to see what kind of business insurance is available in your state and what sort of price you can expect to pay. If the business that you want to invest in doesn’t have insurance in place, this is something that you can quickly remedy with them.

Check Out Who is Behind the Business

You can learn a lot about a business by looking at its balance sheet. However, this will only tell you half the story. To fully appreciate the implications of a balance sheet, you need to know who the key people involved in managing the business are. Depending on their background, skills, and knowledge, they might be valuable assets that are sure to enhance the value of the business on the whole.

Take the time to get to know the people that you will be going into business with. Find out as much as you can about their individual backgrounds and their histories as entrepreneurs. If you have doubts about their ability to use your investment wisely, approach them with caution.

Check Out Their Prospectus and Business Plan

Reviewing dry business documents is rarely fun. However, if you are serious about starting a career in investing, then you are going to have to learn to love this part of the process. A business’s prospectus will provide you with valuable insight into the way that a company is run. Obviously, this is useful information to have as an investor. After all, you want to know that the business you are putting your money in to has a plan for what to do with it.

Investing in your first business should be a significant milestone in your professional life and, ultimately, a cause for celebration. But an investment that goes bad can have catastrophic effects on your finances. Make sure that you do your homework and don’t invest until you have done your due diligence.

By Taylor Wilman


White Gold Has a World of Riches Few Understand

By The Gold Report – Source: Bob Moriarty for Streetwise Reports   05/23/2020

Bob Moriarty of 321gold discusses a company with 33 projects in the Yukon.

Recently billionaire Eric Sprott added a multi-million dollar vote of confidence to that of Agnico Eagle and Kinross in the Yukon based amalgamation of all the projects of Shawn Ryan named White Gold Corp. (WGO:TSX.V; WHGOF:OTCMKTS). That now makes an even three entities that actually understand the magnitude of what White Gold has in their stable. That would be Eric, Kinross and Agnico Eagle. Few others get it.

The mining industry used to be populated by legends. A few exist today. One of the most interesting would have to be Shawn Ryan highlighted in various articles and magazines.

I was on a trip to the Yukon fifteen or so years ago when I met him. He was living with his partner in a trailer in Dawson. He was intent on staking half the Yukon and eventually pretty much succeeded. Later he did joint ventures with a number of juniors before he realized that dealing with dozens of juniors was at a minimum, painful.

So he put together a package of 33 projects covering over 420,000 ha with an existing 1.8 million ounce resource. You would think the market would jump at the opportunity to get a piece of such valuable real estate in probably the best country in the world to explore and produce gold. You would be thinking wrong.

I’ve been to hundreds of projects including half a dozen of his projects. I can’t keep track of the names much less the potential. Investors pretty much share my ignorance. How do you cope with trying to understand 33 different projects and still make an intelligent investing decision? The answer is simple. You don’t.

But you can try looking at the company in different ways that will tell you some idea of the potential and wisdom of investing.

In US pesos, White Gold has a market cap of about $75 million. With about 1.8 million ounces of gold that means an investor today is paying about $42 an ounce in the ground. All those ounces are found in only two of the 33 individual properties. So pay $42 an ounce for the shares and you get 31 more projects for free.

Eric Sprott gets it.

Kinross gets it.

Agnico Eagle gets it.

You don’t have to be as knowledgeable as they are. You can ride on their expertise and experience in the Yukon. Kinross and Agnico Eagle each own just over 17% of the company. They have the right to maintain their level of ownership and when Eric Sprott expressed an interest in investing, they bellied up to the bar to keep their same participation.

Management and I both agree investors don’t get it. I figure that with what they already have in a resource and the level of exploration being done (and fully funded by Kinross and Agnico Eagle) the shares should be a couple of hundred percent higher. So management of White Gold is doing something brilliant. They are telling their story via a webinar taking place on Thursday May 28th at 1 PM ET (10 AM PT).

If you are an existing shareholder, sign up here.

If you think you might want to be a shareholder, sign up here.

If you just want to listen to one of the most interesting guys in mining, sign up here.

Based on the torrent of money the Fed had dumped into the US financial system I’m pretty much convinced we are going to have major deflation in all the markets that bubbled and eventually hyperinflation in the dollar. If I’m right that will drive prices of the metals far higher than we can imagine today.

Inflation is what you get when a country such as Japan prints a lot of money. Hyperinflation is what happens when people lose confidence in their currency. With tens of millions of Americans having joined the ranks of the perhaps permanently unemployed I doubt many are going to trust anything coming from the government except free money. And since there is no free lunch and the government cannot possible print enough to pay off the $250 trillion in debt in the world, one day gold and silver will hit prices we cannot even imagine today. Because when you talk about the price of anything you are talking about two different things. One is the commodity and the other is the currency.

If you want to imagine what might happen, think of quoting gold in Zimbabwe dollars. It’s coming our way.

White Gold is an advertiser and I bought shares in the open market. Do your own due diligence.

White Gold Corp
WGO-V $0.84 (May 22, 2020)
WHGOF-OTCBB 124.7 million shares
White Gold website

Bob Moriarty
President: 321gold
Archives
321gold

Bob Moriarty founded 321gold.com, with his late wife, Barbara Moriarty, more than 16 years ago. They later added 321energy.com to cover oil, natural gas, gasoline, coal, solar, wind and nuclear energy. Both sites feature articles, editorial opinions, pricing figures and updates on current events affecting both sectors. Previously, Moriarty was a Marine F-4B and O-1 pilot with more than 832 missions in Vietnam. He holds 14 international aviation records.

Sign up for our FREE newsletter at: www.streetwisereports.com/get-news

Disclosure:
1) Bob Moriarty: I, or members of my immediate household or family, own shares of the following companies mentioned in this article: White Gold. White Gold is an advertiser on 321 Gold. I determined which companies would be included in this article based on my research and understanding of the sector.
2) The following companies mentioned are billboard sponsors of Streetwise Reports: None. Click here for important disclosures about sponsor fees.
3) Statements and opinions expressed are the opinions of the author and not of Streetwise Reports or its officers. The author is wholly responsible for the validity of the statements. The author was not paid by Streetwise Reports for this article. Streetwise Reports was not paid by the author to publish or syndicate this article. The information provided above is for informational purposes only and is not a recommendation to buy or sell any security. Streetwise Reports requires contributing authors to disclose any shareholdings in, or economic relationships with, companies that they write about. Streetwise Reports relies upon the authors to accurately provide this information and Streetwise Reports has no means of verifying its accuracy.
4) The article does not constitute investment advice. Each reader is encouraged to consult with his or her individual financial professional and any action a reader takes as a result of information presented here is his or her own responsibility. By opening this page, each reader accepts and agrees to Streetwise Reports’ terms of use and full legal disclaimer. This article is not a solicitation for investment. Streetwise Reports does not render general or specific investment advice and the information on Streetwise Reports should not be considered a recommendation to buy or sell any security. Streetwise Reports does not endorse or recommend the business, products, services or securities of any company mentioned on Streetwise Reports.
5) From time to time, Streetwise Reports LLC and its directors, officers, employees or members of their families, as well as persons interviewed for articles and interviews on the site, may have a long or short position in securities mentioned. Directors, officers, employees or members of their immediate families are prohibited from making purchases and/or sales of those securities in the open market or otherwise from the time of the interview or the decision to write an article until three business days after the publication of the interview or article. The foregoing prohibition does not apply to articles that in substance only restate previously published company releases.

( Companies Mentioned: WGO:TSX.V; WHGOF:OTCMKTS,
)

Rich and poor don’t recover equally from epidemics. Rebuilding fairly will be a global challenge

By Ilan Noy, Te Herenga Waka — Victoria University of Wellington

Since the Indian Ocean tsunami of 2004, disaster recovery plans are almost always framed with aspirational plans to “build back better”. It’s a fine sentiment – we all want to build better societies and economies. But, as the Cheshire Cat tells Alice when she is lost, where we ought to go depends very much on where we want to get to.

The ambition to build back better therefore needs to be made explicit and transparent as countries slowly re-emerge from their COVID-19 cocoons.

The Asian Development Bank attempted last year to define build-back-better aspirations more precisely and concretely. The bank described four criteria: build back safer, build back faster, build back potential and build back fairer.

The first three are obvious. We clearly want our economies to recover fast, be safer and be more sustainable into the future. It’s the last objective – fairness – that will inevitably be the most challenging long-term goal at both the national and international level.

Economic fallout from the pandemic is already being experienced disproportionately among poorer households, in poorer regions within countries, and in poorer countries in general.

Some governments are aware of this and are trying to ameliorate this brewing inequality. At the same time, it is seen as politically unpalatable to engage in redistribution during a global crisis. Most governments are opting for broad-brush policies aimed at everyone, lest they appear to be encouraging class warfare and division or, in the case of New Zealand, electioneering.

In fact, politicians’ typical focus on the next election aligns well with the public appetite for a fast recovery. We know that speedier recoveries are more complete, as delays dampen investment and people move away from economically depressed places.

Speed is also linked to safety. As we know from other disasters, this recovery cannot be completed as long as the COVID-19 public health challenge is not resolved.

The failure to invest in safety, in prevention and mitigation, is now most apparent in the United States, which has less than 5% of the global population but a third of COVID-19 confirmed cases. Despite the pressure to “open up” the economy, recovery won’t progress without a lasting solution to the widespread presence of the virus.

Economic potential also aligns with political aims and is therefore easier to imagine. A build-back-better recovery has to promise sustainable prosperity for all.

The emphasis on job generation in New Zealand’s recent budget was entirely the right primary focus. Employment is of paramount importance to voters, so it has been a logical focus in public stimulus packages everywhere.

Fairness, however, is more difficult to define and more challenging to achieve.

While a rising economic tide doesn’t always lift all boats – as the proponents of growth-at-any-cost sometimes argue – a low tide lifts none. Achieving fairness first depends on achieving the other three goals.

Economic prosperity is a necessary precondition for sustainable poverty reduction, but this virus is apparently selective in its deadliness. Already vulnerable segments of our societies – the elderly, the immuno-compromised and, according to some recent evidence, ethnic minorities – are more at risk. They are also more likely to already be economically disadvantaged.

As a general rule, epidemics lead to more income inequality, as households with lower incomes endure the economic pain more acutely.

This pattern of increased vulnerability to shocks in poorer households is not unique to epidemics, but we expect it to be the case even more this time. In the COVID-19 pandemic, economic devastation has been caused by the lockdown measures imposed and adopted voluntarily, not by the disease itself.

These measures have been more harmful for those on lower wages, those with part-time or temporary jobs, and those who cannot easily work from home.

Many low-wage workers also work in industries that will be experiencing longer-term declines associated with the structural changes generated by the pandemic: the collapse of international tourism, for example, or automation and robotics being used to shorten long and complicated supply chains.

Poorer countries are in the worst position. The lockdowns hit their economies harder, but they do not have the resources for adequate public health measures, nor for assisting those most adversely affected.

In these places, even if the virus itself has not yet hit them much, the downturn will be experienced more deeply and for longer.

Worryingly, the international aid system that most poorer countries partially rely on to deal with disasters is not fit for dealing with pandemics. When all countries are adversely hit at the same time their focus inevitably becomes domestic.

Very few wealthy countries have announced any increases in international aid. If and when they have, the amounts were trivial – regrettably, this includes New Zealand. And the one international institution that should have led the charge, the World Health Organisation, is being defunded and attacked by its largest donor, the US.

Unlike after the 2004 tsunami, international rescue will be very slow to arrive. One would hope most wealthy countries will be able to help their most vulnerable members. But it looks increasingly unlikely this will happen on an international scale between countries.

Without global empathy and better global leadership, the poorest countries and poorest people will only be made poorer by this invisible enemy.The Conversation

About the Author:

Ilan Noy, Professor and Chair in the Economics of Disasters and Climate Change, Te Herenga Waka — Victoria University of Wellington

This article is republished from The Conversation under a Creative Commons license. Read the original article.


China cuts reserve ratio for large banks another 150 bps

By CentralBankNews.info

China’s central bank, the People’s Bank of China (PBOC) has lowered its reserve requirement for all large financial institutions by another 150 basis points to 11.00 percent, its second cut this year following a 50-point cut in January.
China’s large financial institutions include its four big banks: the Industrial & Commercial Bank of China, the China Construction Bank, the Agricultural Bank of China and the Bank of China.
PBOC’s cut in the reserve requirement on May 25 comes after China last week for the first time since 2002 dropped a annual target for economic growth, with Premier Li Keqiang saying the target was mainly scrapped because of the uncertainties from the global epidemic and trade, and the country’s development is facing some unpredictable factors, according to news reports.
Last year China targeted 6 to 6.5 percent annual economic growth, down from about 6.5 percent the previous year, reflecting the steady decline in growth since 14.2 percent in 2007.
The cut to the reserve ratio came the same day Yi Gang, governor of PBOC said in a newspaper interview the country would continue to strengthen its economic policy and its efforts to lower interest rates.
China has cut is benchmark interest rate, the Loan Prime Rate (LPR), twice this year by a total of 30 basis points and it currently stands at 3.85 percent.
China’s gross domestic product shrank 9.8 percent in the first quarter from the previous quarter and by 6.8 percent compared with the same quarter in 2019.
In the interview Yi also said PBOC’s measures since the outbreak of the coronavirus had amounted to 5.9 trillion yuan comprising cuts to reserve ratios and other lending facilities.
In March China’s state council, which is chaired by Premier Li, called on further reductions in the reserve requirement for both small and medium-sized banks, with PBOC on March 13 then lowering the reserve ratio by 50 to 100 basis points for banks that met inclusive financing targets.
Since 2018 PBOC has cut its three different reserve ratios 12 times, releasing some 8 trillion yuan in long-term funds, of which 1.75 trillion yuan were released this year following three cuts this year, PBOC said in a statement.
This includes the last cut to the reserve ratio of large financial institutions on Jan. 2, 2020, which freed up 800 billion yuan in funds, and the last cut to the reserve ratio of small banks that took place in two stages, each of 50 basis points, on April 15 and then May 15, freeing up 400 billion yuan.
PBOC operates three different reserve ratios: one for large banks, which includes the state-owned banks; one for mid-sized banks, which include join-stock banks, and one for small banks, such as 4,000 rural banks, rural cooperative banks, credit cooperatives and village and town banks.
As of May 15, the average reserve ratio of financial institutions was 9.4 percent, a decrease of 5.2 percentage points since the start of 2018
PBOC today also announced its first liquidity injection since late March via a 7-day reverse repo operation of 10 billion yuan at an unchanged 2.20 percent, saying this was “in order to keep the liquidity adequate at a reasonable level in the banking system.”

www.CentralBankNews.info


EURUSD Analysis: Recovering GfK index bullish for EURUSD

By IFCMarkets

Recovering GfK index bullish for EURUSD

GfK consumer confidence index recovered slightly in May: GfK consumer climate index edged up from -23.1 points in April to -18.9 points in May, when an increase to -19.1 was expected. This is bullish for EURUSD.

IndicatorVALUESignal
RSINeutral
MACDNeutral
Donchian ChannelNeutral
MA(200)Buy
FractalsBuy
Parabolic SARBuy


Summary of technical analysis

OrderBuy
Buy stopAbove 1.0971
Stop lossBelow 1.0905

Market Analysis provided by IFCMarkets