Coronavirus: how the pandemic has changed our perception of time

By Felix Ringel, Durham University

The COVID-19 pandemic has completely changed our lives. Take something as fundamental as our experiences of space: our mobility has become severely restricted – reduced to jogs or walks a few kilometres around our homes. Perhaps less obviously, the lockdown has also affected our experiences of time.

As an anthropologist of time, I investigate how human beings relate to time, particularly during crises. The current crisis, like many others, could be seen to deprive us of our “temporal agency” – the ability to structure, manage and manipulate our experience of time. For example, many of us will have already lost track of time, wondering which day of the week it is. It feels a bit as if time has come to a standstill.

The most important feature of our experiences of time during crisis is what anthropologist Jane Guyer termed “enforced presentism”: a feeling of being stuck in the present, combined with the inability to plan ahead. We currently don’t know when we can see our loved ones again, or when we can go on holiday. More severely, many of us don’t know when we’ll go back to work – or indeed if we have a job to go back to. In the midst of this crisis, it is hard to imagine a future that looks different than the present.

Tricking time

So how do we cope? I argue that this crisis has prompted us to be more creative with our relations to time. Most of us are even “tricking time” to some extent, as Roxana Moroşanu and I termed it in a recent paper. We speed up and slow down, bend and restructure time in many different ways.

“Corona time” in fact consists of many different times, such as the “time of lockdown”, “quarantine time” or “home office time”. We have learnt to inhabit these new presents. These lessons are deeply personal and differ in each household. Still, they speak of an experience shared worldwide.

Over the last few months, you will have deployed many temporal strategies yourself. This might include the construction of new rhythms and temporal structures. Daily exercises, weekly family Zoom meetings, a 6pm glass of wine or weekend cake baking all mark the passage of time. And home schooling has demanded new schedules – not to mention endless persuasion.

The clock of capitalism

For many, this feeling of stuckness is not new. Those who cannot keep up with the ever accelerating global flows of money, ideas, commodities and people often feel left behind. Critics of capitalism have therefore argued we need a slowing down of time.

In my work on postindustrial cities, I have studied our relationship with the future in times of economic crises. These crises are part and parcel of capitalism, as Marx told us more than 150 years ago. After the second world war, however, welfare states largely kept economic crises at bay.

But the 1980s neoliberal reforms of capitalism resulted in a dismantling of the welfare state. National governments stopped fathoming five-year plans. Just-in-time production and new technological developments, such as the internet, led to an unprecedented acceleration of time.

Temporally, neoliberalism has put humanity into crisis mode for several decades already. Without job security and in ever changing markets, many of us struggle to plan ahead – getting stuck in the present. The way to beat this stuckness is to “muddle through”, or as the British more heroically say, “keep calm and carry on”.

Many postindustrial cities, such as those in Wales and north-east England, have lost a take on their collective prospects. After years of industrial boom and high employment rates, many inhabitants now feel their towns have “no future”. The dismantling of local industries, such as mining, has led to high unemployment and unforeseen levels of migration out of the areas. The young and well-educated move away in search for jobs, while those who stay behind witness the slow decline of their hometown.

To overcome a lack of foresight and enforced presentism, their urban governments have had to reclaim the future planning rather than just responding to events. Despite ongoing decline, they have had to ask themselves: how do we want our city to look, say, in five years time?

Reclaiming the future

This applies to our current situation, too. Now is the time to think ahead about how life should look like in the post-COVID-19 future – we need to trick time further than for our personal households. Although a vaccine or proper treatment for COVID-19 is still not in sight, we have to try to shake the feeling of being trapped in the present. We now need to engage with the emerging politics of time, which will determine our near future.

For example, we will soon see different attempts at declaring an end to the pandemic, based on, for example, low numbers of new infections, and we should carefully assess them. We will also have to ask more fundamental questions about when this crisis is over: how can we solve the ongoing climate crisis? How can we prevent social inequalities in an unforeseen economic recession? How can we prevent another pandemic? The politics of time will also be crucial retrospectively: Have governments acted quickly enough?

Because the corona crisis has allowed us to experience a very different time, it will be interesting to see whether parts of this new normality, such as home offices and reduced mobility, will remain. But even if it is just an involuntary pause from capitalist times, we should reconsider neoliberalism’s temporal regimes of growth, decline and acceleration that have shaped life on Earth.

Our experiences of corona time has given us a training in temporal thought and flexibility. Humanity will weather this crisis, but there are others ahead. Perhaps then, it will be comforting to know that we can, and must, trick time and plan for the future – even when we feel stuck in the present.The Conversation

About the Author:

Felix Ringel, Assistant Professor of Anthropology, Durham University

This article is republished from The Conversation under a Creative Commons license. Read the original article.


Think Coronavirus Caused the Crash? These Two Charts Beg to Differ

By Elliott Wave International

Just about everyone thinks the coronavirus pandemic slammed global stock prices in February and March. Entire countries shut down; businesses closed up shop; unemployment soared. People stopped spending money beyond the essentials, so conventional wisdom would indeed expect stocks to slide as a result. Yet consider the below chart of the Shanghai Composite, China’s primary stock index.

Far from prompting a new bear market, the chart shows that the novel coronavirus appeared in Wuhan after a dozen-plus years of net decline in Chinese stock prices. Did the bear market instead prompt the pandemic?

Before we answer, let’s look at one more chart. The below chart shows the Dow Jones Industrial Average plotted against the daily number of new U.S. COVID-19 cases reported to the Centers for Disease and Prevention. The CDC’s case count is a function of disease prevalence, testing capacity and social awareness of the virus.

The Dow peaked on February 12 and began a precipitous fall, finishing the month down some 14% from its high. Yet the number of new daily COVID-19 cases essentially rounded to zero until March 3 when it hit double digits for the first time. Six days later the new daily case count reached triple digits for the first time; a week later new daily cases exceeded a thousand. By then, the Dow was already down more than 29% from its high. These data indicate that the fall in the Dow preceded the acceleration in confirmed new COVID-19 cases in the U.S., not the other way around.

The Dow registered a low on March 23, yet daily new COVID-19 cases continued to soar; on April 7, new cases peaked at 43,438. By then the Dow had already rebounded strongly, up 22% from its low. As the Dow continued higher in the following weeks, the number of new COVID-19 cases receded. These data indicate that the rise in the Dow from its March low preceded the decline in confirmed new COVID-19 cases in the U.S., not the other way around.

In summary: The market led, and the virus followed.

How can we make sense of these data? Robert Prechter’s socionomic theory proposes that social mood regulates the aggregate tenor and character of social trends — including the stock market and our collective susceptibility to epidemics. As social mood becomes more negative, society sends stock prices lower and becomes more vulnerable to epidemics. As social mood becomes more positive, society sends stock prices higher and becomes less vulnerable to epidemics.

Because society’s mood changes are swiftly reflected by the stock market, its trends tend to precede those of other mood manifestations. Thus major epidemics generally emerge or accelerate in countries after large-degree bear markets begin, a proposition which more than a century and a half of history supports.

We can also use socionomics to understand why the world was so unprepared for the coronavirus pandemic. Pundits place the blame on leaders, institutions and the absence of information. But a report from the May 2020 issue of The Socionomist goes deeper to reveal the true source of society’s complacency. It also illuminates how to use the stock market to identify when further risks to our lives and livelihoods are likely to intensify. You can read the entire issue when you join ClubEWI, the world’s largest Elliott wave educational community. Membership is free. Follow this link to join.

Mersana Therapeutics Trades 60% Higher on Positive Phase 1 Ovarian Cancer Trial Data

By The Life Science Report

Source: Streetwise Reports   05/27/2020

Shares of Mersana Therapeutics reached a new 52-week high price after the company reported positive interim data from the expanded portion of its Phase 1 study of XMT-1536 for treatment of ovarian cancer.

Clinical-stage biopharmaceutical company Mersana Therapeutics Inc. (MRSN:NASDAQ), which is focused on discovering and developing antibody-drug conjugates (ADCs) targeting cancers, today reported “interim safety, tolerability and efficacy data from the ongoing expansion portion of the Phase 1 study evaluating XMT-1536, its first-in-class ADC candidate targeting NaPi2b, in patients with ovarian cancer and non-small cell lung (NSCLC) adenocarcinoma.” Members of the company’s executive team held a conference call earlier today together with investigator Debra L. Richardson, MD, Associate Professor of Gynecologic Oncology at the Stephenson Cancer Center at the University of Oklahoma Health Sciences Center and the Sarah Cannon Research Institute, to present and discuss the trial data. The firm indicated that the data will be presented to the American Society of Clinical Oncology 2020 Virtual Scientific Program on Friday, May 29, 2020.

The company’s President and CEO Anna Protopapas commented, “These data demonstrate not only that XMT-1536, our first-in-class Dolaflexin ADC targeting NaPi2b, can deliver confirmed complete responses, partial responses and durable stable disease in platinum-resistant ovarian cancer, but also that these responses can deepen over time in a patient population with poor prognosis and limited treatment options…XMT-1536 continues to demonstrate that it is generally well tolerated, without the dose-limiting toxicities of other ADC platforms such as severe neutropenia, neuropathy and ocular toxicity. These are encouraging signals as we look forward to reporting more mature data in the second half of the year and continuing to advance XMT-1536 for both platinum-resistant ovarian cancer and NSCLC adenocarcinoma patients.”

The firm advised that “the expansion portion of the Phase 1 study is enrolling patients with platinum-resistant ovarian cancer, fallopian tube or primary peritoneal cancer who have received up to three lines of prior therapy and in some cases four lines of prior therapy regardless of platinum status as well as patients with NSCLC adenocarcinoma who had received prior treatment with platinum-based therapy and immunotherapy or targeted agents.” The company stated that the interim data reported covered 34 patients including 27 with ovarian cancer and 7 with NSCLC adenocarcinoma.

The company highlighted some of the key findings in the study including that XMT-153 achieved a 35% objective response rate, including 10% complete response rate and 80% disease control rate among 20 evaluable patients with ovarian cancer.The firm stated that XMT-1536’s safety profile was consistent with previously reported dose escalation data and no new safety signals were observed. Additionally, the firm advised that promising antitumor activity was observed in platinum-resistant ovarian cancer and that the data continue to support a NaPi2b biomarker-based patient selection strategy.

Mersana Therapeutics is a clinical-stage biopharmaceutical company based in Cambridge, Mass., that utilizes its proprietary ADC platforms to develop novel ADCs with the goal of achieving optimal efficacy, safety and tolerability to improve the lives of individuals fighting cancer. In addition to XMT-1536, which is currently being tested in the expansion portion of a Phase 1 proof-of-concept clinical study in patients with ovarian cancer and NSCLC adenocarcinoma, the company also has a second ADC product candidate, XMT-1592, that is targeting NaPi2b-expressing tumors. The firm advised that XMT-1592 was created using its Dolasynthen platform and is in the dose escalation portion of a Phase 1 clinical study.

Mersana Therapeutics started off the day with a market capitalization of around $634.3 million with approximately 58.95 million shares outstanding and a short interest of about 4.0%. MRSN shares opened 45% higher today at $15.68 (+$4.90, +45.45%) over yesterday’s $10.78 closing price and reached a new 52-week high price of $18.50. The stock has traded today between $13.26 and $18.50 per share and is currently trading at $17.55 (+$6.79, +63.10%).

Sign up for our FREE newsletter at: www.streetwisereports.com/get-news

Disclosure:
1) Stephen Hytha compiled this article for Streetwise Reports LLC and provides services to Streetwise Reports as an independent contractor. He or members of his household own securities of the following companies mentioned in the article: None. He or members of his household are paid by the following companies mentioned in this article: None.
2) The following companies mentioned in this article are billboard sponsors of Streetwise Reports: None. Click here for important disclosures about sponsor fees.
3) Comments and opinions expressed are those of the specific experts and not of Streetwise Reports or its officers. The information provided above is for informational purposes only and is not a recommendation to buy or sell any security.
4) The article does not constitute investment advice. Each reader is encouraged to consult with his or her individual financial professional and any action a reader takes as a result of information presented here is his or her own responsibility. By opening this page, each reader accepts and agrees to Streetwise Reports’ terms of use and full legal disclaimer. This article is not a solicitation for investment. Streetwise Reports does not render general or specific investment advice and the information on Streetwise Reports should not be considered a recommendation to buy or sell any security. Streetwise Reports does not endorse or recommend the business, products, services or securities of any company mentioned on Streetwise Reports.
5) From time to time, Streetwise Reports LLC and its directors, officers, employees or members of their families, as well as persons interviewed for articles and interviews on the site, may have a long or short position in securities mentioned. Directors, officers, employees or members of their immediate families are prohibited from making purchases and/or sales of those securities in the open market or otherwise from the time of the interview or the decision to write an article until three business days after the publication of the interview or article. The foregoing prohibition does not apply to articles that in substance only restate previously published company releases.
6) This article does not constitute medical advice. Officers, employees and contributors to Streetwise Reports are not licensed medical professionals. Readers should always contact their healthcare professionals for medical advice.

( Companies Mentioned: MRSN:NASDAQ,
)

Does The Trump V Obama Rivalry Impact Markets?

By Orbex

Former President Barack Obama recently broke precedent when he came out with public political commentary. Of course, the argument can be made that the current situation is unprecedented, and most leaders are working in uncharted territory. And precedent can and has changed in the past.

Prior presidents have established something of a tradition to stay away from partisan issues and largely keep out of current affairs.

Recent presidents had good personal reasons to lay low following the end of their term. Bush was quite unpopular when he left office. Before him, Clinton ended his term in a massive scandal that saw him impeached during his last year in office.

Going further back, Bush Sr lost reelection, and Regan wasn’t interested in criticizing his former VP.

The Trump Era

Obama hasn’t exactly stayed out of the spotlight following the end of his presidency, at least compared to his predecessor. Soon after the end of his presidency, he and his wife entered a multi-part production deal with Netflix to produce documentaries. The most recent of which released focusing on former First Lady Michelle Obama. Obama has also appeared in the media frequently promoting books about his administration.

On the other hand, Trump has quite enthusiastically embraced the long-standing political tradition of blaming as much as he can on his predecessor. He has more reason to do so, given the difficulties of the transition, and the evolving saga of the Trump-Russia-Muller-Flynn-Obamagate issue.

Obama accused Trump quite pointedly of being a traitor (the less kind version of winning the election thanks to Russian interference). Trump believes his campaign was spied on by a corrupt law enforcement/intelligence apparatus at the behest of his predecessor.

But the Markets?

The part of the spat between Obama and Trump that most concerns the markets is the upcoming election. It is likely to pit the two against each other with even more intensity. Biden’s campaign is banking on his connection to the still-popular former president to clear the way to the White House.

Until recently, Obama has been hesitant about supporting Biden. In fact, he actively discouraged his candidacy at the beginning. It would be inevitable that Obama’s legacy would come into question during a Biden campaign. And as the former VP’s largest asset, it’s inevitable that Trump will attack it.

Changing Horses in the Middle of the Race

Many analysts predict that Biden’s campaign will crash and burn – including members of his campaign and former Obama staffers.

A couple of days ago, a conference call was revealed in which a staffer said that the projected fast economic recovery in the latter part of the year would give Trump the best economic numbers in history. In general, voters loath to change leaders in the middle of a crisis. Especially as a crisis is still being resolved.

Obama likely frets over his image and influence if his star power can’t buoy Biden’s campaign, and will want to lean on the scales to support his protegé.

However, in an already highly divisive era, the rivalry between Trump and Obama might further inflame passions. The markets don’t like uncertainty. Without a clear favorite to win in November, we could see less appetite for risk as the political campaign starts to heat up.

By Orbex


Romania cuts rate 2nd time, continues asset purchases

By CentralBankNews.info

Romania’s central bank cut its policy rate for the second time this year amid what it said was “extremely uncertain and highly difficult conditions” about the evolution and implications of the coronavirus pandemic on the outlook for inflation and the economy.
The National Bank of Romania (NBR) cut its monetary policy rate by another 25 basis points to 1.75 percent and has now cut it 75 basis points this year following a 50-point cut at an emergency monetary policy meeting on March 20 when it also decided to begin buying government securities in the secondary market, known as quantitative easing.
NBR today also lowered its deposit facility rate by 25 basis points to 1.25 percent, the Lombard facility lending rate to 2.25 percent from 2.50 percent, and said it would conduct further repo transactions and continue to purchase leu-denominated government securities on the secondary market “given the liquidity shortfall on the money market.”
It added it would seek to maintain international reserves, including foreign exchange, “at an optimal level.”
NBR’s monetary policy committee said a new quarterly inflation report, which will be released on June 12, forecasts inflation climbing into the upper half of its target range in the latter part of this year and then remaining around the midpoint amid disinflationary pressures from a deficit of demand.
This rise inflation will follow a moderate decline in the second quarter.
However, NBR also said the “uncertainty surrounding the inflation outlook is unusually elevated” and the severe economic impact from the pandemic, which is likely to “abruptly change the Romanian economy’s path in mid-2020, is now beginning to be reflected in economic data.
Romania’s inflation rate fell to 2.7 percent in April from 3.1 percent in the previous two months, mainly due to disinflationary base effects and the plunge in oil prices along with a removal of special excise duties on motor fuels.
NBR targets inflation of 2.5 percent, plus/minus 1 percentage points and in February it lowered its 2020 inflation outlook to 3.0 percent from an earlier 3.1 percent. For 2021 NBR had forecast inflation of 3.2 percent.
Romania’s economy slowed visibly to growth of 2.4 percent in the first quarter, on an annual basis, from 4.3 percent in the previous quarter despite what NBR said was particularly robust growth in the first two months of the year.
Compared with the fourth quarter of 2019, Romania’s gross domestic product grew only 0.3 percent in the first quarter, down from 1.2 percent growth.
NBR confirmed its decision from March that it was not holding scheduled monetary policy meetings but its monetary policy committee would continue to hold meetings “whenever necessary” given the elevated uncertainty around economic and financial developments.

The National Bank of Romania issued the following statement:

“In its meeting of 29 May 2020, the Board of the National Bank of Romania decided the following:
  • to cut the monetary policy rate to 1.75 percent per annum from 2.0 percent per annum starting 2 June 2020;
  • to lower the deposit facility rate to 1.25 percent per annum from 1.50 percent per annum and the lending (Lombard) facility rate to 2.25 percent per annum from 2.50 percent per annum;
  • to maintain the existing levels of minimum reserve requirement ratios on both leu- and foreign currency-denominated liabilities of credit institutions;
  • to further conduct repo transactions and continue to purchase leu-denominated government securities on the secondary market.
The global economy and its outlook have been strongly affected by the major adverse impact and the unprecedented uncertainty generated by the coronavirus pandemic, alongside the containment measures imposed by the authorities. With a view to cushioning the fallout, many central banks in the advanced and emerging economies, the ECB and central banks in the region included, took measures to ease the monetary policy stance and improve financial conditions, consisting in policy rate cuts, purchases of financial assets and liquidity provision via repurchase transactions, even over the long term.
Likewise, the National Bank of Romania’s response in this context was prompt. Specifically, the NBR Board convened for an emergency meeting on 20 March 2020 and adopted a package of measures aimed at mitigating the economic impact of the pandemic, but also at consolidating liquidity in the banking system so as to ensure the smooth functioning of the money market and of other financial market segments, as well as the smooth financing of the real economy and the public sector. The package included a cut in the monetary policy rate by 0.50 percentage points, to 2.00 percent, and the narrowing of the corridor defined by interest rates on standing facilities to ±0.5 percentage points from ±1.0 percentage point, which implied leaving the deposit facility rate unchanged at 1.50 percent and lowering the lending facility rate by 1 percentage point to 2.50 percent. In addition, it was decided that the NBR should conduct repo transactions for providing liquidity to credit institutions, as well as purchases of leu-denominated government securities on the secondary market.
On the domestic front, the severe economic impact of the coronavirus pandemic – likely to abruptly change the Romanian economy’s path in mid-2020 – began to reflect in the latest statistical data.
The annual CPI inflation rate remained unchanged in March at 3.05 percent and then fell to 2.68 percent in April (from 4.0 percent in December 2019). Behind its decline versus December 2019 stood disinflationary base effects and the plunge in the oil price, alongside the removal of the special excise duty on motor fuels.
The annual adjusted CORE2 inflation rate (which excludes from the CPI inflation administered prices, volatile prices, and tobacco product and alcoholic beverage prices) tended however to increase slightly during the first four months of 2020, contrary to forecasts, reaching 3.7 percent in April from 3.66 percent in December 2019. The evolution owed to changes in consumption structure brought about by social distancing measures, associated also with probable disruptions and cost increases in production and supply chains, overlapping persistent demand-pull and wage cost-push inflationary pressures.
Average annual CPI inflation rate and average annual inflation rate calculated based on the Harmonised Index of Consumer Prices dropped to 3.7 percent in March and 3.6 percent in April from 3.8 percent and 3.9 percent respectively reported December 2019 through February 2020.
According to preliminary data, economic growth slowed down visibly in 2020 Q1 to 2.7 percent from 4.3 percent in the previous quarter, in spite of remaining particularly robust in the first two months of the year. At the same time, the trade deficit posted a markedly faster widening amid a steeper decline in exports than in imports of goods and services. Consequently, the dynamics of the current account deficit regained momentum, the improvement in the primary and secondary income balances notwithstanding.
Financial market conditions improved after the adoption of the monetary policy decisions and after overcoming at end-March the peak of tensions generated by the COVID-19 crisis. Key interbank money market rates witnessed a significant downward adjustment in the closing 10-day period of March and afterwards continued to decline gradually, while interest rates on leu-denominated government securities went down progressively, amid the increased volume of liquidity injected by the NBR through bilateral repo operations and through purchases of leu-denominated government securities on the secondary market. At the same time, the EUR/RON exchange rate saw lower fluctuations, moving in a narrow range, inter alia amid an improvement in global financial market sentiment.
Lending remained relatively strong in March, before coming under the influence of the pandemic crisis in April. Thus, the stock of credit to the private sector contracted slightly, its annual dynamics slowing to 5.7 percent from 6.9 percent a month earlier. The share of domestic currency loans in total private sector credit narrowed slightly to 67.1 percent against 67.6 percent in December 2019.
In today’s meeting, the NBR Board examined and approved the May 2020 Inflation Report, which incorporates the latest available data and information. The current macroeconomic forecasts were made under extremely uncertain and highly difficult conditions, amid multiple unknowns concerning the evolution and implications of the pandemic and the related measures. The new scenario shows a change in the envisaged trajectory of the annual inflation rate, especially in the second part of the forecast horizon. Specifically, after having posted a moderate decline in 2020 Q2, the annual inflation rate is expected to climb again in the upper half of the variation band of the target in the latter half of this year, before repositioning itself and remaining around the mid-point of the target until the end of the projection horizon, amid disinflationary pressures from the aggregate demand deficit.
The uncertainty surrounding the inflation outlook is unusually elevated, given the unprecedented nature of such an economic shock domestically and internationally, implying an abrupt lockdown on businesses and sectors, but also consumer behaviour shifts. Major sources of uncertainty are also the speed of economic recovery following the gradual removal of containment measures and the effectiveness of support programmes and actions addressing companies and households. On the domestic front, significant uncertainties relate to the fiscal and income policy stance, as well as to the functioning of the monetary transmission mechanism in the context of legislative initiatives targeting the banking system. Increased uncertainty and risks also stem from the euro area and world economy contraction and from the international financial market developments amid the coronavirus pandemic crisis.
In today’s meeting, based on the currently available data and assessments, but also in light of the extremely high uncertainty, the NBR Board decided to cut the monetary policy rate to 1.75 percent per annum from 2.0 percent per annum starting 2 June 2020. Moreover, it decided to lower the deposit facility rate to 1.25 percent per annum from 1.50 percent per annum and the lending (Lombard) facility rate to 2.25 percent per annum from 2.50 percent per annum. Furthermore, the NBR Board decided to maintain the existing levels of minimum reserve requirement ratios on both leu- and foreign currency-denominated liabilities of credit institutions. Given the liquidity shortfall on the money market, the Board decided to further conduct repo transactions and continue to purchase leu-denominated government securities on the secondary market, keeping financial market stability. Moreover, the central bank will seek to maintain international reserves, forex ones included, at an optimal level.
The NBR Board decisions aim to ensure and preserve price stability over the medium term in a manner conducive to achieving sustainable economic growth and amid safeguarding financial stability.
The new quarterly Inflation Report will be published on the NBR’s website at 5:00 p.m. The account (minutes) of discussions underlying the adoption of the monetary policy decision during today’s meeting will be posted on the NBR’s website on 12 June 2020, at 3:00 p.m.
Given the elevated uncertainty surrounding economic and financial developments, the NBR Board decision to suspend the previously announced calendar of monetary policy meetings remains in place and monetary policy meetings will be held whenever necessary.”


Biden, Keystone XL and a Green New Deal could shake up Canada’s energy industry

By Warren Mabee, Queen’s University, Ontario

U.S. Democratic presidential candidate Joe Biden recently reiterated his desire to stop the Keystone XL oil pipeline project. “I’ve been against Keystone from the beginning. It is tarsands that we don’t need — that in fact is a very, very high pollutant,” he said.

This is just the latest move in a long political game with respect to Keystone XL. In 2015, Vice-President Biden supported President Barack Obama’s decision to block the pipeline. After the 2017 election, President Donald Trump restored the project. If completed, the 1,900-kilometre pipeline would carry crude oil from Alberta to Nebraska, ultimately feeding refineries on the Gulf Coast.

Now Biden says he would shut it down again if he’s elected president in November. Canadians need to know that he is really making three arguments against the project, which may require Canada to re-examine its energy sector strategy.

‘High pollutant’

Biden points to Canada’s oilsands as having “… very, very high pollutant” levels. There is some truth to this perception.

In the United States, the production of conventional oil and its transport to refinery gates produce about 7.1 grams of carbon dioxide equivalents of greenhouse gases for each megajoule of energy (CO2e/MJ). Shale oil compares favourably at 3.5-14 g CO2e/MJ, for production, but these figures do not include upgrading and transport, or refining. Long-term studies of Canadian oilsands surface mining suggest greenhouse gas (GHG) emissions range from 8.7 g CO2e/MJ to 15-23 g CO2e/MJ (the latter figures include upgrading).

The transport of the oil product to refineries in the U.S. increases the GHG emissions of Canadian oil to between 16-33 g CO2e/MJ, depending on the distance covered and whether the product is moved through pipelines (smaller footprint) or by rail (large footprint). When taken together, this shows that greenhouse gas emissions of oilsands production, upgrading and transport are at least four times greater than U.S. conventional oil.

Alberta and the oil industry have fought back against these negative perceptions. The Canadian Association of Petroleum Producers report that GHG emissions per unit of GDP have declined by 20 per cent since 2005, although total emissions from oilsands have more than doubled between 2000 and 2017. Alberta Premier Jason Kenney has invested $30 million into a “war room,” echoing past campaigns labelling oil from overseas as “conflict oil.”

The scientific literature has provided Canadian producers with some arguments to support oilsands production. For example, the relatively low GHG emissions of shale oil are counterbalanced by a host of negative impacts on water supply and quality, issues of geological instability and earthquakes, and growing concern about the longevity of shale operations.

Yet the Canadian energy sector is still perceived as a poor environmental performer. Earlier this month, Norway’s Sovereign Wealth Fund excluded key oilsands producers from its portfolio, and BlackRock, the world’s largest asset manager, also pulled out of oilsands companies in early 2020. Recent research found oilsands emissions may be up to 30 per cent higher than what the industry reports.

‘We don’t need’ that oil

Biden also suggested that the U.S. doesn’t need Canadian oilsands resources, a reflection of the dramatic shifts in U.S. oil production over the past decade. In 2010, the U.S. produced about five million barrels of oil per day, but it now has the capacity to produce 17.9 million barrels a day.

A big part of this growth has been due to shale production, which grew to about 12.2 million barrels per day in 2019 from just over 0.5 million barrels per day in 2010. Canadian oil, which amounts to about 4.55 million barrels per day, was once critical to U.S. energy security but has become less relevant.

The current COVID-19 situation has further decreased the U.S. need for oil. As 2020 unfolds, investors are predicting oil production drops of up to 2.9 million barrels per day across the U.S. Much of produced oil is being stored, and oil storage capacity is rapidly filling up (or, perhaps not). Regardless, demand for gasoline and other oil products has reached its lowest point since 1971.

What will happen to oil demand as we exit the pandemic and the economy restarts? Some speculate that more and more people will work from home on a semi-permanent basis, giving governments licence to redesign roadways and increase active transit options.

Others warn that car travel may increase, sparking a resurgence in demand for gasoline and other refined oil products, and leading to declines in public transit use.

‘We’re gonna transition … to a clean economy’

Biden’s comments emphasized the need to transition away from fossil fuels, echoing calls for a Green New Deal, championed by key Democrats such as congresswoman Alexandria Ocasio-Cortez.

The Green New Deal combines a series of goals including 100 per cent renewable energy, along with full access to health care and guaranteed wages. As one of the most senior Democrats to endorse the Green New Deal, Biden could be expected to support this movement should he win the White House.

But the Green New Deal may be a difficult sell in the post-COVID world. While renewable energy generation costs are increasingly cheaper, it is hard to compete against extremely low oil prices, and upgrading the grid to deliver renewable energy may result in higher electricity costs for consumers — something that may not be easy to manage during a major recession.

Very real concerns about energy poverty and inequality must be also be addressed within a Green New Deal — and it will take time to do this right. These concerns and challenges will buy countries like Canada time to adapt their own energy sector to better serve a rapidly changing market south of the border.

Biden’s words should lead Canadians to pause and reflect on the direction that the energy sector is going. Canadian companies depend on the international marketplace, and that marketplace is demanding cleaner energy products.

The U.S. has already become a major oil producer, and it’s left Canadian companies struggling. A Green New Deal will simply serve to accelerate these trends. Without significant change, Canada’s energy sector risks being left behind.The Conversation

About the Author:

Warren Mabee, Director, Queen’s Institute for Energy and Environmental Policy, Queen’s University, Ontario

This article is republished from The Conversation under a Creative Commons license. Read the original article.


NZDUSD Analysis: Improving New Zealand business sentiment bullish for NZDUSD

By IFCMarkets

Improving New Zealand business sentiment bullish for NZDUSD

New Zealand business confidence improved in a May: it rose to -41.8 points after edging up to -45.6 in April. Readings above 0.0 indicate optimism, below indicate pessimism. This is bullish for NZDUSD.

IndicatorVALUESignal
RSINeutral
MACDBuy
Donchian ChannelBuy
MA(200)Buy
FractalsBuy
Parabolic SARBuy


Summary of technical analysis

OrderBuy
Buy stopAbove 0.6226
Stop lossBelow 0.6188

Market Analysis provided by IFCMarkets

Crude Fighting For Direction

By Orbex

Inventories Rise Again

It’s been more of a mixed week for oil markets following the firm rally seen over recent weeks. The latest report from the Energy Information Administration showed that in the week ending May 22nd, US crude stores rose by a further 7.9 million barrels.

This increase puts an end to the recent run of three consecutive weekly drawdowns. It is in stark contrast to the 1.9 million barrel drawdown the market was looking for.

The report was not totally bearish, however. Gasoline inventories were down 724k barrels over the week to 255 million barrels. This was against expectations of a 100k barrel rise and reflects the gradual but ongoing pickup in demand as more motorists return to the roads amidst lockdowns easing in the US.

However, distillate stockpiles, which include diesel and heating oil, were higher again also rising by 5.5 million barrels over the week to 164.3 million barrels. This was over three times the 1.8 million barrel increase forecast.

Regionally, stocks at the Cushing delivery hub in Oklahoma were down 3.4 million barrels over the week. Refinery utilization rates rose 1.9% over the week with refinery crude runs increasing by 88k barrels per day.

Risk Factors Offsetting Optimism

Crude prices have been caught between opposing forces this week. Better risk appetite amidst the ongoing increase in demand and activity as global stay-at-home measures ease have been providing support.

However, concerns over rising tensions between the US and China and a prospect of renewed trade tensions have raised dark clouds on the horizon.

There are also concerns that Russia is planning to ease supply cuts from July onwards. This would be a heavy blow to the production cuts currently in place among OPEC+ members.

For now, it seems that optimism over the ongoing post-lockdown recovery is keeping oil prices supported. Encouraging headlines regarding potential COVID-19 vaccines has also helped stoke risk appetite, keeping oil supported even amidst the dip this week as equities continue to rally higher.

Crude Holding Above Broken Trend Line

Following the breakout above the bearish trend line from 2020 highs, oil prices have stagnated around the 33.17 level as the market awaits fresh directional drivers.

To the downside, the key support level to watch is 28.94, which also holds the retest of the broken bearish trend line. While this level holds, the focus is on further upside and a run-up to the 42.43 level next.

By Orbex


Arconic, Alcoa, Hertz & Barrick Gold lead Weekly Top Gainers/Losers

By IFCMarkets

Top Gainers – The World Market

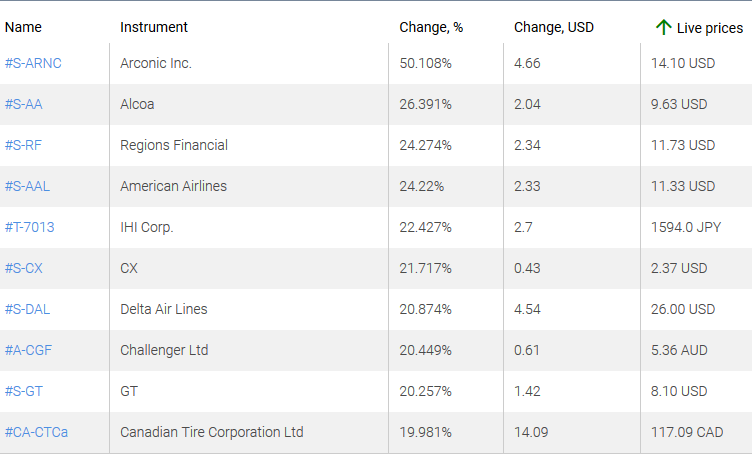
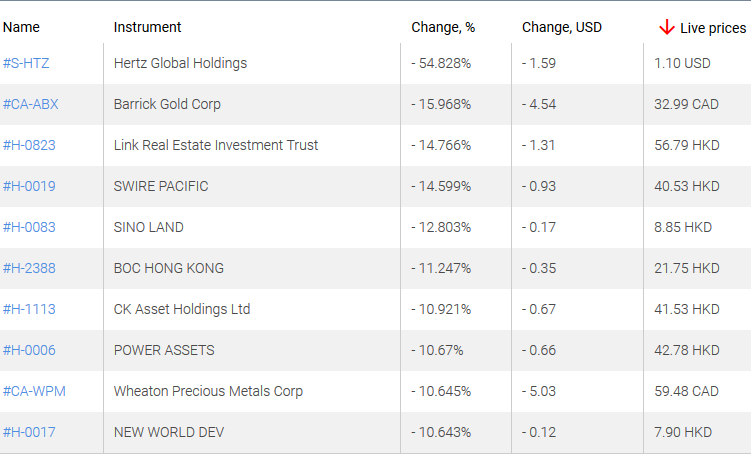
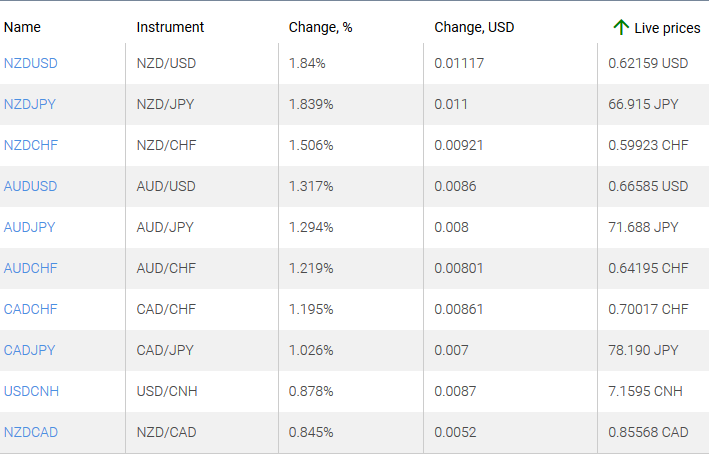
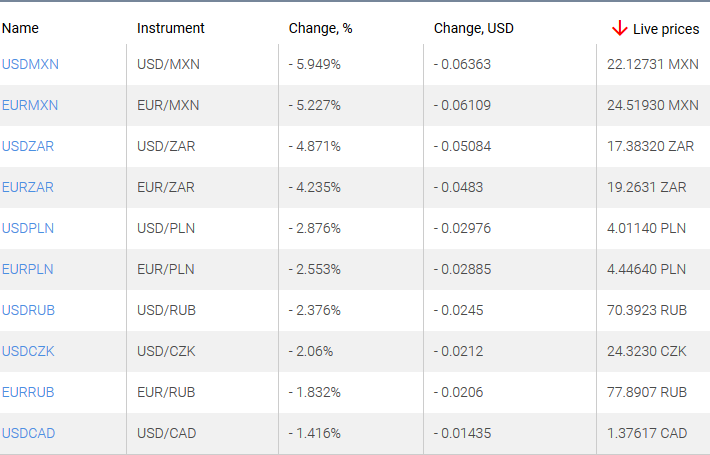
World stock indices continue to increase actively. Over the past 7 days, the stocks of industrial and aviation companies became the top leaders, previously being significantly behind in growth. Currencies of commodity countries, such as Australia, New Zealand, Mexico, South Africa, remain in high demand.

1.Arconic Inc, 50.108% – an American manufacturer of aluminum products.

2.Alcoa Corp., 26.391% – an American primary aluminum mining company.

market sentiment ratio long short positions

 Top Losers – The World Market

1. Hertz Global Holdings, Inc. – an American car rental company.

2. Barrick Gold Corp – a Canadian Gold Mining Company.

market sentiment ratio long short positions

 Top Gainers – Foreign Exchange Market (Forex)

1. NZDUSD, NZDJPY – the growth of these charts means the strengthening of the New Zealand dollar against the US dollar and Japanese yen.

2. AUDUSD, AUDJPY – the growth of these charts means the strengthening of the Australian dollar against the US dollar and the Japanese yen.

market sentiment ratio long short positions

 Top Losers – Foreign Exchange Market (Forex)

1. USDMXN, EURMXN – the fall of these charts means the strengthening of the Mexican peso against the US dollar and the euro.

2. USDZAR, EURZAR – the fall of these charts means the weakening of the US dollar and the euro against the South African rand.

market sentiment ratio long short positions

Market Analysis provided by IFCMarkets

Note:
This overview has an informative and tutorial character and is published for free. All the data, included in the overview, are received from public sources, recognized as more or less reliable. Moreover, there is no guarantee that the indicated information is full and precise. Overviews are not updated. The whole information in each overview, including opinion, indicators, charts and anything else, is provided only for familiarization purposes and is not financial advice or а recommendation. The whole text and its any part, as well as the charts cannot be considered as an offer to make a deal with any asset. IFC Markets and its employees under any circumstances are not liable for any action taken by someone else during or after reading the overview.

EU stimulus overshadows US/China tensions

By Orbex

EURUSD Finally Breaks Past 1.1000 Level

The euro is trading above the 1.1000 level for the first time in two months.

The gains came about on the Eurozone stimulus.

The current gains will now see the upside rising towards 1.1132 where there is a strong chance of resistance to form.

In the near term, watch for a potential pullback to the current gains.

Forming support near 1.1000 will potentially validate the upside bias.

But for the moment, the price level near 1.1000 remains vulnerable.

A close below this level once again will put EURUSD back into its old sideways range.

GBPUSD Attempts To Recover After A Pullback

The GBPUSD currency pair is looking somewhat bullish after the initial pullback looks to be complete.

Price action fell back to the price level of 1.2277 after a brief rise initially.

The current recovery will confirm the potential upside for the currency pair.

We expect GBPUSD to rise to 1.2424 in the near term. This will push prices up to the 8th of May highs.

Further gains will likely happen only on a breakout above this level.

In the meantime, we expect GBPUSD to remain in a holding pattern within these new levels.

Oil Prices Slip Below $33.66 Once Again

WTI Crude oil prices are finding it difficult to break past the 33.66 level.

After briefly trading above this level, oil prices are back below this handle once again.

But as a result, a soft double bottom pattern is forming near 31.72. This puts the upside bias toward a target of 37.00.

Given that oil prices remain vulnerable to the fundamentals, there is potential that prices could pullback lower.

Furthermore, prices have failed to establish any lower support which also adds to this view.

Therefore, if oil fails to breakout above 33.66, then we could see the downside risks building up.

XAUUSD Consistently Posting Lower Highs

The precious metal is trading somewhat bullish as it attempts to recover the losses from the previous two sessions.

However, the intraday charts show a consistent lower high forming, alongside lower lowers.

This is indicative of a downtrend that is not that significant just yet. For now, prices are back above the 1717.65 level.

A breakdown here could see price slipping to previous lows of 1696.86.

Only a strong close below this level will confirm further downside which could come around the 1671.95 level.

By Orbex