Forex Technical Analysis & Forecast 01.06.2020 (EURUSD, GBPUSD, USDRUB, USDJPY, USDCHF, AUDUSD, GOLD, BRENT, BTCUSD, S&P 500)

Article By RoboForex.com

EURUSD, “Euro vs US Dollar”

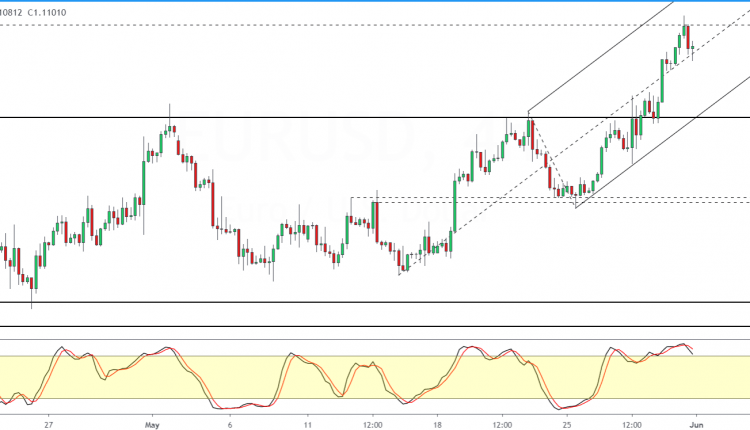
After finishing another ascending wave at 1.1111, EURUSD is consolidating around 1.1118. Possibly, the pair may expand the range up to 1.1157 and then return to 1.1118. If later the price breaks the range to the upside, the market may start a new growth towards 1.1192; if to the downside – resume trading inside the downtrend with the target at 1.1081.

EURUSD
Risk Warning: the result of previous trading operations do not guarantee the same results in the future

GBPUSD, “Great Britain Pound vs US Dollar”

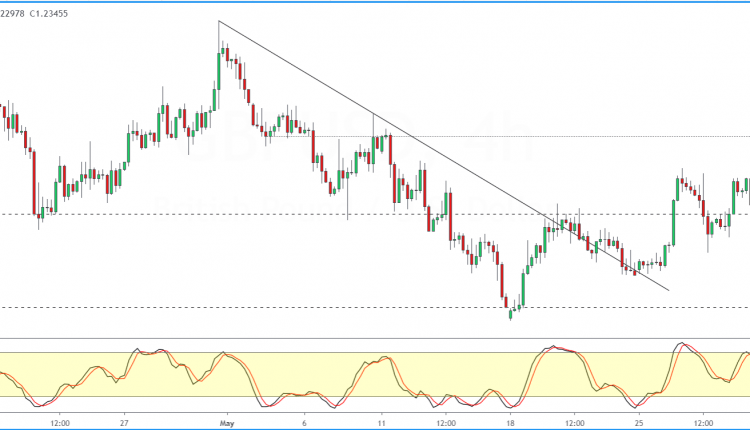
After breaking 1.2362 to the upside, GBPUSD is expected to continue growing towards 1.2447. After that, the instrument may start a new decline to reach 1.2362 and then form one more ascending structure with the target at 1.2518.

GBPUSD
Risk Warning: the result of previous trading operations do not guarantee the same results in the future

USDRUB, “US Dollar vs Russian Ruble”

USDRUB is consolidating to break 70.70 to the downside. Possibly, the pair may reach 69.86 and then return to 70.70 to test it from below. After that, the instrument may form one more ascending structure with the target at 69.44, at least.

USDRUB
Risk Warning: the result of previous trading operations do not guarantee the same results in the future

USDJPY, “US Dollar vs Japanese Yen”

After completing the ascending structure at 107.86, USDJPY is falling to reach 107.44. Later, the market may resume trading upwards with the target at 107.64.

USDJPY
Risk Warning: the result of previous trading operations do not guarantee the same results in the future

USDCHF, “US Dollar vs Swiss Franc”

USDCHF continues falling towards 0.9590. After that, the instrument may resume trading downwards with the target at 0.9650.

USDCHF
Risk Warning: the result of previous trading operations do not guarantee the same results in the future

AUDUSD, “Australian Dollar vs US Dollar”

After breaking 0.6692 to the upside, AUDUSD is expected to continue growing towards 0.6772. Later, the market may fall to return to 0.6692.

AUDUSD
Risk Warning: the result of previous trading operations do not guarantee the same results in the future

BRENT

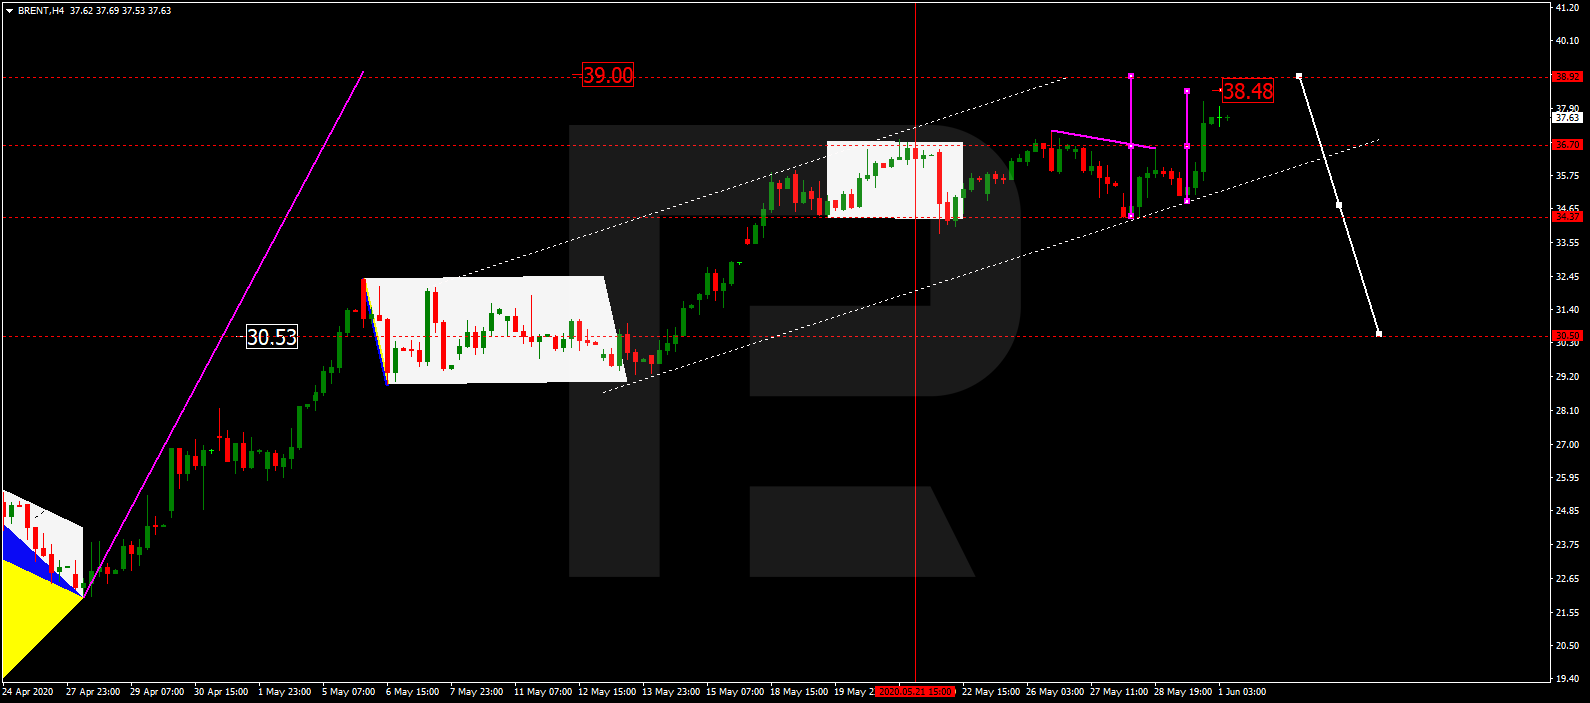
After breaking 36.66, Brent is expected to reach 38.48, After that, the instrument may correct towards and return to 36.66. Later, the market may resume trading upwards with the target at 39.00 and then start a new correction towards 30.50.
BRENT
Risk Warning: the result of previous trading operations do not guarantee the same results in the future

XAUUSD, “Gold vs US Dollar”

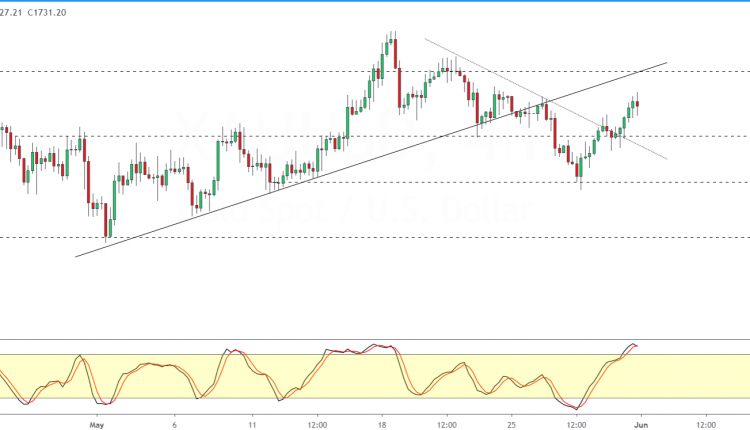
After breaking 1734.34, Gold is expected to form one more ascending structure towards 1750.10. After that, the instrument may correct to test 1734.34 from above and then resume trading upwards with the target at 1775.50.

GOLD
Risk Warning: the result of previous trading operations do not guarantee the same results in the future

BTCUSD, “Bitcoin vs US Dollar”

After completing the ascending wave at 9700.00, BTCUSD has finished the descending impulse to reach 9400.00 along with the correction towards 9500.00. Possibly, today the pair form a new descending structure to break 9400.00 and then continue trading downwards with the target at 9200.00.

BITCOIN
Risk Warning: the result of previous trading operations do not guarantee the same results in the future

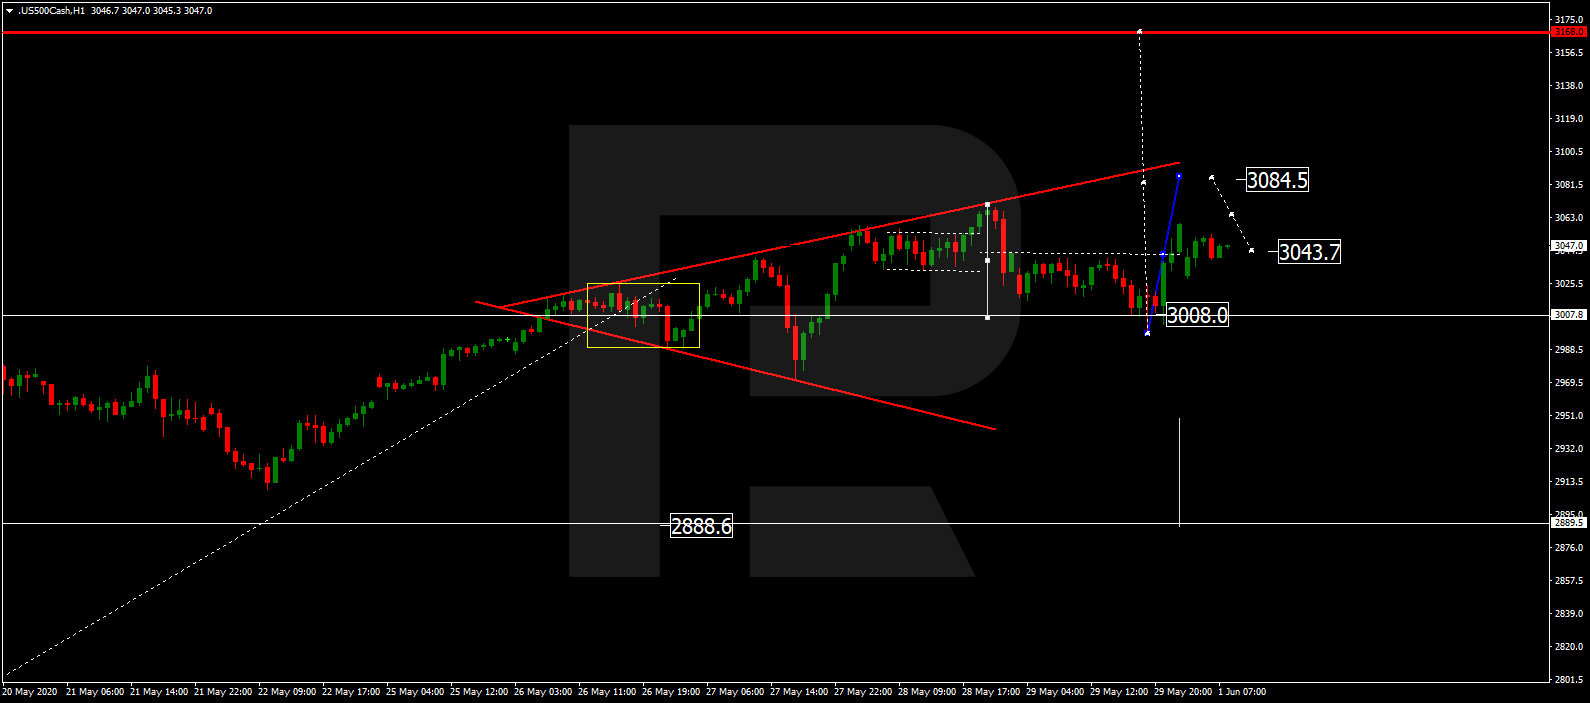
S&P 500

The Index is still growing. Today, the asset may reach 3084.5 and then fall towards 3043.7. After that, the instrument may start a new growth with the target at 3160.5.
S&P 500

Article By RoboForex.com

Attention!
Forecasts presented in this section only reflect the author’s private opinion and should not be considered as guidance for trading. RoboForex LP bears no responsibility for trading results based on trading recommendations described in these analytical reviews.

US Troops Deployed In LA Amidst Rioting

By Orbex

US Tensions Take Centre Stage

Over recent weeks the tensions between the US and China have been dominating market attention. US criticism over China’s alleged role in the COVID-19 outbreak, as well as over its new National Security Law in Hong Kong, has impacted markets. In recent days, however, tensions within the United States itself exploded into focus.

Protests have sprung up across the country following the unlawful killing of black US citizen George Floyd during an arrest last week. Citizens are outraged at yet another black victim of police brutality.

The protests have taken place in many major cities across the US. These include New York, LA, Las Vegas, Atlanta, and Philadelphia. They have quickly escalated into violence with riots breaking out across the weekend. These resulted in the killing of one police officer and one rioter. Nearly 2000 people have been arrested.

In a dramatic development, the National Guard has been deployed in LA for the first time since the 1992 riots which sprung up in the wake of the Rodney King killing.

Curfews are in place across the country. These are aimed at curtailing the unrest which is unfolding mainly after dark. However, curfews have so far been defied as the protests and riots continue. It has grown to be an increasingly volatile and dangerous situation for all.

Trump Criticised For Provocative Response

Trump has drawn heavy criticism over his handling of the situation. Via his twitter channel, Trump was accused of threatening rioters with violence writing:

“when the looting starts, the shooting starts”

Trump threatened protestors who attempted to enter the grounds of the White House with “vicious dogs” and “ominous weapons”. Twitter deemed the tweets so provocative that they applied a warning label to categorize them as glorifying violence.

The officer in question kneeled on the head of George Floyd for several minutes, while Floyd complained that he couldn’t breathe. The officer was arrested and charged with third-degree murder after four days of protests.

However, the protests and riots have continued as communities rail against the crippling racial injustices suffered at the hands of the police, amidst calls that the other officers seen restraining Floyd are also brought to justice.

Citigroup CFO Issues Statement

The response across celebrity and corporate America has been one of outrage at the video footage of Floyd’s arrest and at subsequent footage of police brutality against protestors. Mark Mason, the CFO of Citigroup released a statement saying:

“Racism continues to be at the root of so much pain and ugliness in our society — from the streets of Minneapolis to the disparities inflicted by Covid-19. As long as that’s true, America’s twin ideals of freedom and equality will remain out of reach.”

The rioting across America has come just as the country was starting to look beyond the first phase of the fight against COVID-19. Lockdown measures are easing around the country, and will likely dampen risk sentiment across the week as disruption continues.

SPX Rally Losing Steam?

The SPX500 is still recovering from the COVID-19 lows, within the bullish channel which has framed the rally. While momentum has slowed, price is holding above the 2956.4 level, for now, broken last week. While above here, focus is on a continued push higher to test the 3131.2 level next.

To the downside, any break of that level will put the focus on the 2794.9 level next.

By Orbex

Fibonacci Retracements Analysis 01.06.2020 (GOLD, USDCHF)

Article By RoboForex.com

XAUUSD, “Gold vs US Dollar”

As we can see in the H4 chart, the divergence made XAUUSD start a new decline to reach 23.6% fibo at 1690.70, which was later followed by another ascending impulse towards the high at 1764.86. If the pair breaks the high, it may continue growing to reach the post-correctional extension area between 138.2% and 161.8% fibo at 1798.90 and 1858.60 respectively. However, there is another scenario, according to which the instrument may rebound from the high start a new descending wave towards 38.2% and 50.0% fibo at 1645.40 and 1607.83 respectively.

GOLD_H4
Risk Warning: the result of previous trading operations do not guarantee the same results in the future

In the H1 chart, the convergence made the pair complete the descending wave at 23.6% fibo (1690.70) and start a new growth to break the high 1764.86.

GOLD_H1
Risk Warning: the result of previous trading operations do not guarantee the same results in the future

USDCHF, “US Dollar vs Swiss Franc”

As we can see in the H4 chart, after breaking the downside border of the Triangle pattern, USDCHF has failed to break the similar border of the Flat pattern. However, a breakout of this border is just a question of time. The current decline may be considered as a new correctional wave towards 61.8% fibo at 0.9453. The resistance remains in at 0.9743.

USDCHF_H4
Risk Warning: the result of previous trading operations do not guarantee the same results in the future

In the H1 chart, the descending wave is approaching 50.0% fibo at 0.9538. At the same time, one can see a convergence on MACD, which may indicate a rebound towards 0.9638. Earlier, this level acted as a support.

USDCHF_H1

Article By RoboForex.com

Attention!
Forecasts presented in this section only reflect the author’s private opinion and should not be considered as guidance for trading. RoboForex LP bears no responsibility for trading results based on trading recommendations described in these analytical reviews.

RoboMarkets: Massive Updates to R Trader Trading Platform

June 01, 2020

Limassol, Cyprus

RoboMarkets, the company that provides access to technologically advanced solutions for online trading, has announced updates to R Trader, its multi-asset trading platform, which were introduced to both mobile and desktop versions of the product. Within the frameworks of the updates, the mobile version users are offered several new features, while the desktop terminal now has the Corporate Events Calendar, a convenient graphical display of trading results and the history of account financial parameters, 4 new indicators, and contract specifications integrated directly in the platform.

In December 2019, RoboMarkets introduced a mobile version of its trading platform, R Trader. At that time, the terminal had only basic functions for performing trading operations. The current updates to R Trader Mobile include displaying positions on charts, the opportunity of modifying Watchlists and sorting in key tabs, and deposits/withdrawals information in the “History” section. Also, there is a feature that allows users to place an order by swiping the screen, thus helping to avoid pressing “buy” or “sell” buttons accidentally.

The R Trader desktop terminal now contains the Calendar of Corporate Events, such as “Dividends”, “Earnings”, and “Splits”. Also, clients have access to their trading history in the form of convenient charts that display the key account parameters: profit, Equity, “drawdown”, depositing, and balance. Using multifunctional charts, traders will be able to assess the status of their accounts, reduce risks, and modify trading methods to make them more effective and resulting. Particular attention should be paid to the integration of contract specifications for all instruments to help users save time that was earlier spent on searching the information about more than 12,000 instruments available in the terminal.

With due consideration to numerous demands of the Company’s clients, 4 popular indicators have been added to R Trader: VWAP, Force Index, Pivot Point, and Donchian Channel.

Kiryl Kirychenka, the head of the R Trader project, is commenting: “Our business principle lies in the systematic commitment to improving the products and solutions that we provide our clients with. This means that we invest in our services and risk management systems, as well as develop products that help traders make their work more effective. We’ve significantly improved and expanded opportunities of the R Trader mobile version. At the same time, the Company has implemented several solutions, which will allow to improve the platform’s trading functionality and increase the risk-control level. And that’s just a small part of what we’re planning to introduce in the nearest future”.

About RoboMarkets

RoboMarkets is an investment company with the CySEC license No. 191/13. RoboMarkets offers investment services in many European countries by providing traders, who work on financial markets, with access to its proprietary trading platforms. More detailed information about the Company’s products and services can be found at robomarkets.com.


Why the US dollar remains crucial for Hong Kong’s economic prosperity

By Damian Tobin, University College Cork 

– Increasing economic tensions between the US and China continue to threaten Hong Kong’s economy. China’s proposed national security law will see greater controls over areas such as secessionist activities, terrorism and foreign interference. Similarly, the announcement by the US secretary of state, Mike Pompeo, that Hong Kong should no longer be viewed as independent from China could undermine Hong Kong’s longstanding role as an intermediary between China and the rest of the world.

But one important pillar of Hong Kong’s economy remains unchanged and outside of Chinese government control – its currency, which is pegged to the US dollar via a currency board. This could have significant benefits for the city as it tries to deal with pressing socioeconomic challenges. But this also requires more public spending from the special administrative region’s government.

Since its introduction, the currency peg has withstood a variety of challenges – from the UK handover of Hong Kong back to China, to attacks from speculators. But it has often resulted in the Hong Kong government adopting an overly conservative approach to spending. Although the peg gives Hong Kong a considerable financial buffer, successive governments have tended towards fiscal conservatism. Public spending has rarely exceeded 20% of GDP since the 1997 handover.

Bad timing and poor management

Hong Kong is struggling to deal with sluggish economic growth and myriad socioeconomic challenges, not least increasing levels of poverty and a high level of inequality. The city was poised to benefit from legislation passed by the US senate which could force Chinese companies to delist from the US stock exchange. This would make Hong Kong the natural route for Chinese companies seeking to access overseas funds – something the city’s financial markets have long provided. But the new national security law and Pompeo’s comments will make Hong Kong less attractive.

Many of the challenges now facing Hong Kong have their roots in decades of mismanaged prosperity. Yet they do not necessarily threaten the US dollar peg.

Dan Freeman on Unsplash, CC BY

In theory, the dollar peg gives the US the ultimate sanction on Hong Kong. In practice, it is more complicated, not least because the global demand for dollar assets helps subsidise US living standards. Nevertheless, were the US to strictly apply export controls or remove special tariffs, it would make Hong Kong’s task of sustaining a net inflow of foreign exchange more difficult.

A pragmatic choice

Hong Kong’s currency board was introduced in 1983 following concerns over capital flight and the volatility of Hong Kong’s then free-floating currency as UK-China negotiations over Hong Kong’s handover progressed. The currency board requires Hong Kong to hold enough liquid assets in the form of US dollar reserves to cover the amount of Hong Kong dollars that are in circulation.

The Hong Kong Monetary Authority (HKMA), which acts as a de facto central bank, ensures the US dollar trades in a narrow band between HK$7.75-7.85. So the HKMA will buy up Hong Kong dollars to strengthen the currency when it falls to the lower margin of this band and it will sell them when it gets too strong.

Replacing the US dollar with the Chinese RMB is currently not feasible due to restrictions on the RMB’s deliverability as a currency. This makes the RMB unsuitable as a liquid reserve asset. Meanwhile, China’s state enterprises and the offshore market for RMB continue to benefit from Hong Kong’s deep and liquid financial markets as a source of offshore US dollar funding.

Hong Kong’s future prosperity

Hong Kong’s future prosperity depends on good relationships between China and the US. But this is hindered by a historical reluctance by business interests and senior officials in the city to contemplate even moderate political reform. Such reforms are now unavoidable, however.

A deterioration in Hong Kong’s business sentiment can be traced to early 2019 and public concerns over democracy. Addressing public concerns should also benefit Beijing. China’s economic growth has seen its business interests in the city increase but also become more fragmented. This has made it more difficult to read the public mood. As issuer of the global reserve currency, the US also has a responsibility to ensure that liquidity shortage is not used as a political stick to punish Hong Kong.

Ultimately, neither the security law nor changes in the US stance towards Hong Kong will help the squeeze on living standards faced by many of Hong Kong’s residents. Conversely, maintaining the currency peg gives the Hong Kong government ample fiscal scope to deal with these.

Its own economic research indicates the economic impacts of external events on Hong Kong’s economic growth tend to be large but not long lasting. Data from Hong Kong’s government show that the 1997-98 Asian financial crisis saw Hong Kong’s economy contract by 8.3% in the third quarter of 1998 while the global financial crisis resulted in a 7.8% contraction in the first quarter of 2009. In both instances, Hong Kong’s economy returned to growth following four to five quarters of contraction.

Recent indications that the US is set to run budget deficits so great they will exceed wartime records could provide Hong Kong’s fiscally conservative government with the political justification for increasing much needed public spending.The Conversation

About the Author:

Damian Tobin, Lecturer in Management, Cork University Business School, University College Cork

This article is republished from The Conversation under a Creative Commons license. Read the original article.


The Week Ahead: Unity Makes Strength

By Orbex

EURCHF Surges Higher on Stimulus Hopes

The euro climbed to an 11-week high against the Swiss franc after the European Commission proposed a 750 billion euro recovery plan. Optimism grows as the EU’s 27 nations are expected to settle their differences and seal the deal in the coming weeks. Should everything go smoothly from now on, confidence in the single currency could be restored.

With Swiss franc long positions near a four-year high according to CFTC data, EURCHF’s short-covering could trigger a rapid ascent. 1.7100 from last March is the immediate resistance.

On the downside, 1.0580 around the 30-day moving average is a key support to the rebound.

USDCAD Heads Lower Ahead of BoC Meeting

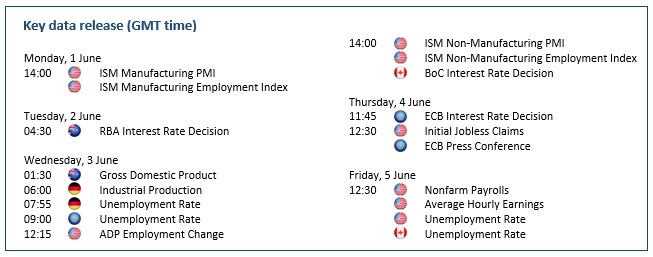
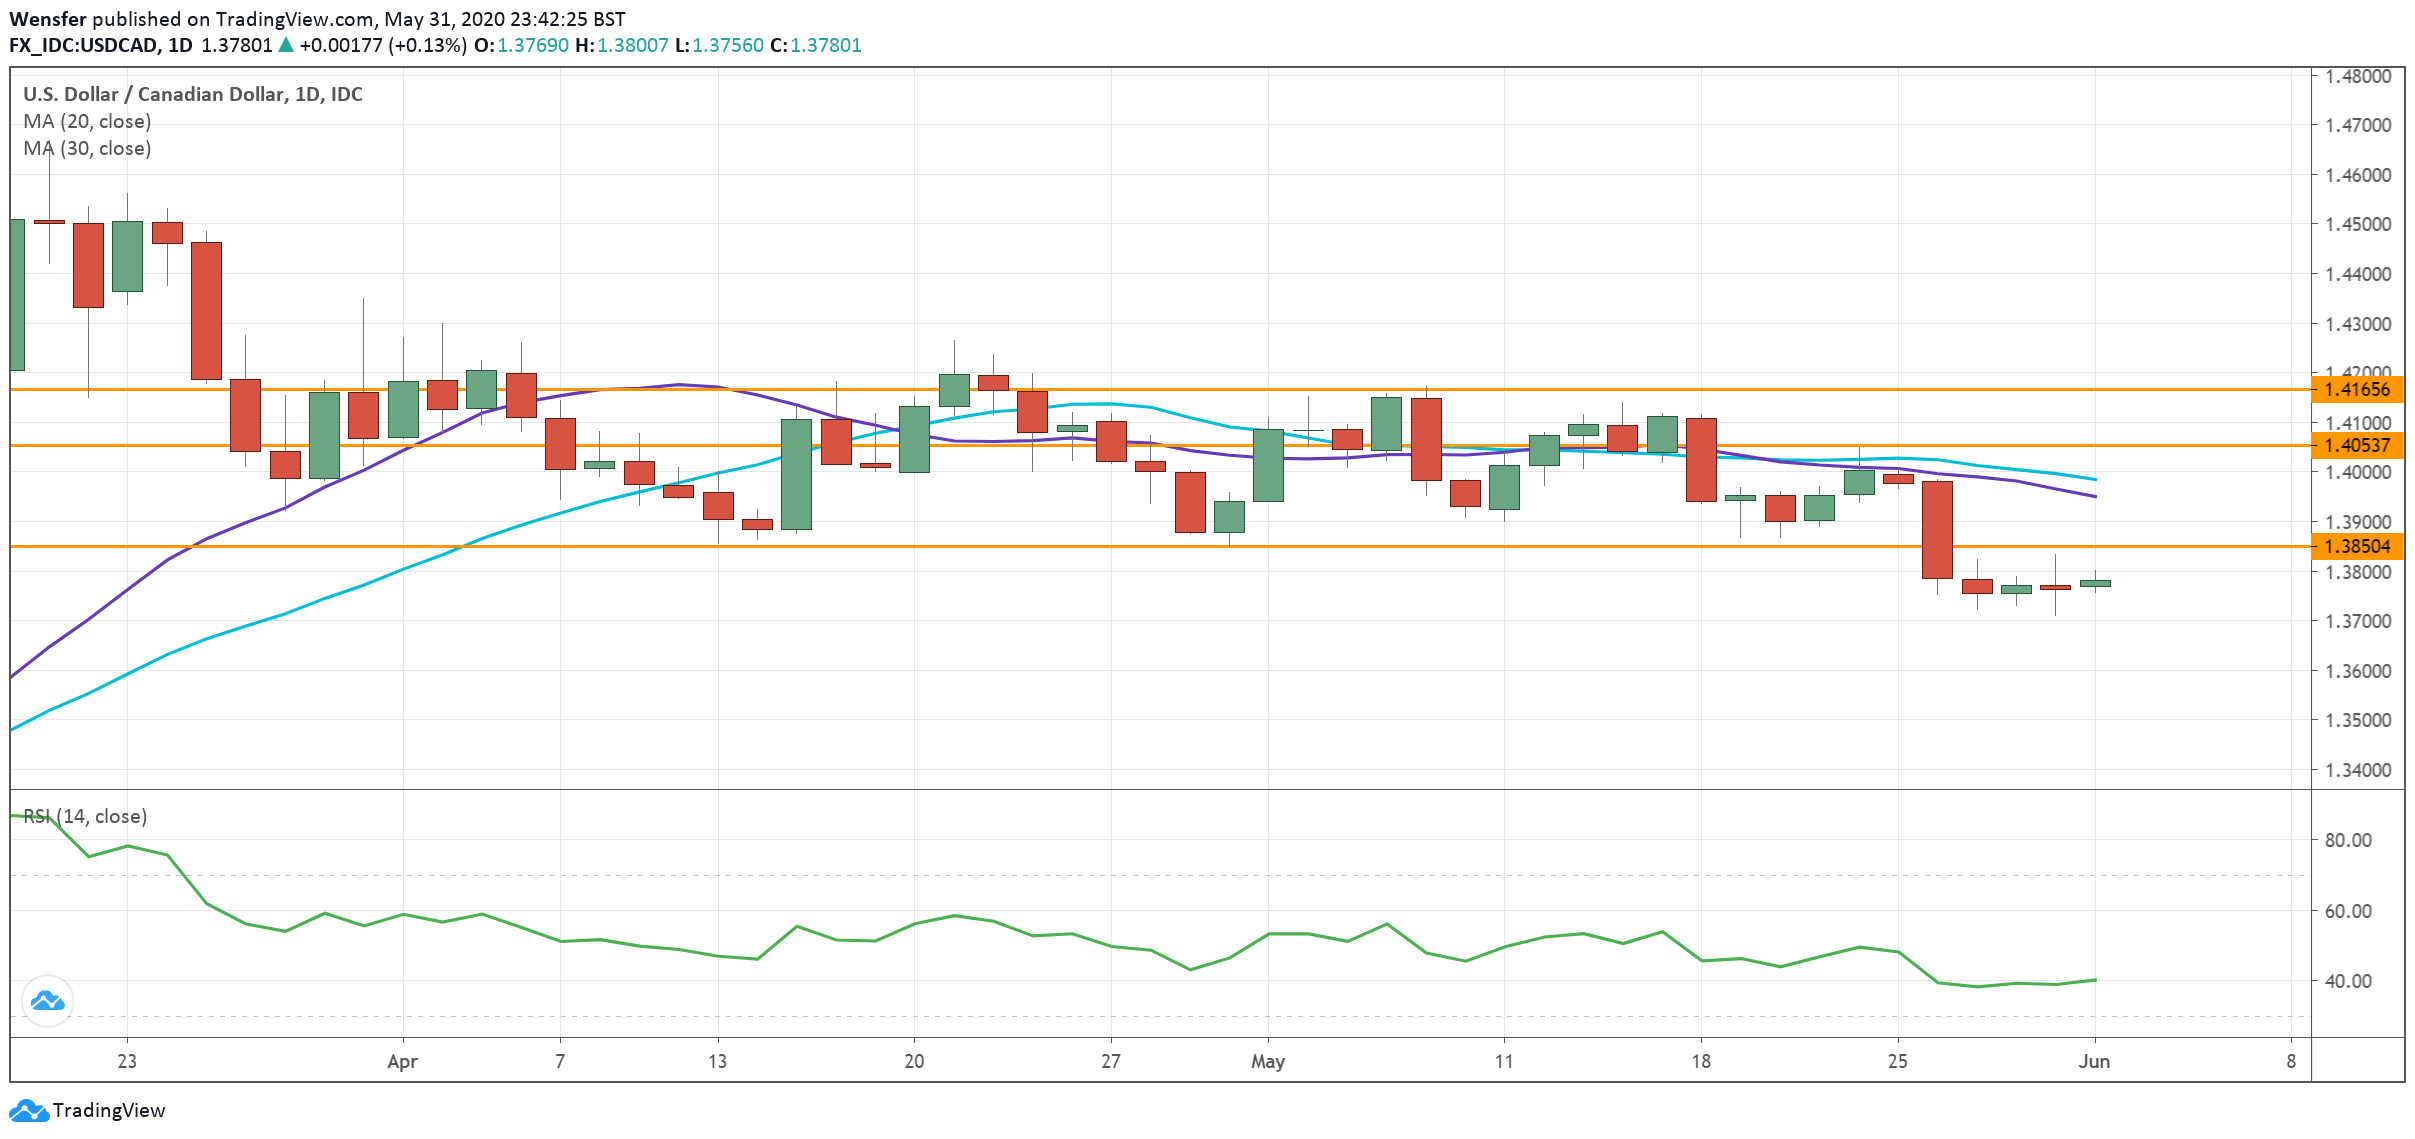
The US dollar has broken below its near two-month consolidation range as its Canadian counterpart rallied across the board. The V-shaped recovery in the oil markets which has reached a 5-week high has offered strong support to the loonie.

The Bank of Canada is expected to keep its policy interest rate at 0.25% this week. However, Governor Stephen Poloz has not excluded more stimulus to support the recovery.

The risk of dovish guidance could weigh on the loonie’s advance. The pair is under pressure after a breakout below the 1.3850 floor. As the rate starts to drift lower, 1.4050 is the immediate resistance.

USDJPY Pulls Back on Disappointing Data

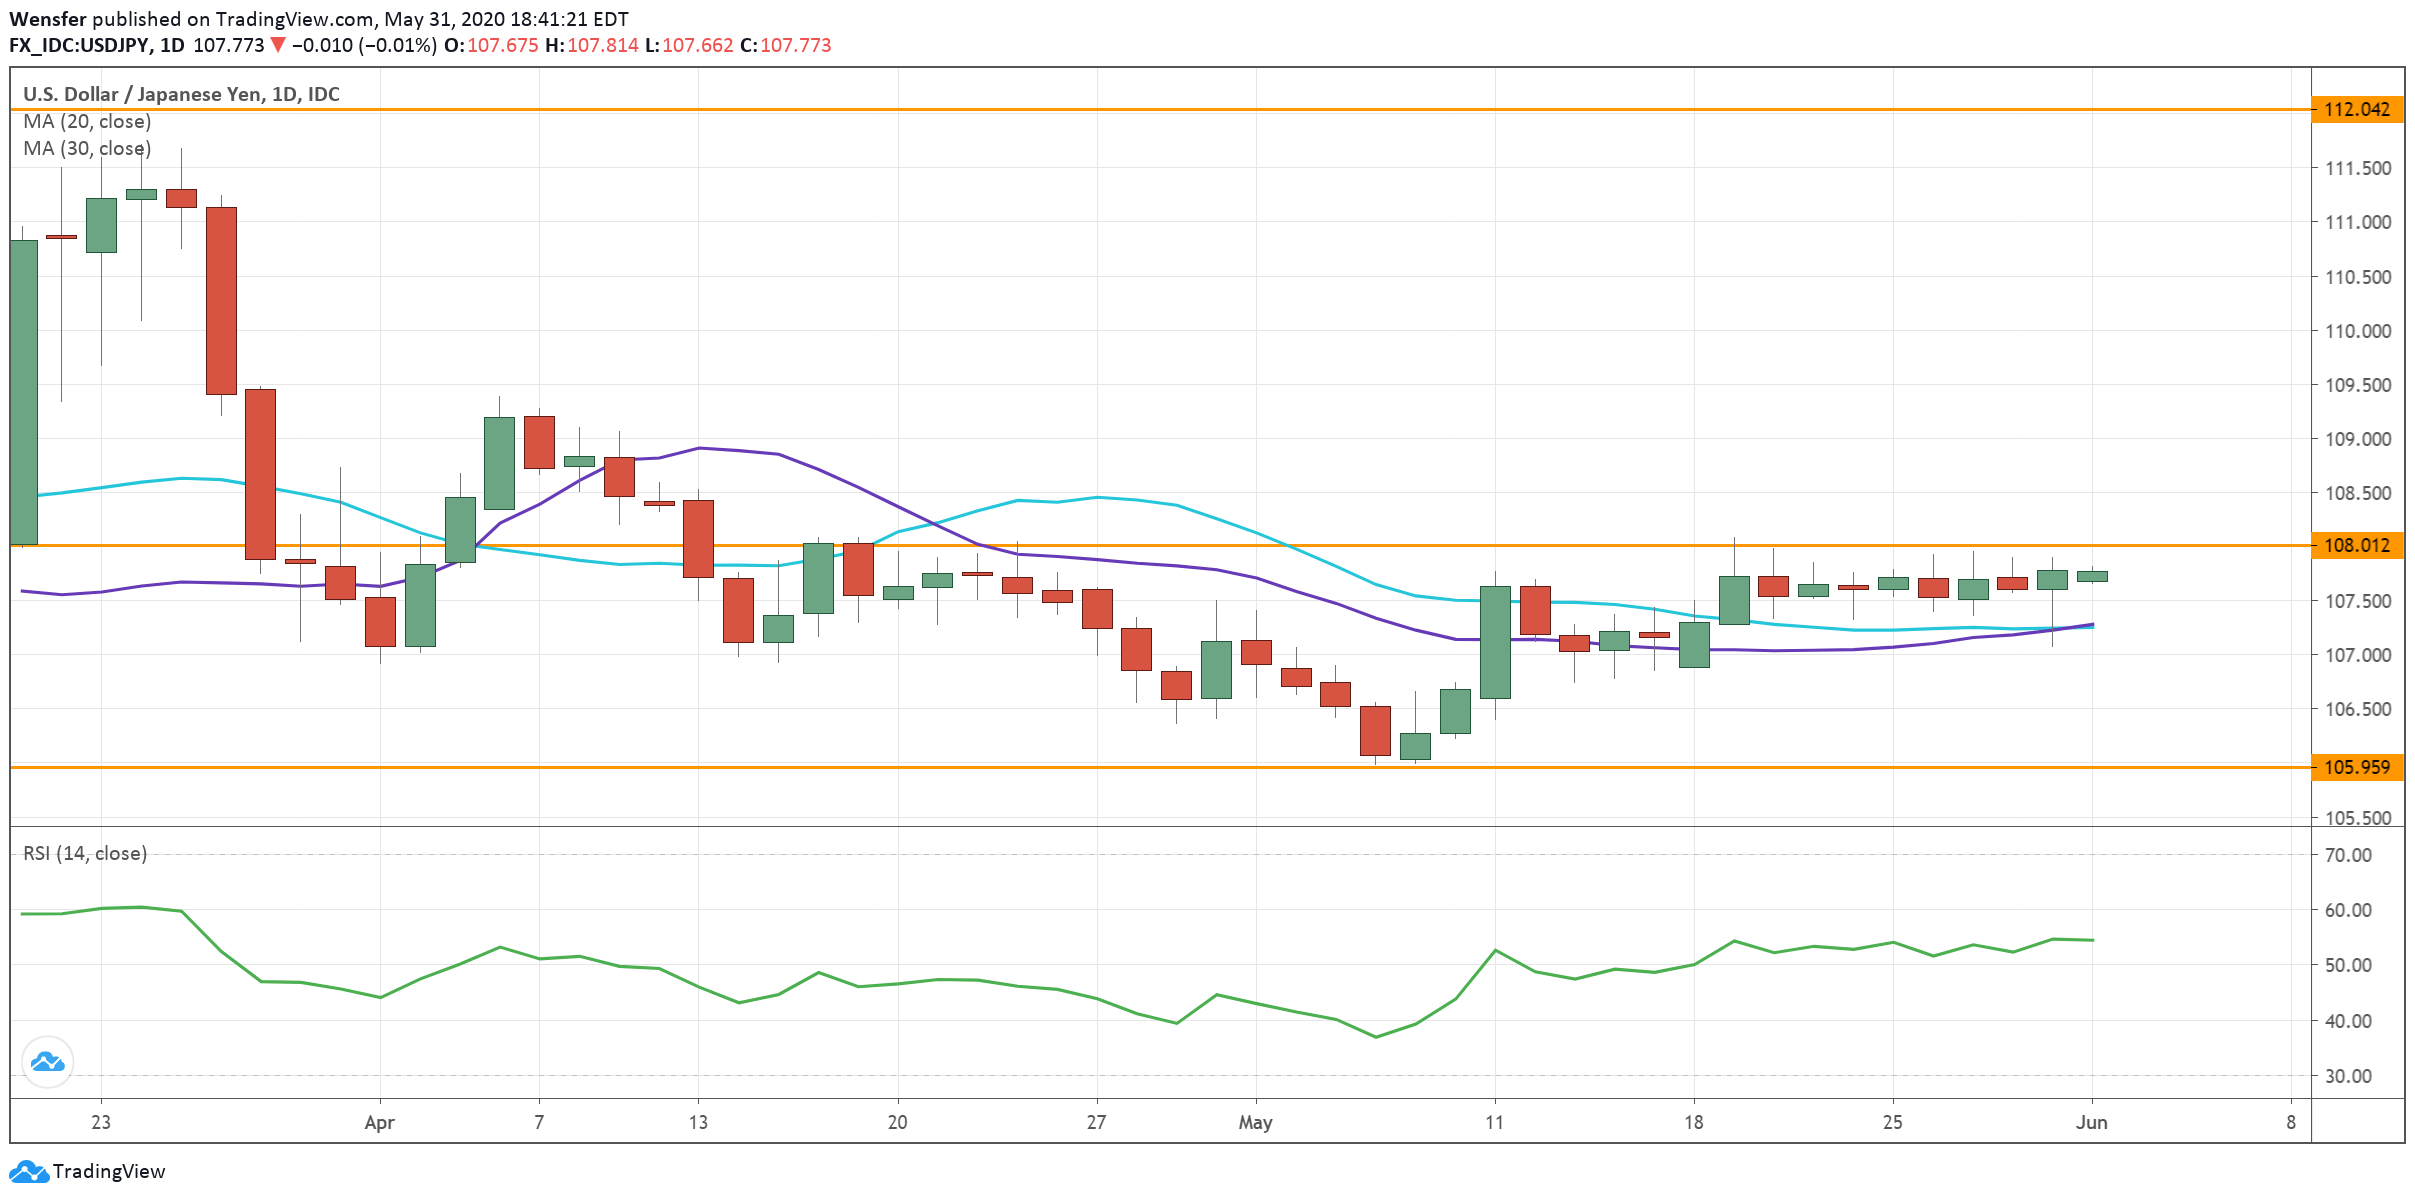
Worsening US economic data have capped the greenback’s advance. The first quarter GDP sank 5% against a consensus of 4.8%.

Should this week’s manufacturing and jobs data paint a similarly grim picture, markets could shun the dollar unless the Fed comes up with even stronger commitment.

In the meantime, the US is pondering sanctions against China over a new Hong Kong legislation law, and the safe-haven Japanese yen may see more bids as Sino-US relations hit new lows.

USDJPY has failed to rally above the psychological level of 108.00. May’s low of 106.00 is a major support to keep the dollar afloat.

AUDJPY Rises on RBA’s Optimism

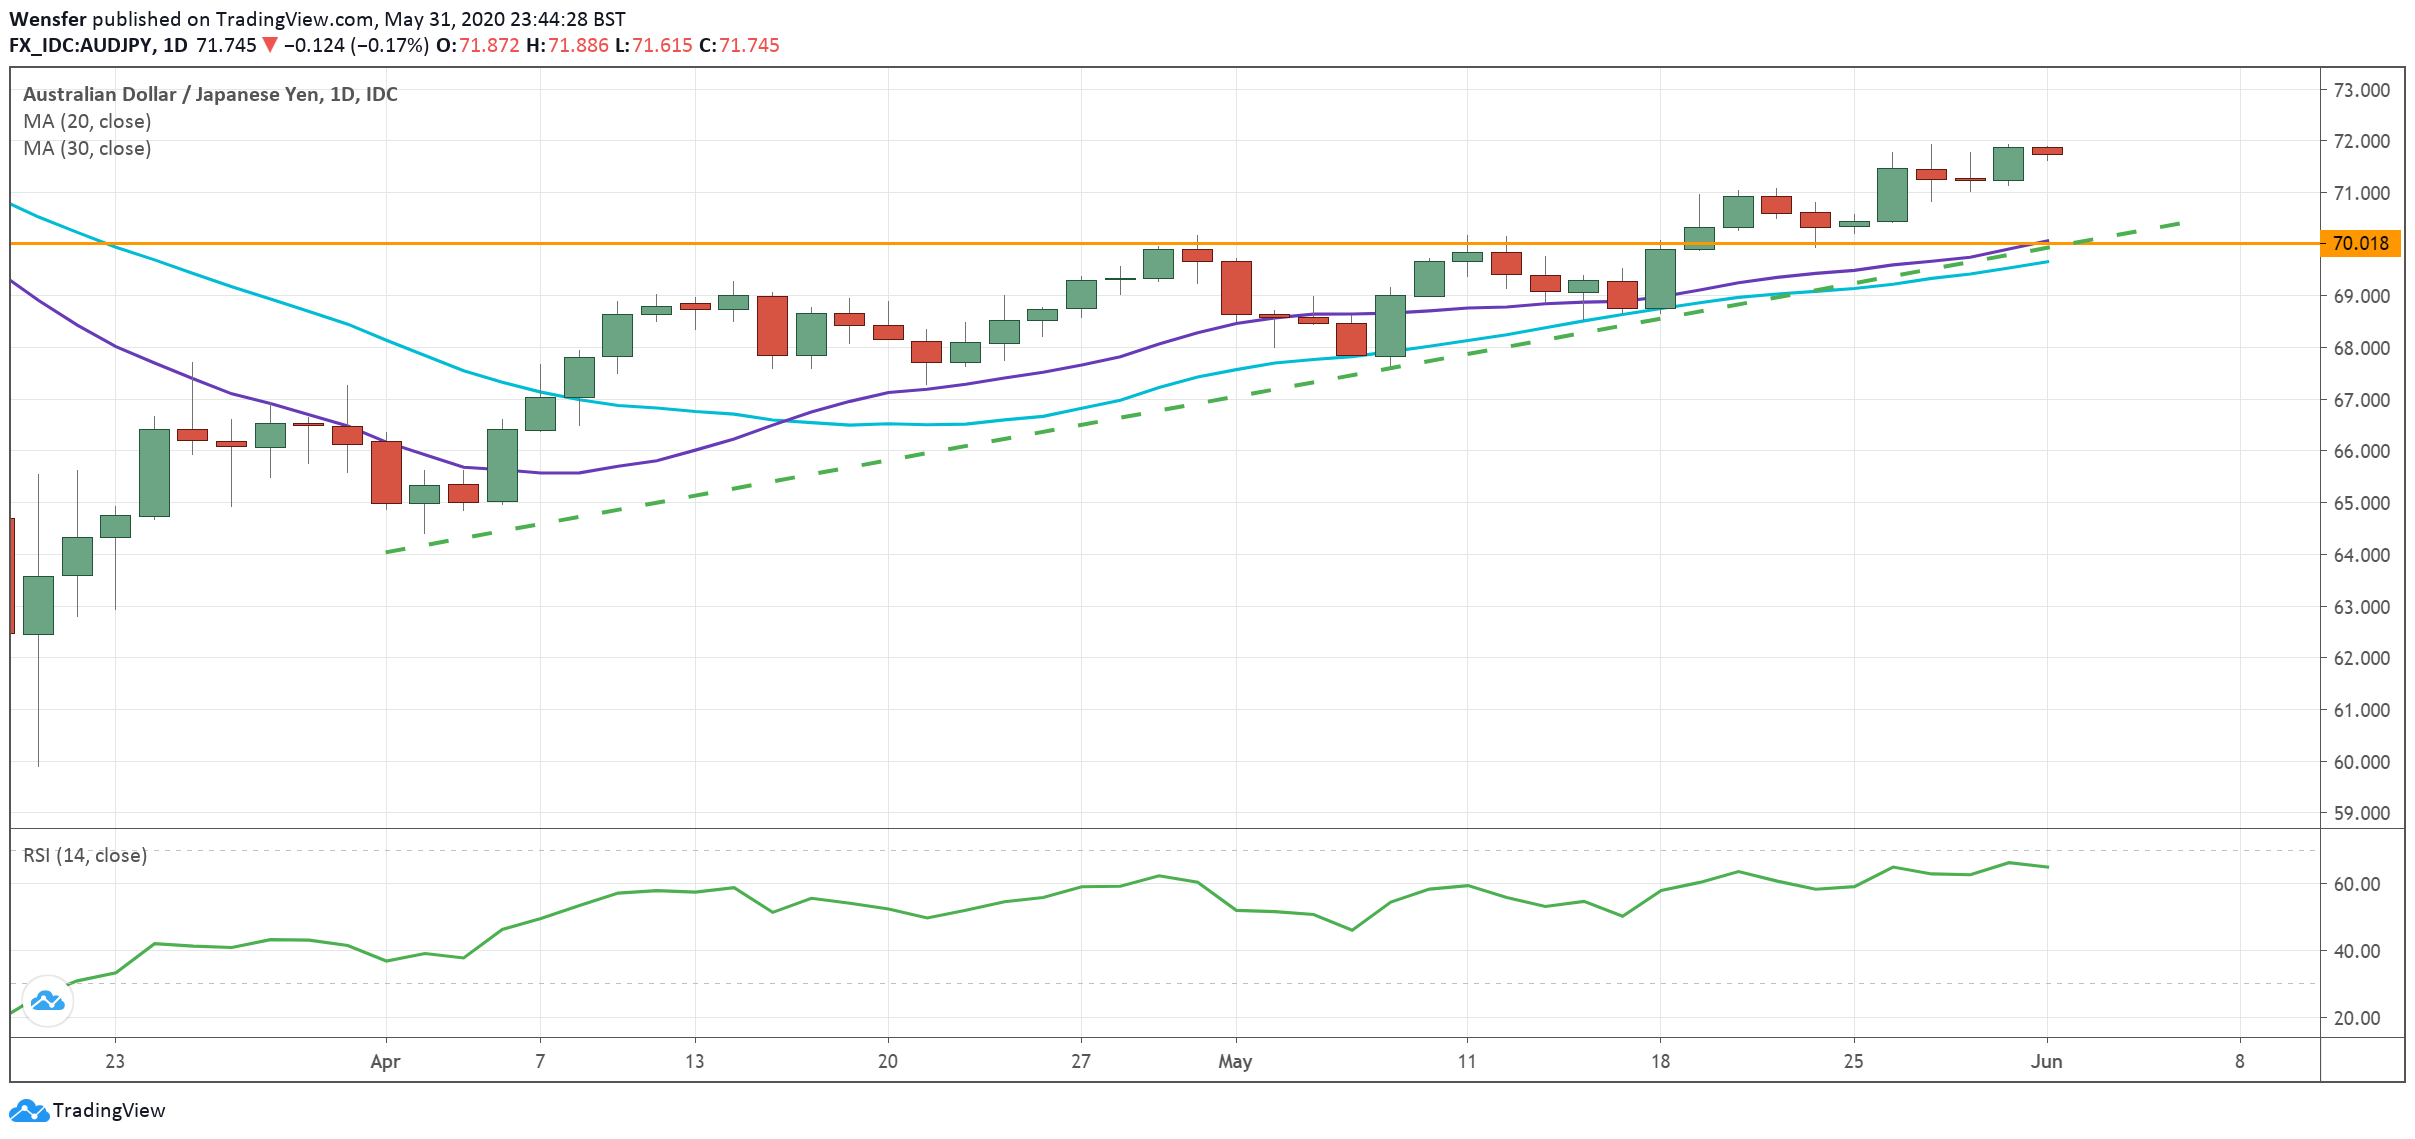
The Australian dollar continues on its way up as the country starts to resume its normal life. Despite a grim economic forecast of a 6% contraction and a 9% unemployment rate, the RBA has suggested the recession to be less severe than previously thought.

The central bank is likely to stay confident at its next meeting and maintain its current course of action without additional QE measures. This would further support the Aussie in the medium term.

Sentiment remains bullish after the pair rallied above the March high of 71.40. 70.00 near the moving averages is the first line of defense in case of a pullback.

By Orbex


Currency Majors Have Become Stable. Investors Expect Key Central Bank Meetings and US Labor Market Report

by JustForex

Last week, the US dollar weakened significantly compared to its main competitors. The dollar index (#DX) has set new local lows and closed in the red zone. The conflict between Washington and Beijing is still in the spotlight. US President Donald Trump promised to call off Hong Kong’s special status if the new Chinese law did not come into force. However, China is confident that this will do more harm to the United States than to China.

Currency majors are currently consolidating. Financial market participants expect meetings of the Reserve Bank of Australia, the Bank of Canada, the ECB, as well as the US labor market report for May. Investors also expect another round of negotiations on Brexit, which will begin tomorrow in advance of the EU summit on June 18-19. There is not much time left until December 31 – Brexit’s deadline. Progress in the negotiations has not yet been observed. The EU has called on the UK to be more realistic as to what the country can achieve in the negotiations.

The “black gold” prices have become stable after a significant rally. Currently, futures for the WTI crude oil are testing the $35.15 mark per barrel.

Market indicators

On Friday, there was a variety of trends in the US stock market: #SPY (+0.45%), #DIA (-0.02%), #QQQ (+1.47%).

The 10-year US government bonds yield has declined. At the moment, the indicator is at the level of 0.65-0.66%.

The news feed on 2020.06.01:
  • – German manufacturing PMI at 10:55 (GMT+3:00);
  • – UK manufacturing PMI at 11:30 (GMT+3:00);
  • – ISM manufacturing PMI at 17:00 (GMT+3:00).

by JustForex

The Analytical Overview of the Main Currency Pairs on 2020.06.01

by JustForex

The EUR/USD currency pair

Technical indicators of the currency pair:
  • Prev Open: 1.10711
  • Open: 1.11148
  • % chg. over the last day: +0.16
  • Day’s range: 1.11024 – 1.11540
  • 52 wk range: 1.0777 – 1.1494

The bullish sentiment prevails on the EUR/USD currency pair. The trading instrument has set new local highs. The European Commission has proposed to create a 750 billion euro recovery fund. The ECB meeting and the US labor market report for May will be key events on the current trading week. At the moment, EUR/USD quotes are testing the resistance of 1.1150. The 1.1090 mark is the nearest support. The single currency has the potential for further growth. We recommend following up-to-date information regarding the conflict between Washington and Beijing. Positions should be opened from key levels.

News Feed on the US Economy for 2020.06.01:
  • – German manufacturing PMI at 10:55 (GMT+3:00);
  • – ISM manufacturing PMI at 17:00 (GMT+3:00).
EUR/USD

Indicators signal the power of buyers: the price has fixed above 50 MA and 100 MA.

The MACD histogram is in the positive zone, indicating the bullish sentiment.

Stochastic Oscillator has started exiting the overbought zone, the %K line is below the %D line, which indicates a possible correction of EUR/USD quotes.

Trading recommendations
  • Support levels: 1.1090, 1.1065, 1.1035
  • Resistance levels: 1.1150, 1.1180, 1.1200

If the price fixes above 1.1150, further growth of EUR/USD quotes is expected. The movement is tending to the round level of 1.1200.

An alternative could be a decrease in the EUR/USD currency pair to 1.1060-1.1040.

The GBP/USD currency pair

Technical indicators of the currency pair:
  • Prev Open: 1.23104
  • Open: 1.23235
  • % chg. over the last day: +0.21
  • Day’s range: 1.23235 – 1.24257
  • 52 wk range: 1.1466 – 1.3516

Purchases prevail on the GBP/USD currency pair. The British pound has set new local highs. GBP/USD quotes have found resistance at 1.2425. The 1.2360 mark is already a “mirror” support. The current trading week will be full of important economic reports. Investors continue to monitor the development of the US-China conflict. We recommend opening positions from key levels.

At 11:30 (GMT+3:00), UK manufacturing PMI will be published.

GBP/USD

Indicators signal the power of buyers: the price has fixed above 50 MA and 100 MA.

The MACD histogram is in the positive zone and above the signal line, which gives a strong signal to buy GBP/USD.

Stochastic Oscillator is in the neutral zone, the %K line has crossed the %D line. There are no signals at the moment.

Trading recommendations
  • Support levels: 1.2360, 1.2290, 1.2235
  • Resistance levels: 1.2425, 1.2470, 1.2500

If the price fixes above 1.2425, further growth of GBP/USD quotes is expected. The movement is tending to 1.2470-1.2500.

An alternative could be a decrease in the GBP/USD currency pair to 1.2330-1.2300.

The USD/CAD currency pair

Technical indicators of the currency pair:
  • Prev Open: 1.37636
  • Open: 1.37748
  • % chg. over the last day: +0.13
  • Day’s range: 1.36732 – 1.38003
  • 52 wk range: 1.2949 – 1.4668

The USD/CAD currency pair has been declining after a prolonged consolidation. The trading instrument has overcome and fixed below the key extremes. The loonie is currently testing the following support and resistance levels: 1.3675 and 1.3735, respectively. USD/CAD quotes have the potential for further decline. Today we recommend paying attention to economic releases from the US, as well as the dynamics of “black gold” prices. Positions should be opened from key levels.

The news feed on Canada’s economy is calm.

USD/CAD

Indicators signal the power of sellers: the price has fixed below 50 MA and 100 MA.

The MACD histogram is in the negative zone, indicating the bearish sentiment.

Stochastic Oscillator is in the neutral zone, the %K line has crossed the %D line. There are no signals at the moment.

Trading recommendations
  • Support levels: 1.3675, 1.3630, 1.3600
  • Resistance levels: 1.3735, 1.3790, 1.3825

If the price fixes below 1.3675, a further drop in the USD/CAD quotes is expected. The movement is tending to 1.3640-1.3620.

An alternative could be the growth of the USD/CAD currency pair to 1.3780-1.3800.

The USD/JPY currency pair

Technical indicators of the currency pair:
  • Prev Open: 107.640
  • Open: 107.679
  • % chg. over the last day: +0.01
  • Day’s range: 107.375 – 107.856
  • 52 wk range: 101.19 – 112.41

The last sessions trades on the USD/JPY currency pair have been very active. At the same time, there is no defined trend. The technical pattern is still ambiguous. Financial market participants expect additional drivers. At the moment, the key range is 107.35-107.60. Investors are focused on a trade conflict between Washington and Beijing. Positions should be opened from key levels.

The news feed on Japan’s economy is calm.

USD/JPY

Indicators signal the power of sellers: the price has fixed below 50 MA and 100 MA.

The MACD histogram is near the 0 mark. There are no signals at the moment.

Stochastic Oscillator is in the neutral zone, the %K line is above the %D line, which gives a signal to buy USD/JPY.

Trading recommendations
  • Support levels: 107.35, 107.10, 106.80
  • Resistance levels: 107.60, 107.75, 107.90.

If the price fixes below 107.35, a further drop in the USD/JPY quotes is expected. The movement is tending to 107.10-106.90.

An alternative could be the growth of the USD/JPY currency pair to 107.75-107.90.

by JustForex

USD Ends May on a Weaker Note

By Orbex

EURUSD Retreats From 1.1130 Level

The euro rose to 1.1144, marking a fresh two-month high on Friday before retreating.

The pullback coincides with the resistance level near the 1.1130 level. At the moment, price action is supported from the median line.

But a breakdown below this will signal a correction. We expect the downside in EURUSD to send the currency pair back to the 1.1000 level.

Establishing support back at this level will potentially bolster the case for further gains.

Alternatively, a breakout above 1.1130 could trigger stronger gains.

GBPUSD Maintains A Steady Hold On The Upside

The GBPUSD currency pair is near a two-week high.

After clearing the price level near 1.2277, price action is having an upside bias.

The next target is at 1.2424, marking a strong resistance level from earlier attempts.

As a result, GBPUSD might settle into a sideways range. A close above 1.2424 will, of course, mark a full recovery from the slump which began in early May this year.

The declines to the downside are limited for now, as long as 1.2277 holds up.

WTI Crude Oil Pushes Above 33.66

WTI Crude oil prices rose over 4% on Friday and closed above the 33.66 level.

However, price action remains a bit doubtful at the moment.

This is, of course, unless we see a strong rally above this handle.

The next main target level is near the 40s for crude oil. Price action in the commodity remains somewhat mixed which opens the risks of a correction lower.

The Stochastics oscillator is also somewhat bearish that suggests the possibility of a pullback.

XAUUSD Makes Gains, But Upside Remains Weak

Gold prices rose over 0.8% on Friday but prices stalled near previous highs of 1733.0.

While this is a minor resistance level, the gains could push price action closer to the next main resistance level of 1747.00.

Only a convincing breakout above this level will trigger further rallies in the precious metal.

To the downside, there is scope of a pullback as the 1717 handle remains within sight.

A breakdown off this level might trigger a move lower to the 1696 level that was only briefly tested.

By Orbex


Dow Jones bouncing against the EMA(200) – a push back below 25,000 ahead?

By Admiral Markets

Source: Economic Events June 1, 2020 – Admiral Markets’ Forex Calendar

While European Equity markets will likely see a very slow start into the trading week, the picture in US Equities is getting more and more very interesting.

The Dow Jones has seen a remarkable run from its March lows, gaining more than 35% since then. That corrective move resulted in US stocks now trading at over 143% market cap to US GDP and a forward Price-Earnings ratio of higher than 24.

The latter fact, in particular, seems a little too optimistic given the expected economic downturn in the months to come after the Corona lockdown.

In addition to that, last Friday’s press conference from US president Donald Trump let fears of new tensions between the US and China grow once again, after the U.S. has taken a more serious turn in response to a Chinese security law that threatens the long-standing independence of Hong Kong.

With the Dow Jones failing to recapture the EMA(200) (blue) on a daily time-frame last week, the line-up for a sharper corrective move and short-term pullback below 25,000 points seems given and short-term Short engagements seem, in our opinion, attractive from a risk-reward perspective:

Source: Admiral Markets MT5 with MT5-SE Add-on DAX30 CFD Daily chart (between March 18, 2019, to May 29, 2020). Accessed: May 29, 2020, at 10:00pm GMT – Please note: Past performance is not a reliable indicator of future results, or future performance.

In 2015, the value of the DJI30 CFD decreased by 2.2%, in 2016, it increased by 13.5%, in 2017, it increased by 24.4%, in 2018, it decreased by 5.9%, in 2019, it was up by 23.8%, meaning that after five years, it was up by 60.1%.

Discover the world’s #1 multi-asset platform

Admiral Markets offers professional traders the ability to trade with a custom, upgraded version of MetaTrader 5, allowing you to experience trading at a significantly higher, more rewarding level. Experience benefits such as the addition of the Market Heat Map, so you can compare various currency pairs to see which ones might be lucrative investments, access real-time trading data, and so much more. Click the banner below to start your FREE download of MT5 Supreme Edition!

Download MetaTrader 5 and begin trading today!

Disclaimer: The given data provides additional information regarding all analysis, estimates, prognosis, forecasts or other similar assessments or information (hereinafter “Analysis”) published on the website of Admiral Markets. Before making any investment decisions please pay close attention to the following:

  1. This is a marketing communication. The analysis is published for informative purposes only and are in no way to be construed as investment advice or recommendation. It has not been prepared in accordance with legal requirements designed to promote the independence of investment research, and that it is not subject to any prohibition on dealing ahead of the dissemination of investment research.
  2. Any investment decision is made by each client alone whereas Admiral Markets shall not be responsible for any loss or damage arising from any such decision, whether or not based on the Analysis.
  3. Each of the Analysis is prepared by an independent analyst (Jens Klatt, Professional Trader and Analyst, hereinafter “Author”) based on the Author’s personal estimations.
  4. To ensure that the interests of the clients would be protected and objectivity of the Analysis would not be damaged Admiral Markets has established relevant internal procedures for prevention and management of conflicts of interest.
  5. Whilst every reasonable effort is taken to ensure that all sources of the Analysis are reliable and that all information is presented, as much as possible, in an understandable, timely, precise and complete manner, Admiral Markets does not guarantee the accuracy or completeness of any information contained within the Analysis. The presented figures refer that refer to any past performance is not a reliable indicator of future results.
  6. The contents of the Analysis should not be construed as an express or implied promise, guarantee or implication by Admiral Markets that the client shall profit from the strategies therein or that losses in connection therewith may or shall be limited.
  7. Any kind of previous or modeled performance of financial instruments indicated within the Publication should not be construed as an express or implied promise, guarantee or implication by Admiral Markets for any future performance. The value of the financial instrument may both increase and decrease and the preservation of the asset value is not guaranteed.
  8. The projections included in the Analysis may be subject to additional fees, taxes or other charges, depending on the subject of the Publication. The price list applicable to the services provided by Admiral Markets is publicly available from the website of Admiral Markets.

Leveraged products (including contracts for difference) are speculative in nature and may result in losses or profit. Before you start trading, you should make sure that you understand all the risks

By Admiral Markets