Financial Sector Under Pressure and What It Means

By TheTechnicalTraders

The Financial sector is unique in that it is an essential component of global economics as well as local economic functions.  Consumers depend on banking services, credit, and all sorts of other financial services in their day-to-day lives.  The Financial sector is one of the components of the US stock market that can suddenly find itself under pricing pressure as an economic crisis event unfolds.  This happens because banks earn a large portion of their income from servicing debt and originating loans.

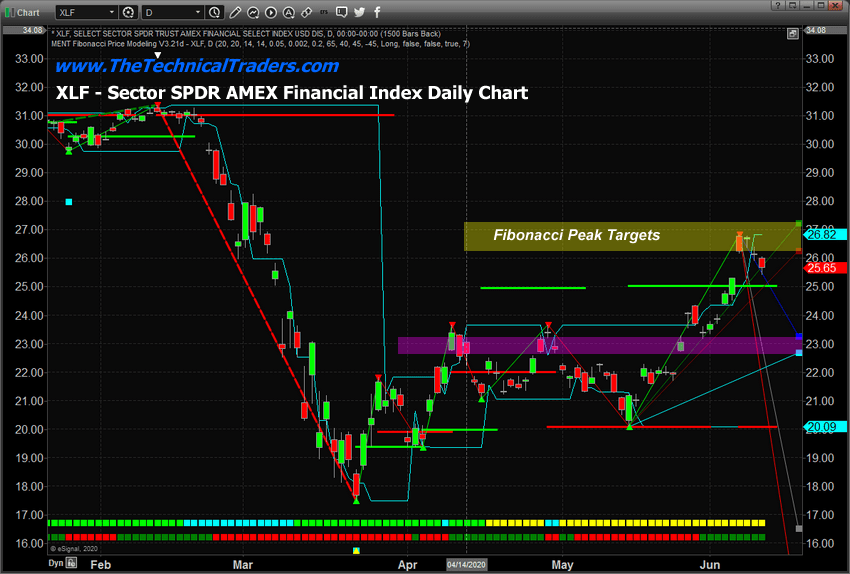
The recent rally in the Financial sector, over 47% from the March 2020 lows, has reached our proprietary Fibonacci price modeling system’s upside price targets and has also filled a major gap that was created in early March 2020.  Because of these factors, and the current downside price rotation within the Financial Sector, we believe this component of the US stock market could continue to see extended pricing pressure going forward as we learn just how damaging the past 70+ days of the economic shutdown have been for the economy.

We do know that certain consumers have quickly begun to pay off credit card debt.  We believe this is a learned trait from the 2008-09 market crisis where credit card rates skyrocketed as large numbers of consumers began defaulting on their homes and other types of credit.  We also know that delinquencies for autos and other sub-prime credit services have begun to skyrocket higher.  The sub-prime credit market is vastly different than it was in 2008-09.  Recently, Fintech and other new resources have allowed for extended sub-prime lending and leveraging within the US (Source: cnbc.com).

When you combine the sub-prime mortgage, auto, personal loans, personal Fintech margin capabilities, and sub-AAA corporate debt levels, the total amount of at-risk subprime debt must exceed $2 trillion US Dollars.  We believe this source of risk has been greatly underestimated in terms of risk to the Financial Sector over the next 12+ months (Source: zerohedge.com).

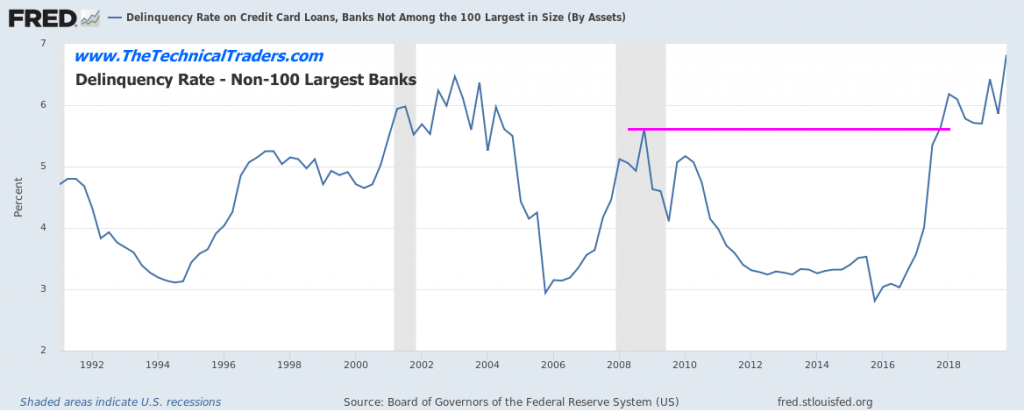
Non-100 Largest Banks Credit Card Delinquency Rates

The current delinquency rate among the non-100 largest US banks for credit cards has already climbed well above the 2008-2010 peak levels.  It appears subprime borrowers are already pushed well beyond their limits in terms of servicing current debt levels.  This suggests a contraction in the credit market will likely take place over the next 24+ months as these at-risk borrowers default at greater rates.  This could transition into the housing market and other sectors of the economy if multiple waves of sub-prime borrowers stress the US financial system because of the COVID-19 shutdown.

XLF FINANCIAL ETF INDEX DAILY CHART

Our research team believes the peak in the XLF ETF has already set up after the recent 47%+ rally from the March lows.  The $27 price peak sets up directly between our two Fibonacci Daily upside price target (Peak) levels.  We believe this setup is a very strong indication that a move to below $23 may be setting up over the next 30+ days.  The Q2 data may very well push investors to re-evaluate the potential for the Financial sector if delinquencies and at-risk borrowers continue to default in greater numbers.

XLF FINANCIAL ETF INDEX WEEKLY CHART

This XLF Weekly chart highlights the recent rally and the “Gap” that recently filled.  It is our belief that the range between the MAGENTA horizontal lines represents a very clear support/resistance level within this longer-term XLF chart.  We believe that price will have to fall below $25 in order to initiate a deeper downside price move targeting recent low price levels or price will have to move above $27.50 in order to continue to rally.  Currently, our researchers believe the downside potential has a much higher probability of success as we get closer to the end of Q2:2020.

If our research is correct and XLF falls below the $25 price level, we believe it will target at least $22 to $22.50 before finding some support.  If it breaks below the $22 price level, it could fall well below the $20 price level again on weaker expectations.

These types of price swings can be incredible setups for skilled technical traders.  Follow our research and learn how we can help you find and execute better trades.  We recently executed a new swing trade for our members that is already showing great opportunity.  Protect your capital and learn to trade proven technical setups with our dedicated team of researchers and traders.

As a technical analyst and trader since 1997, I have been through a few bull/bear market cycles in stocks and commodities. I believe I have a good pulse on the market and timing key turning points for investing and short-term swing traders. 2020 is an incredible year for traders and investors.  Don’t miss all the incredible trends and trade setups.

Subscribers of my Active ETF Swing Trading Newsletter had our trading accounts close at a new high watermark. We not only exited the equities market as it started to roll over in February, but we profited from the sell-off in a very controlled way with TLT bonds for a 20% gain, and we closed out another winning trade on Friday.

Chris Vermeulen
Chief Market Strategies
Founder of Technical Traders Ltd.
TheTechnicalTraders.com

US Fed holds rate, economy seen shrinking 6.5% in ’20

By CentralBankNews.info

The Federal Reserve left its policy rate steady at essentially zero as it forecast an economic contraction this year while it repeated its guidance from April that it “expects to maintain this target range until it is confident that the economy has weathered recent events and is on track to achieve its maximum employment and price stability goal.”
The central bank for the United States kept its target range for the federal funds rate at 0.0 to 0.25 percent, unchanged since two rapid-fire rate cuts totaling 150 basis points in early March.
As in April, the Fed said the coronavirus will weigh heavily on economic activity, employment and inflation in the near term and “poses considerable risks to the economic outlook over the medium term.”
In the first update to its economic projection since December last year, before the Covid-19 pandemic led to a shutdown of the global economy, the Fed slashed its growth forecast for this year to a contraction of 6.5 percent, down from an earlier forecast for growth of 2.0 percent.
Next year the U.S. economy is seen bouncing back, with growth of 5.0 percent and then 3.5 percent in 2022.
Reflecting the hit to economic growth and lower inflation, the Fed projected the fed funds rate would remain at its current level of 0.1 percent through 2022 as inflation remains below its target in the same period while unemployment only slowly declines.
The normal update to economic projections in March was skipped amid the growing uncertainty surrounding the impact of the coronavirus on the economy.
The sudden halt to global economic activity to curb the spread of the virus not only triggered the rate cuts in March, but also a pledge by the Fed of unlimited amount of government bonds purchases, the launch of a flurry of new funding facilities and the injection of trillions of dollars into financial markets to ensure they operated smoothly.
“To support the flow of credit to households and businesses, over coming months the Federal Reserve will increase its holdings of Treasury securities and agency residential and commercial mortgage-backed securities at least at the current pace to sustain smooth market functioning, thereby fostering effective transmission of monetary policy to broader financial conditions,” the Fed’s policy-making body, the Federal Open Market Committee (FOMC) said in a unanimous statement.
Among the lending facilities the Fed launched in March were the Commercial Paper Funding Facility (CPFF), the Primary Market Corporate Credit Facility (PMCCF), the Secondary Market Corporate Credit Facility (SMCCF),  the Term Asset-Backed Securities Loan Facility (TALF) and the Money Market Mutual Fund Liquidity Facility (MMLF).
Internationally, the Fed was also busy ensuring the availability of U.S. dollars, establishing temporary U.S. dollar swap lines with a series of central banks abroad, such as the central bank of Brazil and Norway on top of its existing swap lines with the major central banks of the world, including Canada, the UK, the ECB, Switzerland and Japan.
In April the Fed added to its loan facilities through the Paycheck Protection Program (PPP), the Main Street lending program and the Municipal Liquidity Facility (MLF) while the Fed in May announced it would begin buying exchange-traded funds (ETFs) that include U.S. corporate bonds.
As other economies around the world, the U.S. economy has been hit hard by measures to curb the spread of the Covid-19 virus and this week the National Bureau of Economic Research, which tracks economic cycles in the U.S., this week said the U.S. officially entered a recession in February, ending a 128-month expansion, the longest since records began in 1854.
The OECD, the Paris-based international economic organization of developed economies, earlier today released its latest outlook for the global economy, saying the pandemic has triggered “the most severe economic recession in nearly a century,” with the U.S. economy shrinking by 7.3 percent even if a second wave of the virus is avoided and by 8.5 percent if a second wave takes hold.
In the first quarter of this year, the U.S. gross domestic product contracted an annualized 5.0 percent in the first quarter from the previous quarter for annual growth of only 0.23 percent, down from 2.3 percent in the fourth quarter of last year.
Inflation in the U.S. has decelerated sharply in recent months, reflecting the fall in crude oil prices and energy, with headline consumer prices up only 0.1 percent in May from last year, down from 0.3 percent in April, well below the Fed’s target of 2.0 percent.
The Fed forecast inflation, as measured by its favored personal consumption expenditure index, will average 1.0 percent this year, then 1.6 percent in 2021 and 1.7 percent in 2022 while the unemployment rate will average 9.3 percent this year, then 6.5 percent in 2021 and 5.5 percent in 2022.

The Board of Governors of the Federal Reserve System released the following statement:


“The Federal Reserve is committed to using its full range of tools to support the U.S. economy in this challenging time, thereby promoting its maximum employment and price stability goals.
The coronavirus outbreak is causing tremendous human and economic hardship across the United States and around the world. The virus and the measures taken to protect public health have induced sharp declines in economic activity and a surge in job losses. Weaker demand and significantly lower oil prices are holding down consumer price inflation. Financial conditions have improved, in part reflecting policy measures to support the economy and the flow of credit to U.S. households and businesses.
The ongoing public health crisis will weigh heavily on economic activity, employment, and inflation in the near term, and poses considerable risks to the economic outlook over the medium term. In light of these developments, the Committee decided to maintain the target range for the federal funds rate at 0 to 1/4 percent. The Committee expects to maintain this target range until it is confident that the economy has weathered recent events and is on track to achieve its maximum employment and price stability goals.
The Committee will continue to monitor the implications of incoming information for the economic outlook, including information related to public health, as well as global developments and muted inflation pressures, and will use its tools and act as appropriate to support the economy. In determining the timing and size of future adjustments to the stance of monetary policy, the Committee will assess realized and expected economic conditions relative to its maximum employment objective and its symmetric 2 percent inflation objective. This assessment will take into account a wide range of information, including measures of labor market conditions, indicators of inflation pressures and inflation expectations, and readings on financial and international developments.
To support the flow of credit to households and businesses, over coming months the Federal Reserve will increase its holdings of Treasury securities and agency residential and commercial mortgage-backed securities at least at the current pace to sustain smooth market functioning, thereby fostering effective transmission of monetary policy to broader financial conditions. In addition, the Open Market Desk will continue to offer large-scale overnight and term repurchase agreement operations. The Committee will closely monitor developments and is prepared to adjust its plans as appropriate.
Voting for the monetary policy action were Jerome H. Powell, Chair; John C. Williams, Vice Chair; Michelle W. Bowman; Lael Brainard; Richard H. Clarida; Patrick Harker; Robert S. Kaplan; Neel Kashkari; Loretta J. Mester; and Randal K. Quarles.”


Gold Prices Recover From Friday’s Declines

By Orbex

The precious metal is up over 1% intraday on Tuesday. The gains came after prices bounced off the lower support level near 1671.95.

Following this, the breakout of the falling trend line also confirms the upside view.

The next key price target is 1724.62. However, we expect prices to reverse off this level.

It could potentially push gold prices back to the 1671.95 level of support.

But a breakout from this level is also likely considering the consolidation.

In such an event, gold prices could be looking to move lower to the 1571.78 level where support could come in and stall the precious metal from further declines.

By Orbex

GBPUSD Rebounds After Establishing New Support

By Orbex

The British pound sterling is posting steady gains. The gains come just after GBPUSD slipped back to the 1.2643 level.

With support forming here, price action is attempting to test the previous highs from earlier on Tuesday.

A close above 1.2719 could potentially signal further gains toward the 1.3000 key psychological level.

However, keep an eye on the Stochastics oscillator which could potentially signal exhaustion in the near term.

This will put further gains at risk and also the support level of 1.2643.

By Orbex


Investors Have Taken a Wait-and-See Attitude Before the Fed Interest Rate Decision

by JustForex

The US dollar shows a variety of trends against a basket of currency majors. The US dollar index (#DX) closed in the negative zone (-0.30%) yesterday. Investors expect the Fed meeting. We recommend paying attention to the comments by the Central Bank. Earlier this month, the hope that the US economy could recover faster than expected led to the fact that the US government bonds yield reached three-month highs and thereby supported the dollar. Therefore, it is possible that the Fed, which is not expected to change interest rates, may decide to adjust the yield curve to reduce 10-year treasury bonds. This, in turn, may lead to a decrease in the US currency.

Meanwhile, optimistic data on the US economy were published yesterday. Thus, the JOLTS job openings increased by 5.046M in April, while experts forecasted growth by 5,000M. Today, investors will also assess data on inflation in the US.

The “black gold” prices are consolidating. Currently, futures for the WTI crude oil are testing the $37.85 mark per barrel. At 17:30, the US crude oil inventories will be published.

Market indicators

Yesterday, there was a variety of trends in the US stock market: #SPY (-0.75%), #DIA (-1.05%), #QQQ (+0.72%).

The 10-year US government bonds yield has been declining. At the moment, the indicator is at the level of 0.79-0.80%.

The news feed on 2020.06.10:
  • – US inflation report at 15:30 (GMT+3:00);
  • – Fed interest rate decision at 21:00 (GMT+3:00).

by JustForex

Eurozone GDP Revised Higher But German Data Worsens

By Orbex

German Trade Balance Falls Further

The latest German data has raised further concerns over the health of the economy as a result of the COVID-19 crisis.

Industrial production data for April came in lower by 17.9%. This marked a severe deterioration from the -8.9% recorded in March and was worse than the -16% forecast. It was also the worst recorded monthly fall since records began in 1991.

With exports over the month falling by 24% from the prior month’s -11.7% and imports falling 16.5% from the prior month’s -5.1%, the German trade balance for the month fell to just 3.5 billion EUR.

This marks a shocking drop from the 17.4 billion EUR trade surplus registered over the prior month. It was also well below the 11.9 billion EUR surplus forecast.

German Export Engine Faltering

The German economy’s export market has long sat at the heart of the eurozone economy. However, the coronavirus crisis has badly damaged it. It had already been weak due to the global trade war which ravaged the global economy in the two years prior to the crisis.

The weakness in the German economy, particularly within the export sector, raises questions over the likely pace of the recovery.

Germany’s export sector has typically led the recovery from past recessions. However, it looks as though the recovery is going to have to come from another part of the economy this time around.

President Trump’s fresh threats of imposing import tariffs on EU autos and auto-parts further clouds the outlook for the German export sector.

Eurozone Q1 GDP Revised Higher

Still, the data has not been all bad this week.

Eurozone GDP for Q1 saw a mild upwards revision to -3.6% from the initially announced -3.8%. While the reading is still negative, at this stage, any improvement is good news. It marks a slightly higher starting point for the recovery effort.

This effort received further assistance from the ECB last week as it announced an additional 600 billion EUR in funds for its PEPP, taking the total stimulus in operation to 1.35 trillion EUR.

However, the decline in growth over Q1 still marks the largest quarterly decline since the EUR was introduced in 1999. It also raises the prospect of a technical recession being confirmed should Q2 growth also come in negative.

DAX Testing Key Fib Level

The GER30 has seen an impressive recovery rally since the 2020 lows registered in March. It has now recovered back to the 78.6% level of the drop from 2020 highs.

While we are seeing some initial selling here, focus remains on further upside and an eventual move back up to test the 2020 highs at 13813.7.

To the downside, the 11252.6 level remain the key support to watch and while above here, the outlook remains bullish.

By Orbex

Today the US Fed regular meeting is to be held

By IFCMarkets

Top daily news

The dynamics of dollar index, stock markets and precious metals may be affected by the results of today’s Fed meeting. No rate changes are expected. The direction of the movement of quotes may depend on whether the US regulator announces new, additional stimulus measures to support the American economy or keeps its monetary policy unchanged. Reputable international organizations started publishing pessimistic forecasts of the global economic downturn for 2020.

Forex news

Currency PairChange
EUR USD+0.15%
GBP USD+0.13%
USD JPY-0.33%
The US dollar index continues to fall ahead of today’s Fed meeting. In less than 3 weeks, it has already fallen by almost 4%. There are several reasons for this: mass protests of African-Americans in the United States, Fed emissions and soft monetary policy, as well as the ongoing Covid-19 pandemic. Market participants do not expect a Fed rate cut. Any optimistic statements by its representatives may support the dollar. Also today at 13-30 CET the USA inflation data for May is expected to be released, the outlook is positive. In the morning, China reported a decrease in May inflation, which was more significant than expected. This helped to strengthen the renminbi, as well as the Australian and New Zealand dollars. Michel Barnier, the EU’s negotiator for Brexit, is expected to make a statement today. It may affect the British pound if any new information appears. Let us recall that Britain withdrew from the European Union in February and the pound’s exchange rate collapsed. Now it has got most of its losses back. Now he’s got most of his losses back. Until December of this year, the transitional period for Brexit will continue, during which the parties must settle their mutual obligations.

Stock Market news

IndicesChange
Dow Jones Index-1.09%
S&P 500-0.78%
Nasdaq 100+0.29%
GB 100 Index-2.69%
DE 30-2.35%
There was no single trend in the US stock market on Tuesday. The high-tech Nasdaq index rose, while the remaining indices fell. Apple Inc shares rose in price by 3.2% and Microsoft Corporation – by 0.8%. Yesterday they updated their historical highs. Nasdaq 100 first tested the psychological level of 10,000 points, but could not gain a foothold there. Two influential international organizations, the World Bank and the OECD (Organization for Economic Cooperation and Development), published very pessimistic forecasts of world GDP for the current year. The World Bank expects a global economic downturn of 5.2%, while the OECD expects global GDP to fall by 6% or 7.6%, depending on whether the 2nd wave of the coronavirus pandemic occurs or not. This may limit stock market growth. In the meantime, the global MSCI world stock index soared by 45% from its 4-year low in March this year.

Commodity Market news

CommoditiesChange
WTI Crude-1.17%
Brent Crude Oil-1.07%
Oil quotes are declining slightly for the 3rd day in a row. At first, investors took profits after the previous growth because OPEC + extended the existing restrictions only until the end of July, and not until the end of September, as was expected. Forecasts of the global economic recession in 2020 from the World Bank and the OECD became an additional factor in the cheapening of oil. In mid-April, the IMF published its forecast for the global GDP decline by 3% this year; it can be revised upwards. Independent American Petroleum Institute (API) expects an increase in oil reserves in the US over the past week by 8.4 million barrels. This may be an additional negative for oil quotes. The Energy Information Administration (EIA) will release official data, as usual, today at 15-30 CET.

Gold Market News

MetalsChange
Gold+0.98%
Gold is rising in price for the 3rd day in a row. This is facilitated by the weakening US dollar and negative forecasts of a global recession from reputable international organizations. The Fed meeting results may adversely affect the dynamics of precious metals, if the US regulator does not announce new, additional measures to stimulate the economy.

Market Analysis provided by IFCMarkets

Note:
This overview has an informative and tutorial character and is published for free. All the data, included in the overview, are received from public sources, recognized as more or less reliable. Moreover, there is no guarantee that the indicated information is full and precise. Overviews are not updated. The whole information in each overview, including opinion, indicators, charts and anything else, is provided only for familiarization purposes and is not financial advice or а recommendation. The whole text and its any part, as well as the charts cannot be considered as an offer to make a deal with any asset. IFC Markets and its employees under any circumstances are not liable for any action taken by someone else during or after reading the overview.

Forex Technical Analysis & Forecast 10.06.2020

Article By RoboForex.com

EURUSD, “Euro vs US Dollar”

After extending the descending impulse towards 1.1240, EURUSD has completed the ascending structure at 1.1360, thus forming a new consolidation range between these two levels. Possibly, today the pair may fall to reach 1.1300. If later the price breaks the range to the upside, the market may start another growth towards 1.1414; if to the downside – resume trading inside the downtrend with the target at 1.1208.

EURUSD
Risk Warning: the result of previous trading operations do not guarantee the same results in the future

GBPUSD, “Great Britain Pound vs US Dollar”

GBPUSD is consolidating around 1.2686. Today, the pair may form one more ascending structure to reach 1.2750. After that, the instrument may start another decline towards 1.2626 and then resume trading upwards with the target at 1.2868. If later the price breaks the range to the downside, the market may form a new descending structure to reach 1.2460.

GBPUSD
Risk Warning: the result of previous trading operations do not guarantee the same results in the future

USDRUB, “US Dollar vs Russian Ruble”

USDRUB is still consolidating around 68.80. Possibly, today the pair may reach 67.55 and then start a new correction with the target at 69.59.

USDRUB
Risk Warning: the result of previous trading operations do not guarantee the same results in the future

USDJPY, “US Dollar vs Japanese Yen”

USDJPY is falling towards 107.49. After that, the instrument may form one more ascending structure to break 108.02 and then continue trading upwards with the first target at 108.40.

USDJPY
Risk Warning: the result of previous trading operations do not guarantee the same results in the future

USDCHF, “US Dollar vs Swiss Franc”

After finishing the descending wave at 0.9484, USDCHF is consolidating near the lows. Possibly, the pair may form one more ascending structure to break 0.9515 and then continue trading upwards with the first target at 0.9565.

USDCHF
Risk Warning: the result of previous trading operations do not guarantee the same results in the future

AUDUSD, “Australian Dollar vs US Dollar”

After finishing the descending wave at 0.6903, AUDUSD is still correcting towards 0.6983. Possibly, the pair may reach this level and then start another decline with the target at 0.6833.

AUDUSD
Risk Warning: the result of previous trading operations do not guarantee the same results in the future

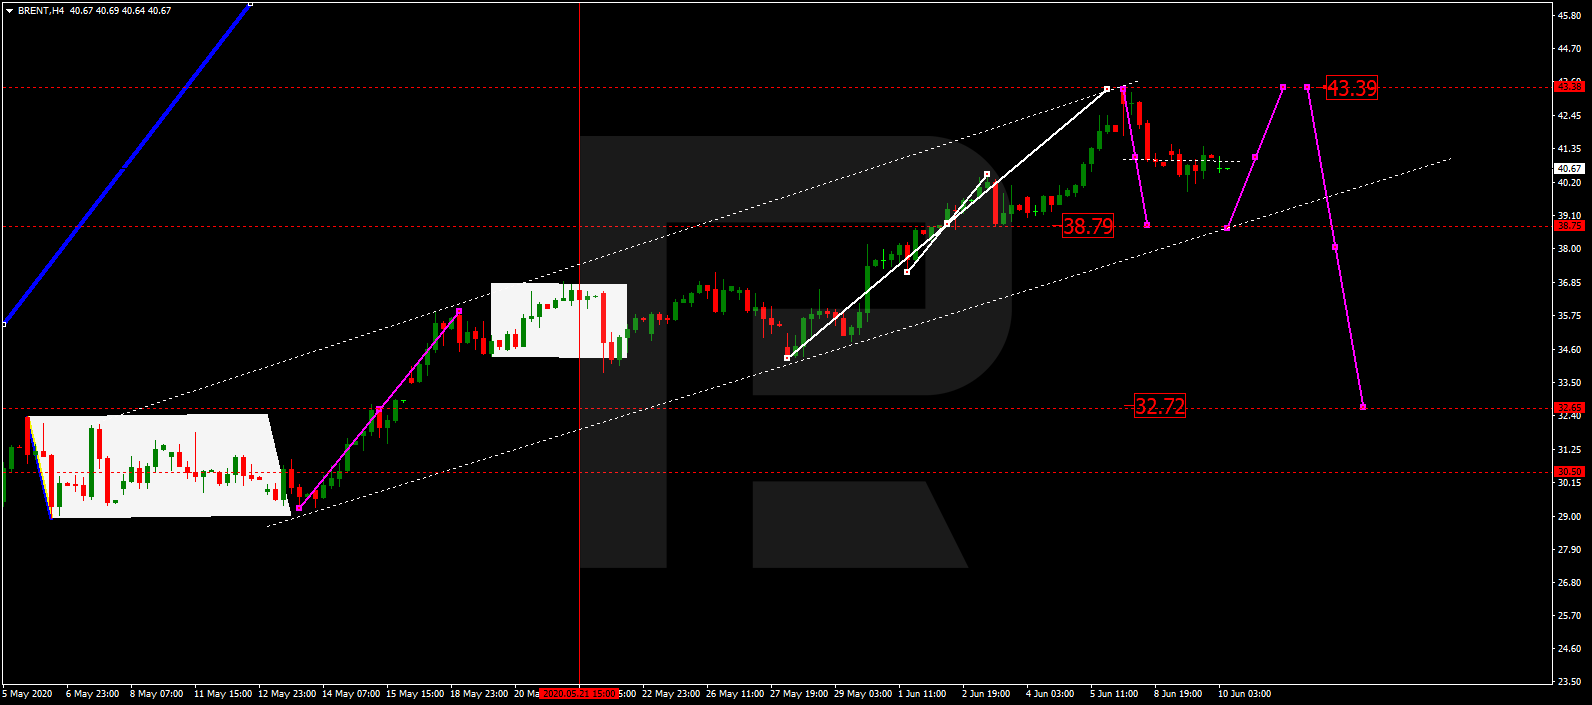
BRENT

Brent is consolidating around 41.00. Today, the pair may correct towards 38.80 and then resume trading upwards with the short-term target at 43.43.

BRENT
Risk Warning: the result of previous trading operations do not guarantee the same results in the future

XAUUSD, “Gold vs US Dollar”

Gold is moving near the highs. Possibly, today the pair may reach 1720.40 and then form a new descending wave to break 1695.70. After that, the instrument may continue trading inside the downtrend with the short-term target at 1658.30.

GOLD
Risk Warning: the result of previous trading operations do not guarantee the same results in the future

BTCUSD, “Bitcoin vs US Dollar”

BTCUSD is consolidating around 9698.00. Today, the pair is expected to expand the range up to 9833.00. Later, the market may fall to break 9550.00 and then continue trading downwards with the target at 9100.00.

BITCOIN
Risk Warning: the result of previous trading operations do not guarantee the same results in the future

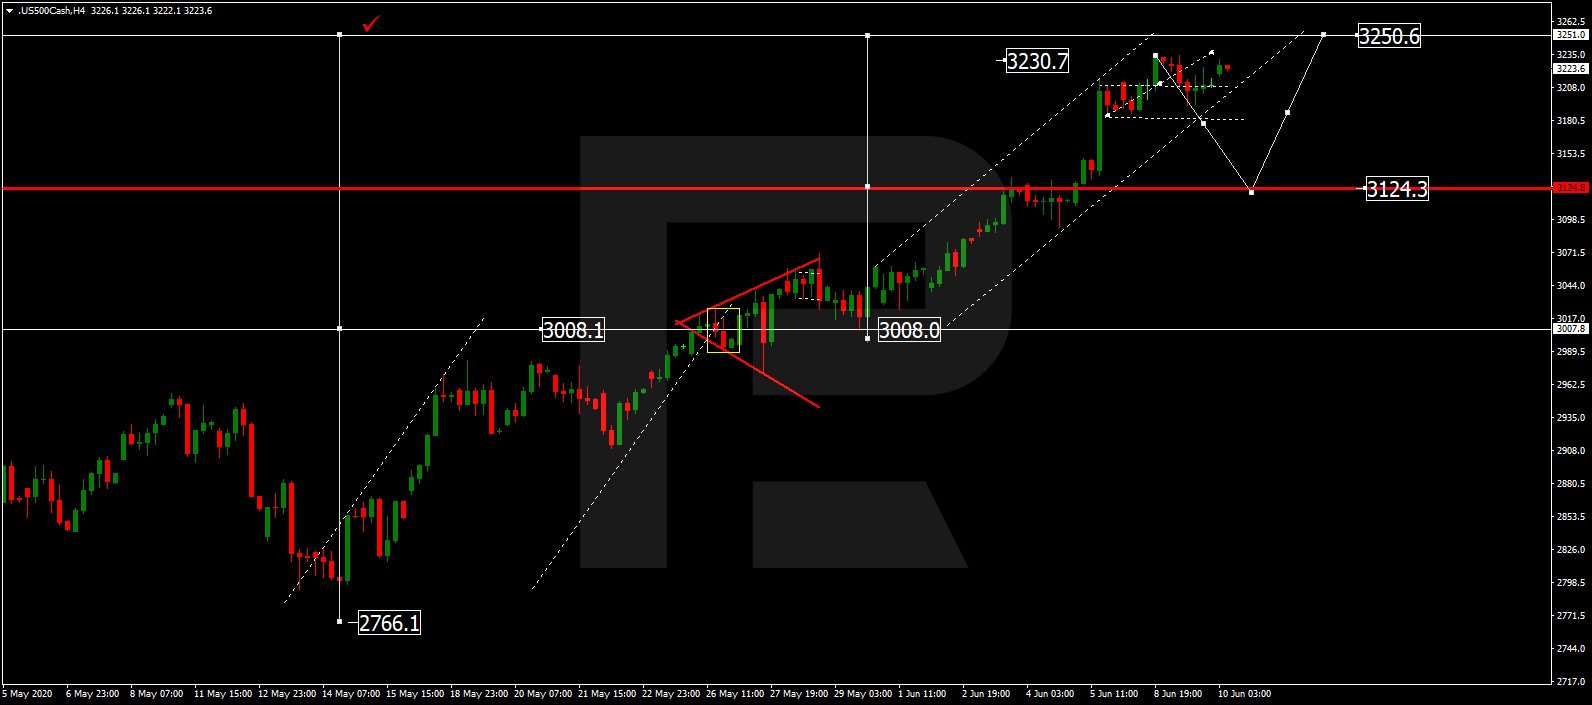
S&P 500

The Index continues the ascending wave towards 3250.5; right now, it is consolidating around 3212.2. Possibly, today the asset may grow to reach 3233.3 or even 3250.5 and complete this ascending wave. After that, the instrument may start a new correction with the target at 3125.5.

S&P 500

Article By RoboForex.com

Attention!
Forecasts presented in this section only reflect the author’s private opinion and should not be considered as guidance for trading. RoboForex LP bears no responsibility for trading results based on trading recommendations described in these analytical reviews.

Fibonacci Retracements Analysis 10.06.2020 (GBPUSD, EURJPY)

Article By RoboForex.com

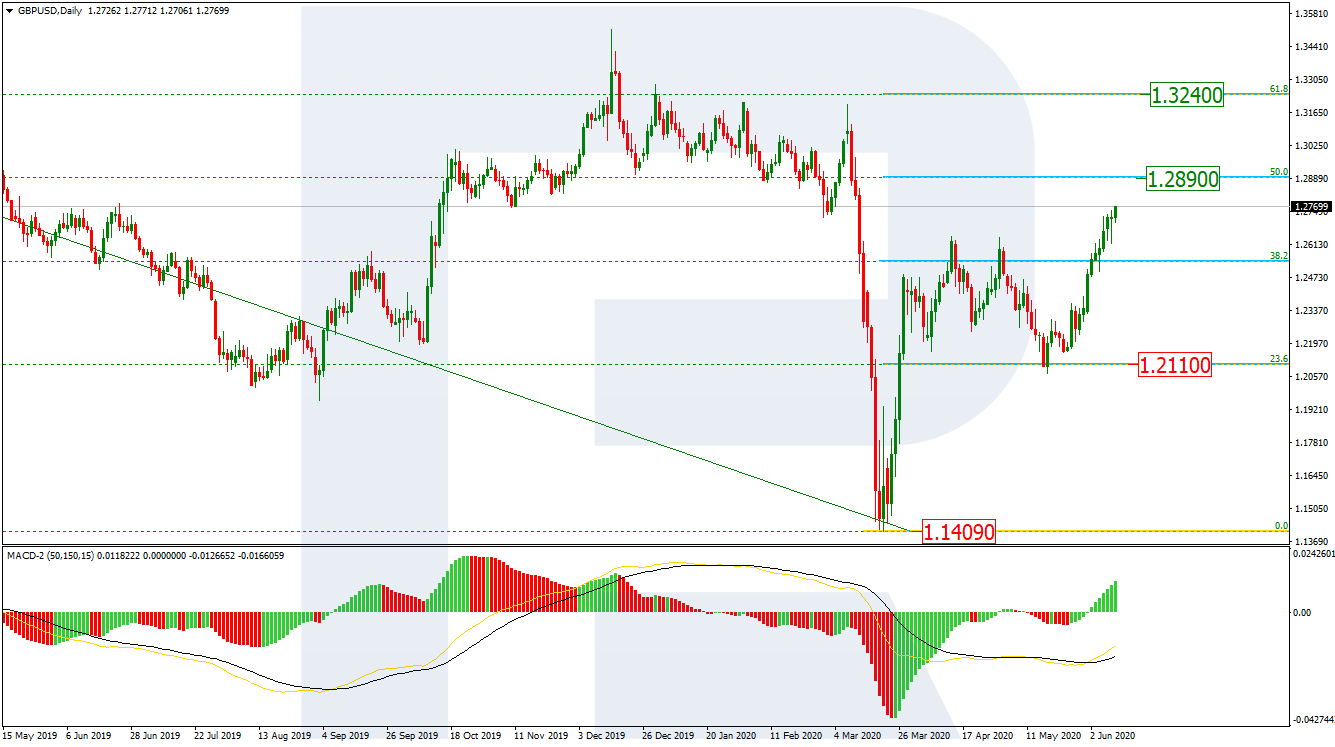
GBPUSD, “Great Britain Pound vs US Dollar”

As we see in the daily chart, after breaking the high at 1.2648, GBPUSD is forming a steady rising impulse towards 50.0% and 61.8% fibo at 1.2890 and 1.3240 respectively. The support is at 23.6% fibo at 1.2110.

GBPUSD_D1
Risk Warning: the result of previous trading operations do not guarantee the same results in the future

The H4 chart shows more detailed structure of the current ascending movement. After completing the descending wave and then forming a new rising one to break high, the pair is moving towards the post-correctional extension area between 138.2% and 161.8% fibo at 1.2865 and 1.3000 respectively. At the same time, there is a divergence on MACD, which may indicate a possible pullback soon.

GBPUSD_H4
Risk Warning: the result of previous trading operations do not guarantee the same results in the future

EURJPY, “Euro vs. Japanese Yen”

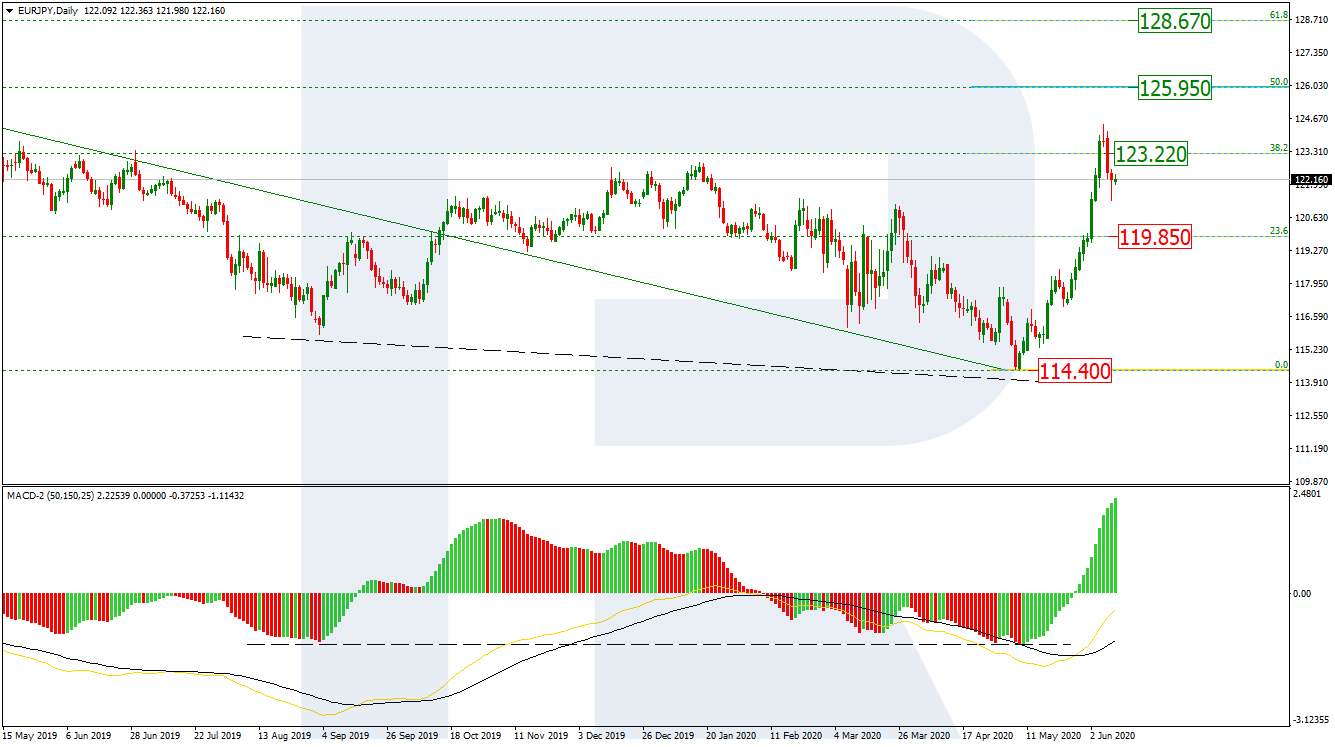
As we can see in the daily chart, after reaching 38.2% fibo at 123.22, EURJPY has started a new pullback. Later, the pair may complete the correction and resume growing towards 50.0% and 61.8% fibo at 125.95 and 128.67 respectively. The support is 23.6% fibo at 119.85.

EURJPY_D1
Risk Warning: the result of previous trading operations do not guarantee the same results in the future

In the H4 chart, EURJPY is falling towards the support at 23.6% fibo (119.85). After finishing the correction, the instrument may continue trading to reach the post-correctional extension area between 138.2% and 161.8% fibo at 126.08 and 128.10 respectively.

EURJPY_H4

Article By RoboForex.com

Attention!
Forecasts presented in this section only reflect the author’s private opinion and should not be considered as guidance for trading. RoboForex LP bears no responsibility for trading results based on trading recommendations described in these analytical reviews.

The Analytical Overview of the Main Currency Pairs on 2020.06.10

by JustForex

The EUR/USD currency pair

Technical indicators of the currency pair:
  • Prev Open: 1.12949
  • Open: 1.13387
  • % chg. over the last day: +0.43
  • Day’s range: 1.13316 – 1.13697
  • 52 wk range: 1.0777 – 1.1494

The EUR/USD currency pair continues to be traded in a flat. There is no defined trend. Financial market participants have taken a wait-and-see attitude before the announcement of the results of the two-day Fed meeting. It is expected that the regulator will keep the key marks of monetary policy at the same level. We recommend paying attention to the comments by the Central Bank representatives. Currently, EUR/USD quotes are consolidating in the range of 1.1320-1.1380. Positions should be opened from these marks.

The Economic News Feed for 2020.06.10:
  • – Inflation report in the US at 15:30 (GMT+3:00);
  • – Fed interest rate decision at 21:00 (GMT+3:00).
EUR/USD

Indicators signal the power of buyers: the price has fixed above 50 MA and 100 MA.

The MACD histogram is in the positive zone, indicating the bullish sentiment.

Stochastic Oscillator is in the neutral zone, the %K line has crossed the %D line. There are no signals at the moment.

Trading recommendations
  • Support levels: 1.1320, 1.1250, 1.1195
  • Resistance levels: 1.1380, 1.1450, 1.1500

If the price fixes above 1.1380, further growth of EUR/USD quotes is expected. The movement is tending to 1.1420-1.1450.

An alternative could be a decrease in the EUR/USD currency pair to 1.1260-1.1220.

The GBP/USD currency pair

Technical indicators of the currency pair:
  • Prev Open: 1.27232
  • Open: 1.27259
  • % chg. over the last day: +0.06
  • Day’s range: 1.27062 – 1.27863
  • 52 wk range: 1.1466 – 1.3516

GBP/USD quotes continue to show a steady uptrend. The British pound has overcome and fixed above key extremes. At the moment, the trading instrument is consolidating near 1.2785. The 1.2725 mark is already a “mirror” support. Today, investors will be focused on the Fed meeting. We recommend opening positions from key levels.

The news feed on the UK economy is calm.

GBP/USD

Indicators signal the power of buyers: the price has fixed above 50 MA and 100 MA.

The MACD histogram is in the positive zone and above the signal line, which gives a strong signal to buy GBP/USD.

Stochastic Oscillator is near the overbought zone, the %K line has crossed the %D line. There are no signals at the moment.

Trading recommendations
  • Support levels: 1.2725, 1.2635, 1.2585
  • Resistance levels: 1.2785, 1.2850

If the price fixes above 1.2785, further growth of GBP/USD quotes is expected. The movement is tending to 1.2840-1.2860.

An alternative could be a decrease in the GBP/USD currency pair to 1.2660-1.2630.

The USD/CAD currency pair

Technical indicators of the currency pair:
  • Prev Open: 1.33753
  • Open: 1.34166
  • % chg. over the last day: +0.23
  • Day’s range: 1.33703 – 1.34280
  • 52 wk range: 1.2949 – 1.4668

The USD/CAD currency pair has become stable. The loonie is currently consolidating. The local support and resistance levels are 1.3360 and 1.3425, respectively. Financial market participants expect additional drivers. Today we recommend paying attention to the news feed on the US economy, as well as the dynamics of oil prices. Positions should be opened from key levels.

Today, the publication of important economic releases from Canada is not expected.

USD/CAD

Indicators do not give accurate signals: the price has crossed 50 MA.

The MACD histogram has started declining, which indicates the development of bearish sentiment.

Stochastic Oscillator is in the neutral zone, the %K line is above the %D line, which gives a signal to buy USD/CAD.

Trading recommendations
  • Support levels: 1.3360, 1.3300
  • Resistance levels: 1.3425, 1.3480, 1.3530

If the price fixes below 1.3360, a further drop in USD/CAD quotes is expected. The movement is tending to the round level of 1.3300.

An alternative could be the growth of the USD/CAD currency pair to 1.3480-1.3520.

The USD/JPY currency pair

Technical indicators of the currency pair:
  • Prev Open: 108.434
  • Open: 107.727
  • % chg. over the last day: -0.64
  • Day’s range: 107.287 – 107.874
  • 52 wk range: 101.19 – 112.41

The USD/JPY currency pair shows a negative trend. Since the beginning of this week, the yen has increased by more than 200 points against the greenback. The trading instrument has set new local lows. At the moment, USD/JPY quotes are consolidating in the range of 107.30-107.65. The USD/JPY currency pair has the potential for further decline. We expect the results of the Fed meeting. Positions should be opened from key levels.

The news feed on Japan’s economy is calm.

USD/JPY

Indicators signal the power of sellers: the price has fixed below 50 MA and 100 MA.

The MACD histogram is in the negative zone and continues to decline, which indicates the bearish sentiment.

Stochastic Oscillator is in the oversold zone, the %K line has crossed the %D line. There are no signals at the moment.

Trading recommendations
  • Support levels: 107.30, 107.10, 106.70
  • Resistance levels: 107.65, 107.90, 108.25

If the price fixes below 107.30, a further drop in USD/JPY quotes is expected. The movement is tending to 107.00-106.70.

An alternative could be the growth of the USD/JPY currency pair to 108.00-108.25.

by JustForex