The Analytical Overview of the Main Currency Pairs on 2020.06.12

by JustForex

The EUR/USD currency pair

Technical indicators of the currency pair:
  • Prev Open: 1.13746
  • Open: 1.12912
  • % chg. over the last day: -0.63
  • Day’s range: 1.12766 – 1.13161
  • 52 wk range: 1.0777 – 1.1494

EUR/USD quotes have been declining. The trading instrument has updated local lows. The demand for risky assets has weakened significantly. Financial market participants are concerned about the second wave of COVID-19 outbreak. The United States has reported more than 2 million coronavirus cases as of June 12, as well as a re-wave of infection in the most populous states. Currently, the single currency is consolidating in the range of 1.1275-1.1320. EUR/USD quotes have the potential for further correction. Positions should be opened from key levels.

The Economic News Feed for 2020.06.12:
  • – Eurozone industrial production at 12:00 (GMT+3:00).
EUR/USD

Indicators do not give accurate signals: the price has fixed between 50 MA and 100 MA.

The MACD histogram is in the negative zone, but above the signal line, which gives a weak signal to sell EUR/USD.

Stochastic Oscillator is in the overbought zone, the %K line has crossed the %D line. There are no signals at the moment.

Trading recommendations
  • Support levels: 1.1275, 1.1240, 1.1190
  • Resistance levels: 1.1320, 1.1380, 1.1420

If the price fixes below the level of 1.1275, a further fall in EUR/USD quotes is expected. The movement is tending to 1.1240-1.1200.

An alternative could be the growth of the EUR/USD currency pair to 1.1370-1.1400.

The GBP/USD currency pair

Technical indicators of the currency pair:
  • Prev Open: 1.27450
  • Open: 1.26000
  • % chg. over the last day: -1.37
  • Day’s range: 1.25452 – 1.26453
  • 52 wk range: 1.1466 – 1.3516

The GBP/USD currency pair has been declining. The British pound has updated local lows. At the moment, the key range is 1.2550-1.2640. The demand for risky assets is still low. The British pound is under pressure due to pessimistic economic releases. A further drop in GBP/USD quotes is possible. We recommend opening positions from key levels.

GBP/USD

Indicators do not give accurate signals: the price has crossed 100 MA.

The MACD histogram is in the negative zone, but above the signal line, which gives a weak signal to sell GBP/USD.

Stochastic Oscillator is near the overbought zone, the %K line has crossed the %D line. There are no signals at the moment.

Trading recommendations
  • Support levels: 1.2550, 1.2500, 1.2425
  • Resistance levels: 1.2640, 1.2730, 1.2800

If the price fixes below 1.2550, GBP/USD sales should be considered. The movement is tending to 1.2500-1.2460.

An alternative could be the growth of the GBP/USD currency pair to 1.2700-1.2750.

The USD/CAD currency pair

Technical indicators of the currency pair:
  • Prev Open: 1.34115
  • Open: 1.36242
  • % chg. over the last day: +1.59
  • Day’s range: 1.35407 – 1.36664
  • 52 wk range: 1.2949 – 1.4668

During yesterday’s trading session, aggressive purchases of USD/CAD were observed. Quotes growth has exceeded 220 points. The trading instrument has set new local highs. At the moment, the loonie is stable and consolidating in the range of 1.3530-1.3600. We do not exclude the further growth of USD/CAD quotes. We recommend paying attention to the dynamics of oil quotes. Positions should be opened from key levels.

Today, the publication of important economic releases from Canada is not expected.

USD/CAD

Indicators signal the power of buyers: the price has fixed above 50 MA and 100 MA.

The MACD histogram is in the positive zone, but below the signal line, which gives a weak signal to buy USD/CAD.

Stochastic Oscillator is in the oversold zone, the %K line has crossed the %D line. There are no signals at the moment.

Trading recommendations
  • Support levels: 1.3530, 1.3480, 1.3430
  • Resistance levels: 1.3600, 1.3665

If the price consolidates above 1.3600, further growth of USD/CAD quotes is expected. The movement is tending to 1.3660-1.3700.

An alternative could be a decrease in the USD/CAD currency pair to 1.3480-1.3430.

The USD/JPY currency pair

Technical indicators of the currency pair:
  • Prev Open: 107.087
  • Open: 106.880
  • % chg. over the last day: -0.23
  • Day’s range: 106.585 – 107.529
  • 52 wk range: 101.19 – 112.41

The USD/JPY currency pair has started recovering after a prolonged fall. The trading instrument has updated local highs. At the moment, the key support and resistance levels are 107.10 and 107.60, respectively. The technical pattern signals a further increase in USD/JPY quotes. We recommend paying attention to the dynamics of US government bonds yield. Positions should be opened from key levels.

During the Asian trading session, weak data on industrial production were published in Japan.

USD/JPY

Indicators do not give accurate signals: the price has fixed between 50 MA and 100 MA.

The MACD histogram has started growing, which indicates the development of bullish sentiment.

Stochastic Oscillator is in the overbought zone, the %K line has crossed the %D line. There are no signals at the moment.

Trading recommendations
  • Support levels: 107.10, 106.60
  • Resistance levels: 107.60, 107.90, 108.25

If the price fixes above 107.60, further growth of USD/JPY quotes is expected. The movement is tending to 108.00-108.20.

An alternative could be a decrease in the USD/JPY currency pair to 106.70-106.40.

by JustForex
Ichimoku Cloud Analysis 12.06.2020 (BTCUSD, USDCAD, NZDUSD)

Article By RoboForex.com

BTCUSD, “Bitcoin vs US Dollar”

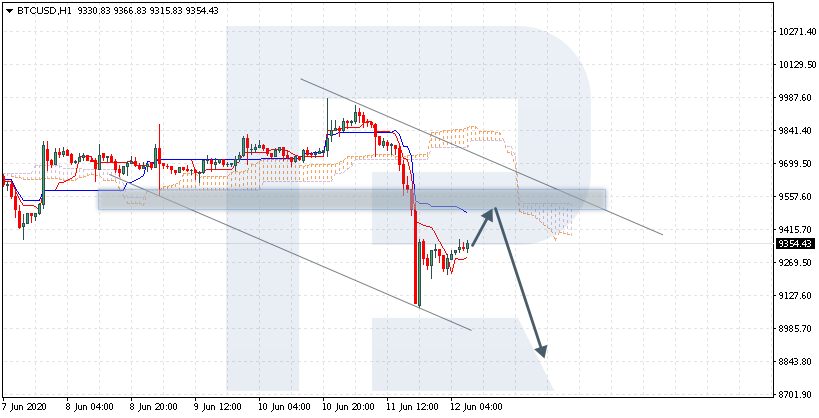
BTCUSD is trading at 9354.00; the instrument is moving below Ichimoku Cloud, thus indicating a descending tendency. The markets could indicate that the price may test Tenkan-Sen and Kijun-Sen at 9475.00 and then resume moving downwards to reach 8845.00. Another signal in favor of further downtrend will be a rebound from the resistance level. However, the bearish scenario may no longer be valid if the price breaks the cloud’s upside border and fixes above 9805.00. In this case, the pair may continue growing towards 10255.00.

BTCUSD
Risk Warning: the result of previous trading operations do not guarantee the same results in the future

USDCAD, “US Dollar vs Canadian Dollar”

USDCAD is trading at 1.3600; the instrument is moving above Ichimoku Cloud, thus indicating an ascending tendency. The markets could indicate that the price may test Tenkan-Sen and Kijun-Sen at 1.3545 and then resume moving upwards to reach 1.3755. Another signal in favor of further uptrend will be a rebound from the rising channel’s downside border. However, the bullish scenario may no longer be valid if the price breaks the cloud’s downside border and fixes below 1.3385. In this case, the pair may continue falling towards 1.3295.

USDCAD
Risk Warning: the result of previous trading operations do not guarantee the same results in the future

NZDUSD, “New Zealand Dollar vs US Dollar”

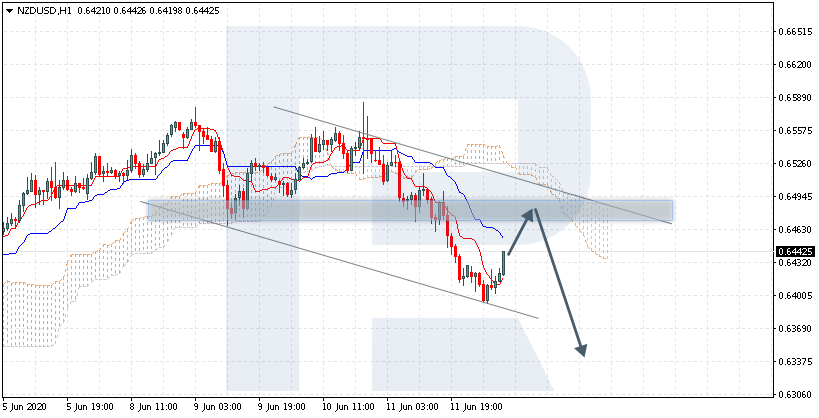
NZDUSD is trading at 0.6442; the instrument is moving below Ichimoku Cloud, thus indicating a descending tendency. The markets could indicate that the price may test the cloud’s downside border at 0.6480 and then resume moving downwards to reach 0.6335. Another signal in favor of further downtrend will be a rebound from the resistance level. However, the bearish scenario may be canceled if the price breaks the cloud’s upside border and fixes above 0.6555. In this case, the pair may continue growing towards 0.6645.

NZDUSD

Article By RoboForex.com

Attention!
Forecasts presented in this section only reflect the author’s private opinion and should not be considered as guidance for trading. RoboForex LP bears no responsibility for trading results based on trading recommendations described in these analytical reviews.

Fibonacci Retracements Analysis 12.06.2020 (BITCOIN, ETHEREUM)

Article By RoboForex.com

BTCUSD, “Bitcoin vs US Dollar”

As we can see in the H4 chart, there haven’t been a lot of changes much after the divergence but they are about to come quite soon. After finishing a two-week ascending correction, BTCUSD has plummeted to update its local lows. Such a movement indicates a potential for further decline towards 23.6% and 38.2% fibo at 8846.00 and 7907.00 respectively. The resistance is the high at 10368.40.

BTCUSD
Risk Warning: the result of previous trading operations do not guarantee the same results in the future

In the H1 chart, after completing the correction, BTCUSD is trading towards the post-correctional extension area between 138.2% and 161.8% fibo at 8870.00 and 9033.70 respectively. The next target is 23.6% at 8846.00.

BITCOIN
Risk Warning: the result of previous trading operations do not guarantee the same results in the future

ETHUSD, “Ethereum vs. US Dollar”

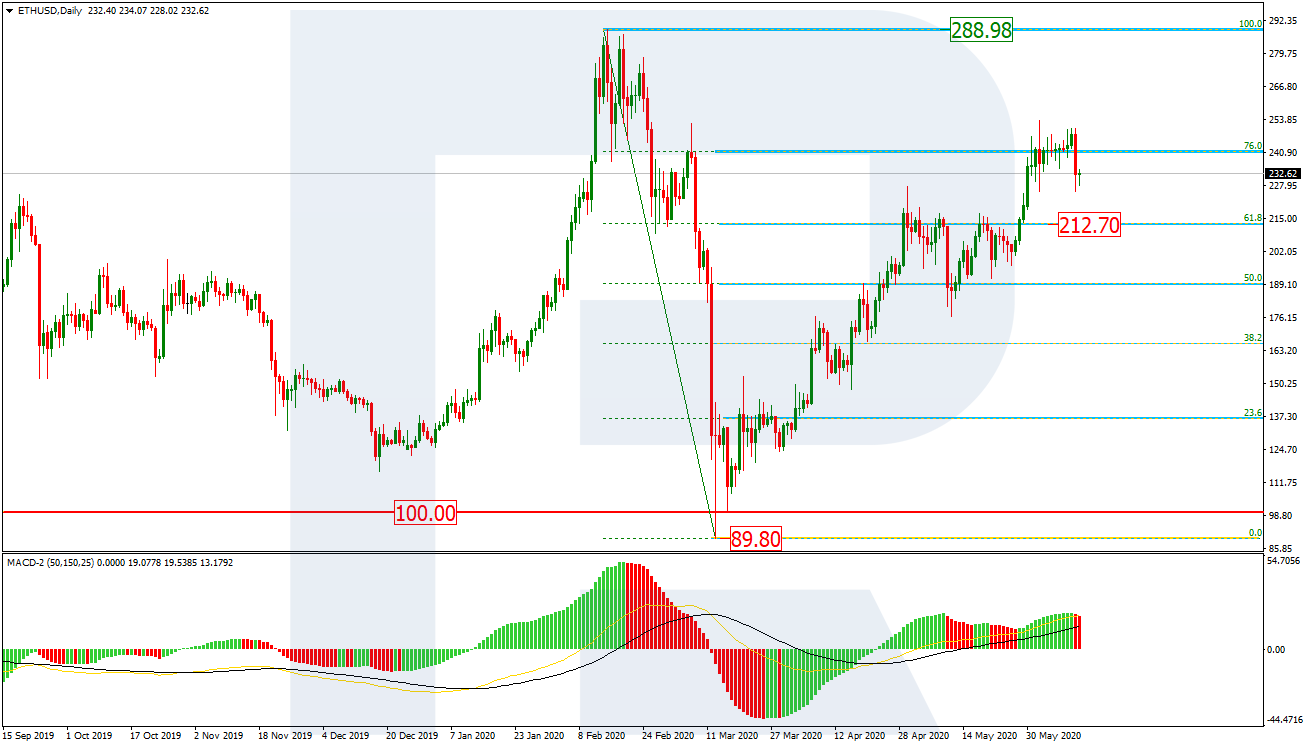
As we can see in the daily chart, the technical picture also hasn’t changed much over the previous week. ETHUSD is still trading not far from 76.0% fibo but there is a descending impulse towards the support at 61.8% fibo (212.70). If the price breaks this level, the mid-term trend may reverse. At the same time, it’s too early to exclude a possibility of further growth towards the fractal high at 288.98..

ETHUSD
Risk Warning: the result of previous trading operations do not guarantee the same results in the future

The H4 chart shows a more detailed structure of this descending impulse after the divergence. The correctional targets are 23.6%, 38.2%, and 50.0% fibo at 214.90, 191.00, and 171.60 respectively. However, if the instrument breaks the high at 253.47, the price may continue trading upwards.

ETHER

Article By RoboForex.com

Attention!
Forecasts presented in this section only reflect the author’s private opinion and should not be considered as guidance for trading. RoboForex LP bears no responsibility for trading results based on trading recommendations described in these analytical reviews.

Gold Higher On Fed Warning Message

By Orbex

Gold

Gold prices have ended the week higher as the US dollar extended its bearish move in response to the latest message from the Fed.

Speaking at the June FOMC meeting, Fed Chairman Powell delivered a stark warning to traders.

Powell advised that interest rates will remain on hold in the US until at least June 2022. The Chairman was keen to deliver a very sobering message to the market to dispel any idea that the economic damage caused to the US and global economies from COVID-19 might be easily and quickly resolved.

The warning comes just a few days after a record April NFP number which saw 2.5 million jobs created. Equity markets had been higher in the wake of the release, pulling gold prices lower.

However, Powell’s message and subsequent US weekly jobless claims yesterday have since seen equities prices reversing sharply, creating a strong safe-haven bid in gold.

Gold Still Capped by 1748.80

Despite the rally this week, gold prices remain beneath the 1748.80 level which continues to hold as key resistance. Price found firm support at the 1679.87 level. While this level remains as support, focus is on further upside. More specifically, on an eventual break of the 1748.80 level and a run back up to 2020 highs.

Silver

Silver prices have had a more disappointing week. Having spent most of the week tightly wound in range-bound conditions, the initial upside break seen in response to the FOMC meeting quickly reversed, with price erasing gains.

The heavy sell-off in equities markets is offsetting the positive input from a weaker dollar and higher gold prices on fears of a protracted economic downturn in line with the Fed’s projection.

Powell noted that the Fed now expects the US economy to shrink by 6.5% over the year.

Expectations are for the unemployment rate to end the year around 9.3% from the current level above 13%. Powell was strident in his warning that the Fed is not even “thinking about thinking about raising rates” and has caused a shift in sentiment among traders heading into the end of the week.

Silver Reverses Week’s Gains

Silver prices remain supported by the 17.42 level for now keep, keeping focus on further upside in the near term. While this level holds the 18.83 level is the next key resistance to watch.

However, if support breaks, this week’s rally could prove to be a lower high, turning focus onto a test of the 16.53 level next with the 15.85 level below.

By Orbex

Demand for Risky Assets Has Weakened

by JustForex

During yesterday’s trading session, the greenback strengthened significantly against a basket of world currencies. The dollar index (#DX) closed in the green zone (+0.82%). Major stock indices and “black gold” prices have fallen sharply. Financial market participants are concerned about the second wave of COVID-19 outbreak. The United States reported more than 2 million coronavirus cases as of June 12, as well as a re-wave of infection in the most populous states.

The UK has published pessimistic economic releases. The Office for National Statistics reported that GDP fell by 20.4% (m/m), which is below market expectations at 18.7%. The volume of manufacturing production decreased by 24.3% compared to the forecasted value of 15.8%.

Oil quotes have set new local lows. Currently, futures for the WTI crude oil are testing the $36.00 mark per barrel. We recommend paying attention to the US Baker Hughes rig count at 20:00 (GMT+3:00).

Market indicators

Yesterday, there were aggressive sales in the US stock market: #SPY (-5.76%), #DIA (-6.81%), #QQQ (-4.95%).

The 10-year US government bonds yield has been growing. At the moment, the indicator is at the level of 0.70-0.71%.

The news feed on 2020.06.12:
  • – Eurozone industrial production at 12:00 (GMT+3:00).

by JustForex

EURUSD Struggling To Get A Handle Over The 1.1400 Level

By Orbex

The euro currency briefly touched the elusive 1.1400 handle earlier on Thursday.

But prices pulled back quickly suggesting that sellers are in control.

Also, given the fact that EURUSD is on a strong bullish streak, a pullback is normal.

For the moment, the price level near 1.1347 will be key. A close below this level might suggest further declines.

The next minor support is at 1.1261. Only a strong breakdown below this level can accelerate the declines down to 1.1132.

By Orbex

Is GBPUSD Heading For A Correction?

By Orbex

The British pound sterling finally broke the minor rising trend line.

This evidently saw prices breaking the medium-term trend line as well.

For the moment, prices are trading just below the key level of 1.2643.

A strong close below this level is needed to confirm further declines.

The next downside target is at 1.2516 marking the 4th June lows in the uptrend.

And a close below here will send prices down to 1.2343 where support will be coming under test next.

By Orbex


The Fed plays into the hands of Euro bulls – EUR/USD yearly highs in focus

By Admiral Markets

Source: Economic Events June 12, 2020 – Admiral Markets’ Forex Calendar

The Euro continued with its bullish performance over the last days, making back all of its ‘losses’ after last week’s NFP report.

The main reason seems to be that market participants realized more and more that the NFP report was very likely a ‘fake’ report with the BLS stating that […]there was also a large number of workers who were classified as employed but absent from work.[…] and that […]if the workers who were recorded as employed but absent from work due to “other reasons” (…), the overall unemployment rate would have been about 3 percentage points higher than reported[…]

And after the Fed last Wednesday reinforced her dovish stance with the dot plot stating that it sees no rate hikes till the end of 2022, the combination of the EU commission’s proposal of a 750 Billion-Euro fiscal stimulus package and the ECB’s boost of its PEPP program to 1.35 trillion Euros last week on Thursday, started to play out again.

As a result, a further reduction of the US-EU-yield differential should be expected with the EUR/USD, as we currently focus on the region around 1.1400/50 USD on the upside.

A break higher makes further gains as high as 1.1700/1800 possible, nevertheless, EUR/USD traders should get a little careful due to the technical extended mode which reduces the short-term risk-reward-ratio to a more unattractive level:

Source: Admiral Markets MT5 with MT5-SE Add-on EUR/USD Daily chart (between April 12, 2019, to June 11, 2020). Accessed: June 11, 2020, at 10:00pm GMT – Please note: Past performance is not a reliable indicator of future results, or future performance.

In 2015, the value of the EUR/USD fell by 10.2%, in 2016, it fell by 3.2%, in 2017, it increased by 13.92%, 2018, it fell by 4.4%, 2019, it fell by 2.2%, meaning that after five years, it was down by 7.3%.

Discover the world’s #1 multi-asset platform

Admiral Markets offers professional traders the ability to trade with a custom, upgraded version of MetaTrader 5, allowing you to experience trading at a significantly higher, more rewarding level. Experience benefits such as the addition of the Market Heat Map, so you can compare various currency pairs to see which ones might be lucrative investments, access real-time trading data, and so much more. Click the banner below to start your FREE download of MT5 Supreme Edition!

Download MetaTrader 5 and begin trading today!

Disclaimer: The given data provides additional information regarding all analysis, estimates, prognosis, forecasts or other similar assessments or information (hereinafter “Analysis”) published on the website of Admiral Markets. Before making any investment decisions please pay close attention to the following:

  1. This is a marketing communication. The analysis is published for informative purposes only and are in no way to be construed as investment advice or recommendation. It has not been prepared in accordance with legal requirements designed to promote the independence of investment research, and that it is not subject to any prohibition on dealing ahead of the dissemination of investment research.
  2. Any investment decision is made by each client alone whereas Admiral Markets shall not be responsible for any loss or damage arising from any such decision, whether or not based on the Analysis.
  3. Each of the Analysis is prepared by an independent analyst (Jens Klatt, Professional Trader and Analyst, hereinafter “Author”) based on the Author’s personal estimations.
  4. To ensure that the interests of the clients would be protected and objectivity of the Analysis would not be damaged Admiral Markets has established relevant internal procedures for prevention and management of conflicts of interest.
  5. Whilst every reasonable effort is taken to ensure that all sources of the Analysis are reliable and that all information is presented, as much as possible, in an understandable, timely, precise and complete manner, Admiral Markets does not guarantee the accuracy or completeness of any information contained within the Analysis. The presented figures refer that refer to any past performance is not a reliable indicator of future results.
  6. The contents of the Analysis should not be construed as an express or implied promise, guarantee or implication by Admiral Markets that the client shall profit from the strategies therein or that losses in connection therewith may or shall be limited.
  7. Any kind of previous or modeled performance of financial instruments indicated within the Publication should not be construed as an express or implied promise, guarantee or implication by Admiral Markets for any future performance. The value of the financial instrument may both increase and decrease and the preservation of the asset value is not guaranteed.
  8. The projections included in the Analysis may be subject to additional fees, taxes or other charges, depending on the subject of the Publication. The price list applicable to the services provided by Admiral Markets is publicly available from the website of Admiral Markets.

Leveraged products (including contracts for difference) are speculative in nature and may result in losses or profit. Before you start trading, you should make sure that you understand all the risks

By Admiral Markets

Bulls Beware: A Dark Cloud Is Forming Over Oil Markets

By OilPrice.com

– Bullish sentiment appears to have returned to the stock markets with a vengeance. In a historic rally that has taken even die-hard bulls by surprise, the S&P 500 has managed to claw back all of its 2020 losses, taking just 53 sessions for the index to fully restore the nearly $10T in value it shed in an epic bear market. The oil markets have been nearly as impressive.

After entering negative territory for the first time in history, U.S. WTI prices have briefly touched $40/bbl amid record production cuts and an uptick in global demand. Oil and gas stocks have doubled from their March 23 nadir, marking a sharp reversal from the precipitous drop that wiped out nearly two decades of gains.

There’s no shortage of bottom fishing opportunities in this market, with shares of bankrupt or near-bankrupt shale companies including Whiting Petroleum (NYSE:WLL), Chesapeake Energy (NYSE:CHK), California Resources Corp. (NYSE:CRC) and Valaris Plc (NYSE: VAL) as well as offshore drillers Borr Drilling Ltd (NYSE:BORR), Noble Corp.(NYSE:NE), Seadrill (NYSE:SDRL) and TransOcean (NYSE:RIG) recording triple-digit gains over the past week alone.

But analysts are now saying investors need to pump their brakes.

A cross-section of Wall Street has warned that there’s too much irrational exuberance in the markets, and the oil price rally is not fully supported by fundamentals.

Source: CNN Money

Watching the Crack

According to Warren Patterson, head of commodities strategy at ING, as well as analysts at Goldman Sachs, refining margins, aka crack spreads, across different regions around the globe are still way off their norms, portending continuing weak global demand for distillates.

U.S. crack spreads clocked in at a mere $9/bbl last week, compared to $21 at the same time last year according to Reuters, while crack spreads for European diesel dropped to a record low of $2.90.

Crack spreads are a good proxy for oil demand with falling spreads a sign of weak demand and vice-versa. The badly squeezed margins for refiners is a worrying sign that global demand remains way below normal levels, with the ongoing pick-up in crude prices only serving to worsen the margin contraction for the likes of Valero Energy Corp. (NYSE:VLO), Marathon Petroleum Corp. (NYSE:MPC) and Phillips 66 (NYSE: PSX). WTI and Brent prices have staged a strong rally over the past few weeks after production cuts by OPEC+ and independent producers in the U.S. and elsewhere helped ease a huge supply glut and storage buildup. On Saturday, OPEC and its allies agreed to extend the cuts by an additional month with plans to review progress on a monthly basis. Global oil demand particularly in the giant markets of China and India appears to be recovering at a faster-than-expected clip, with crude imports in China surging 13% in May to a record 11.3 million barrels per day and demand back to 90% of pre-crisis levels. Meanwhile, May sales in India were recorded at ~76% of normal levels while U.S. gasoline demand has seen a 7% uptick during the final week of May to clock in at 75% of pre-COVID-19 levels.

But analysts are now questioning whether the rebound in demand is the result of rising consumption or simply the result of refiners and traders stocking up on cheap crude.

ING’s Patterson and Ehsan Khoman at Japanese bank MUFG say the surge in demand could partly be the result of opportunistic buying by refiners. Consequently, Goldman has predicted that Brent prices will pull back to $35 per barrel in the coming weeks from a recent high of $43.

And they could be right.

According to Bloomberg, the United States’ largest refiner by capacity, Valero Energy, is currently running its two crude units at just 58% of their maximum rate of 424K bbl/day due to low demand and storage filling up. The refinery’s fluid catalytic converter as well as all the hydrotreaters except the distillate hydrotreaters are running at minimum rates while rates on the coker have also been lowered.

In a previous article, we reported that giant oil traders have been storing millions of barrels of crude in the seas with a view to selling when prices improve in the coming months, which could also be driving the surge in demand.

Takeaway

At this juncture, it’s best for investors to adopt an attitude of cautious optimism. On one hand, the bulls argue that OPEC+ has curtailed production too fast, with some oil executives eyeing the seemingly untouchable WTI prices of $70 in the current year.

On the other hand, poor refining margins are telling a different story while oil prices have, worryingly, been strongly pulling back from recent highs on fears that increased production by U.S. shale producers and Libya will offset the OPEC+ cuts.

As many analysts have pointed out, the biggest wild card in this market remains the speed at which demand is going to bounce back in the coming months.

The current evidence though appears to lend support to the bull camp.

Link to original article: https://oilprice.com/Energy/Energy-General/Bulls-Beware-A-Dark-Cloud-Is-Forming-Over-Oil-Markets.html

By Alex Kimani for Oilprice.com


Markets mixed after Thursday selloff

By IFCMarkets

Top daily news

Global stocks are mixed today after a sell off on Thursday as markets were spooked by Fed chair Powell’s warning US faces ‘long road’ to recovery. Positive data like rising producer prices and another decline in initial jobless claims weren’t sufficient to offset the damage to investor confidence caused by Fed’s dour outlook on recovery.

Forex news

Currency PairChange
EUR USD-0.1%
USD JPY+0.33%
USD CHF-0.01%
The Dollar strengthening halted today ahead of University of Michigan consumer sentiment report. The live dollar index data show the ICE US Dollar index, a measure of the dollar’s strength against a basket of six rival currencies, jumped 0.7% Thursday after reports initial jobless claims rose below-expected 1.54 million last week while producer prices recorded first increase in four months in May. Both GBP/USD and EUR/USD reversed their climbing yesterday but both are higher currently. AUD/USD joined USD/JPY’s continued sliding yesterday with both pairs higher currently.

Stock Market news

IndicesChange
Dow Jones Index+0.85%
Nikkei Index-1.63%
GB 100 Index+1.42%
Australian Stock Index+0.92%
Futures on three main US stock indexes are retracing higher currently after a plunge Thursday led by energy shares. The three main US stock indexes recorded losses ranging from 5.3% to 6.9%. European stock indexes are rebounding today after ending sharply lower Thursday led by auto stocks. Asian indexes are mostly lower today led by Australia’s All Ordinaries ASX 200 Index.

Commodity Market news

CommoditiesChange
Brent Crude Oil-0.11%
WTI Crude-1.74%
Brent is extending losses today. Oil prices sank yesterday after Energy Information Administration report Wednesday that US crude inventories rose by 5.7 million barrels. The US oil benchmark West Texas Intermediate (WTI) futures ended solidly lower yesterday: July WTI tumbled 8.2% and is lower currently. August Brent crude closed 7.6% lower at $38.55 a barrel on Thursday.

Gold Market News

MetalsChange
Gold-0.38%
Gold prices are edging lower today . August rose 1.1% to $1739.80 an ounce on Thursday.

Market Analysis provided by IFCMarkets

Note:
This overview has an informative and tutorial character and is published for free. All the data, included in the overview, are received from public sources, recognized as more or less reliable. Moreover, there is no guarantee that the indicated information is full and precise. Overviews are not updated. The whole information in each overview, including opinion, indicators, charts and anything else, is provided only for familiarization purposes and is not financial advice or а recommendation. The whole text and its any part, as well as the charts cannot be considered as an offer to make a deal with any asset. IFC Markets and its employees under any circumstances are not liable for any action taken by someone else during or after reading the overview.