The US Currency Is in the Positive Zone

by JustForex

Since the end of last week, the US dollar has been growing against a basket of currency majors. The US dollar index (#DX) closed in the positive zone (+0.59%). Demand for risky assets has significantly weakened amid investors’ concerns about a possible second wave of coronavirus. In the United States, the incidence rate for COVID-19 has reached 2 million. Financial market participants are worried that the second wave of the virus could do even more harm to the global economy.

The British authorities officially announced that they would not seek an extension of the Brexit transition period and would complete the country’s exit from the EU on January 1, 2021. On January 1, 2021, the British authorities will regain control of the country, as well as political and economic independence. British Prime Minister Boris Johnson has repeatedly stated that he did not intend to extend negotiations on further relations between the EU and the UK, even despite the coronavirus, which complicates many processes and the country’s economic situation.

The “black gold” prices have continued to decline. Currently, futures for the WTI crude oil are testing the $35.65 mark per barrel.

Market indicators

On Friday, there was the bullish sentiment in the US stock market: #SPY (+1.20%), #DIA (+1.87%), #QQQ (+0.79%).

The 10-year US government bonds yield has been growing. At the moment, the indicator is at the level of 0.67-0.68%.

The news feed on 2020.06.15:
  • Today, the publication of important economic data is not expected. We recommend paying attention to the speeches by FOMC representatives.

by JustForex

The Analytical Overview of the Main Currency Pairs on 2020.06.15

by JustForex

The EUR/USD currency pair

Technical indicators of the currency pair:
  • Prev Open: 1.12912
  • Open: 1.12342
  • % chg. over the last day: -0.38
  • Day’s range: 1.12263 – 1.12684
  • 52 wk range: 1.0777 – 1.1494

Sales prevail on the EUR/USD currency pair. The trading instrument has updated local lows. Demand for risky assets continues to weaken. Financial market participants are concerned about the second outbreak of coronavirus. Investors expect a speech by the Fed Chairman, which will be held tomorrow. Jerome Powell should report for the half year on the monetary policy of the Central Bank and announce economic forecasts. Currently, EUR/USD quotes are consolidating in the range of 1.1220-1.1275. The single currency has a potential for further decline. Positions should be opened from key levels.

The Economic News Feed for 2020.06.15:
  • – Eurozone trade balance at 12:00 (GMT+3:00).

We also recommend paying attention to the speeches of FOMC representatives.

EUR/USD

Indicators do not give accurate signals: 50 MA has crossed 100 MA.

The MACD histogram is in the negative zone, but above the signal line, which gives a weak signal to sell EUR/USD.

Stochastic Oscillator is in the neutral zone, the %K line has crossed the %D line. There are no signals at the moment.

Trading recommendations
  • Support levels: 1.1220, 1.1190, 1.1115
  • Resistance levels: 1.1275, 1.1325, 1.1380

If the price fixes below the level of 1.1220, a further fall in EUR/USD quotes is expected. The movement is tending to 1.1180-1.1150.

An alternative could be the growth of the EUR/USD currency pair to 1.1320-1.1350.

The GBP/USD currency pair

Technical indicators of the currency pair:
  • Prev Open: 1.26000
  • Open: 1.25091
  • % chg. over the last day: -0.48
  • Day’s range: 1.24541 – 1.25480
  • 52 wk range: 1.1466 – 1.3516

There is the bearish sentiment on the GBP/USD currency pair. The British pound has updated local lows. Currently, GBP/USD quotes are consolidating. The key range is 1.2460-1.2550. The demand for risky assets is still low. The British pound is under pressure due to a weak report on UK GDP. Investors expect a meeting of the Bank of England, which will be held later this week. A further decline in the trading instrument is possible. We recommend opening positions from key levels.

GBP/USD

Indicators signal the power of sellers: the price has fixed below 50 MA and 100 MA.

The MACD histogram is in the negative zone, but above the signal line, which gives a weak signal to sell GBP/USD.

Stochastic Oscillator is in the neutral zone, the %K line has crossed the %D line. There are no signals at the moment.

Trading recommendations
  • Support levels: 1.2460, 1.2400
  • Resistance levels: 1.2550, 1.26150, 1.2650

If the price fixes below 1.2460, a further fall in GBP/USD quotes is expected. The movement is tending to the round level of 1.2400.

An alternative could be the growth of the GBP/USD currency pair to 1.2600-1.2640.

The USD/CAD currency pair

Technical indicators of the currency pair:
  • Prev Open: 1.36242
  • Open: 1.36012
  • % chg. over the last day: -0.30
  • Day’s range: 1.35993 – 1.36860
  • 52 wk range: 1.2949 – 1.4668

USD/CAD quotes have become stable after a significant increase at the end of last week. The loonie is currently consolidating. The technical pattern is ambiguous. The key range is 1.3600-1.3680. Financial market participants expect additional drivers. We recommend paying attention to the dynamics of oil quotes. Positions should be opened from key levels.

Today, the publication of important economic releases from Canada is not expected.

USD/CAD

Indicators signal the power of buyers: the price has fixed above 50 MA and 100 MA.

The MACD histogram is in the positive zone, indicating the bullish sentiment.

Stochastic Oscillator is in the overbought zone, the %K line has crossed the %D line. There are no signals at the moment.

Trading recommendations
  • Support levels: 1.3600, 1.3530, 1.3480
  • Resistance levels: 1.3680, 1.3750

If the price fixes above 1.3680, further growth of USD/CAD quotes is expected. The movement is tending to 1.3740-1.3760.

An alternative could be a decrease in the USD/CAD currency pair to 1.3550-1.3520.

The USD/JPY currency pair

Technical indicators of the currency pair:
  • Prev Open: 106.880
  • Open: 107.316
  • % chg. over the last day: +0.46
  • Day’s range: 106.998 – 107.566
  • 52 wk range: 101.19 – 112.41

The USD/JPY currency pair has become stable. The trading instrument is currently consolidating. There is no defined trend. The trading instrument is testing local support and resistance levels: 107.00 and 107.55, respectively. The technical pattern signals a possible correction of USD/JPY quotes. We recommend paying attention to the dynamics of US government bonds yield. Positions should be opened from key levels.

The news feed on Japan’s economy is calm.

USD/JPY

Indicators do not give accurate signals: the price has fixed between 50 MA and 100 MA.

The MACD histogram is near the 0 mark.

Stochastic Oscillator is in the neutral zone, the %K line has crossed the %D line. There are no signals at the moment.

Trading recommendations
  • Support levels: 107.00, 106.60
  • Resistance levels: 107.55, 107.90, 108.25

If the price fixes above 107.55, further growth of USD/JPY quotes is expected. The movement is tending to 107.90-108.20.

An alternative could be a decrease in the USD/JPY currency pair to 106.60-106.40.

by JustForex

DAX30 bears in charge of the price action again, 12,000 in focus

By Admiral Markets

Source: Economic Events June 15, 2020 – Admiral Markets’ Forex Calendar

Up to the Fed rate decision on Wednesday, the DAX had been losing some of the bullish momentum it has had since it took off in Mid-May, where it gained more than 25% from its lows in less than a month, until it found resistance around 12,900 points.

On Thursday, the tide turned and the German index dropped more than 5%, back below 12,000 points, and struggled to close the week of trading above this psychological relevant threshold.

What became clear in our opinion is, that despite Wednesday’s ‘Equity-friendly’ rhetoric from the Fed (which can be interpreted as ‘ultra-dovish’ as it keeps interest rates at 0% at least till the end of 2022, continuing to buy USTs and MBS at least at the current pace of ~80b USD/month), market participants expect more, with much of the Fed dovishness was already priced into the market.

That said, even with the German index making back some of its losses from Thursday on Friday, the risk of another sharper drop in the days to come seems quite high with the risk-reward-ratio becoming more attractive on the Short-side.

A stronger zone of resistance can be found around 12,300/350 points, the former trend-support.

A drop below 11,800 respectively the pre-weekly lows around 11,700 points can realistically trigger a next wave lower and activates the region around 11,450/500 as a potential target on the downside:
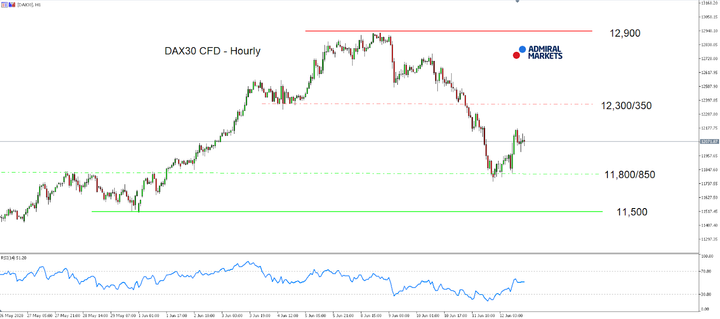
Source: Admiral Markets MT5 with MT5-SE Add-on DAX30 CFD Hourly chart (between May 26, 2020, to June 12, 2020). Accessed: June 12, 2020, at 10:00pm GMT
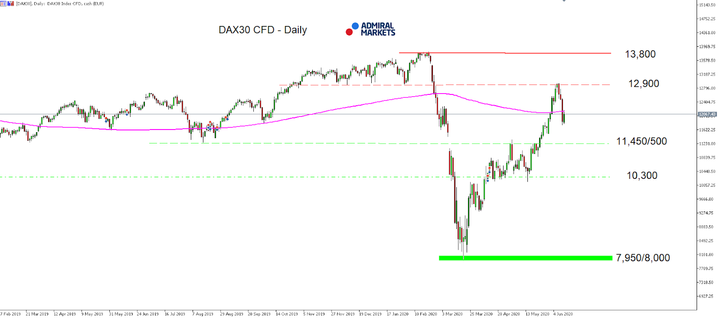
Source: Admiral Markets MT5 with MT5-SE Add-on DAX30 CFD Daily chart (between February 27, 2019, to June 12, 2020). Accessed: June 12, 2020, at 10:00pm GMT – Please note: Past performance is not a reliable indicator of future results, or future performance.

In 2015, the value of the DAX30 CFD increased by 9.56%, in 2016, it increased by 6.87%, in 2017, it increased by 12.51%, in 2018, it fell by 18.26%, in 2019, it increased by 26.44% meaning that after five years, it was up by 34.2%.

Discover the world’s #1 multi-asset platform

Admiral Markets offers professional traders the ability to trade with a custom, upgraded version of MetaTrader 5, allowing you to experience trading at a significantly higher, more rewarding level. Experience benefits such as the addition of the Market Heat Map, so you can compare various currency pairs to see which ones might be lucrative investments, access real-time trading data, and so much more. Click the banner below to start your FREE download of MT5 Supreme Edition!

Download MetaTrader 5 and begin trading today!

Disclaimer: The given data provides additional information regarding all analysis, estimates, prognosis, forecasts or other similar assessments or information (hereinafter “Analysis”) published on the website of Admiral Markets. Before making any investment decisions please pay close attention to the following:

  1. This is a marketing communication. The analysis is published for informative purposes only and are in no way to be construed as investment advice or recommendation. It has not been prepared in accordance with legal requirements designed to promote the independence of investment research, and that it is not subject to any prohibition on dealing ahead of the dissemination of investment research.
  2. Any investment decision is made by each client alone whereas Admiral Markets shall not be responsible for any loss or damage arising from any such decision, whether or not based on the Analysis.
  3. Each of the Analysis is prepared by an independent analyst (Jens Klatt, Professional Trader and Analyst, hereinafter “Author”) based on the Author’s personal estimations.
  4. To ensure that the interests of the clients would be protected and objectivity of the Analysis would not be damaged Admiral Markets has established relevant internal procedures for prevention and management of conflicts of interest.
  5. Whilst every reasonable effort is taken to ensure that all sources of the Analysis are reliable and that all information is presented, as much as possible, in an understandable, timely, precise and complete manner, Admiral Markets does not guarantee the accuracy or completeness of any information contained within the Analysis. The presented figures refer that refer to any past performance is not a reliable indicator of future results.
  6. The contents of the Analysis should not be construed as an express or implied promise, guarantee or implication by Admiral Markets that the client shall profit from the strategies therein or that losses in connection therewith may or shall be limited.
  7. Any kind of previous or modeled performance of financial instruments indicated within the Publication should not be construed as an express or implied promise, guarantee or implication by Admiral Markets for any future performance. The value of the financial instrument may both increase and decrease and the preservation of the asset value is not guaranteed.
  8. The projections included in the Analysis may be subject to additional fees, taxes or other charges, depending on the subject of the Publication. The price list applicable to the services provided by Admiral Markets is publicly available from the website of Admiral Markets.

Leveraged products (including contracts for difference) are speculative in nature and may result in losses or profit. Before you start trading, you should make sure that you understand all the risks

By Admiral Markets

Volatility returns with surge in new Covid-19 cases

By Hussein Sayed, Chief Market Strategist (Gulf & MENA), ForexTime

Risk assets are being sold off sharply early Monday following last week’s return of volatility. After dropping below 24 in the first week of June, the CBOE’s VIX almost doubled on Friday, reaching a high of 44 before settling at 36. The broad shift in mood was sudden on Thursday with US stocks experiencing their biggest declines since mid-March. The rally, driven by monetary and fiscal stimulus, suddenly appeared on shaky grounds as if investors realised they can no longer be detached much further from economic fundamentals. But once again, the surge in Covid-19 cases was to blame.

The road ahead is likely to be bumpy. There is no clarity on economic growth projections, earnings expectations and most importantly, the pandemic path. The resurgence of coronavirus cases in Beijing, parts of the US and Japan as economies further release their lockdowns is sparking fears of a second wave, and without a vaccine in hand, the second wave could be more threatening than the first.

At the time of writing, the Dow Jones Industrial Futures Index has plunged more than 800 points, indicating sharp losses for the first trading session of the week. The beneficiaries, as usual, have been the US dollar and the Japanese Yen along with US Treasuries. It seems investors are running for safety as the tranquility in markets has come to an end.

Fear of missing out or ‘FOMO’ could turn into regret aversion where investors prefer to stay out of markets, so it will be interesting to monitor sentiment in the days and weeks ahead. Cyclical sectors, especially Energy, Industrial and Financial stocks will be hit the most as they were the latest drivers of the equity rally.

Traders will need to monitor the term ’second wave’ very closely as it may become the key driver for asset classes.

Disclaimer: The content in this article comprises personal opinions and should not be construed as containing personal and/or other investment advice and/or an offer of and/or solicitation for any transactions in financial instruments and/or a guarantee and/or prediction of future performance. ForexTime (FXTM), its affiliates, agents, directors, officers or employees do not guarantee the accuracy, validity, timeliness or completeness, of any information or data made available and assume no liability as to any loss arising from any investment based on the same.


Forex-Time-LogoArticle by ForexTime

ForexTime Ltd (FXTM) is an award winning international online forex broker regulated by CySEC 185/12 www.forextime.com

The different types of Forex Charts and How Do they work

The Forex chart is an image that reflects a change in price. Without charts, you won’t have any clue about the market.

Analysis of market data on charts is also called technical analysis in forex.

How do Forex charts work?

Charts are plotted in a rectangular system of two coordinates. Time is plotted on the horizontal x-axis, while price, volume, and tick chart are shown on the vertical y-axis.

The period corresponding to a unit interval on the x-axis or depends on the degree of compression of market data. On the tick chart, each change in the exchange rate is displayed. This is the smallest timeframe.

Tick ​​information about transactions is not always available and is not necessary. Therefore, generalized and concise price history for a certain period is most often used.

For any period (minutes, hours, days, weeks, etc.) there are four main values ​​of the exchange rate:

  • Opening price (Open, O) – the first price of the period
  • Maximum price (High, H) – the highest price for the period
  • Minimum price (Low, L) – the lowest price for the period
  • Close Price (Close, C) – the last price of the period

One price value of a period or all four at a time can be plotted on a chart.

At each point, the exchange rate on the Forex market is presented in the form of a bid/ask quote. The chart can be built on both of these prices and on their average value ([Bid + Ask] /2.) If the chart is based on the bid price, then the ask price is not displayed, and vice versa.

Modern trading platforms allow you to receive market data in real-time and build different graphs on their basis.

Types of Forex charts

The main types of Forex charts are:

Line chart

A line chart is a straightforward method for displaying price movements. It displays information on a single line using a series of dots.

Line chart

Bar chart

The bar chart provides instant information on price movements for a specified period. Bar charts are often used to track market volatility; the longer the bars, the greater the market volatility. It offers more information than a line chart.

Bar chart

Japanese Candlesticks

Japanese candlestick charts are very useful graphs that describe the movement of the price of any trading instrument. They can provide helpful information, such as market sentiment or possible trend changes using specific patterns.

Candlestick charts provide information on four key elements in the period under review:

  • Open price
  • Close price
  • High price
  • Low price

In the forex market, candlestick charts are often used for technical analysis of currency pairs.

Here, we should mention that Japanese candlesticks have multiple patterns like doji, morning star, three crows, hanging man and hammer, and many others.

Candlestick chart

Where to find Forex charts?

The fastest and easiest way to get free Forex charts is to download a trading platform (MT4, MT5) or log in to webtrader. Tools for technical analysis and forecasts will also be available to you.

Other types of charts are Hieken Ashi, Renko, point & figure, HLC, hollow candles, etc.

Source of content and images: Some of the facts and images have been picked from FXCC’s article How to read Forex charts and Wikipedia Chart pattern.


This week in monetary policy: Honduras, Japan, Armenia, Poland, Morocco, Chile, Namibia, Brazil, Mozambique, Taiwan, Indonesia, Norway, Switzerland, UK, Botswana, Russia, Azerbaijan & Mongolia

By CentralBankNews.info

    This week – June 15 through June 20 – central banks from 18 countries or jurisdictions are scheduled to decide on monetary policy: Honduras, Japan, Armenia, Poland, Morocco, Chile, Namibia, Brazil, Mozambique, Taiwan, Indonesia, Norway, Switzerland, United Kingdom, Botswana, Russia, Azerbaijan and Mongolia.
    Following table includes the name of the country, the date of the next policy decision, the current policy rate, the result of the last policy decision, the change in the policy rate year to date, and the rate one year ago.
    The table is updated when the latest decisions are announced and can always accessed by clicking on This Week.
 
WEEK 25
JUN 15 – JUN 20, 2020:
HONDURAS15-Jun4.50%0-1005.75%         FM
JAPAN16-Jun-0.10%00-0.10%         DM
ARMENIA16-Jun5.00%-25-505.75%
POLAND16-Jun0.10%-40-1401.50%         EM
MOROCCO16-Jun2.00%0-252.25%         FM
CHILE16-Jun0.50%0-1252.50%         EM
NAMIBIA17-Jun4.25%-100-2256.75%
BRAZIL17-Jun3.00%-75-1506.50%         EM
MOZAMBIQUE17-Jun11.25%-150-15013.25%
TAIWAN18-Jun1.125%-25-251.375%         EM
INDONESIA18-Jun4.50%0-506.00%         EM
NORWAY18-Jun0.00%-25-1501.25%         DM
SWITZERLAND18-Jun-0.75%00-0.75%         DM
UNITED KINGDOM18-Jun0.10%0-650.75%         DM
BOTSWANA18-Jun4.25%-50-505.00%
RUSSIA19-Jun5.50%-50-757.50%         EM
AZERBAIJAN19-Jun7.25%0-258.50%
MONGOLIA19-Jun9.00%-100-20011.00%


Second Covid-19 wave could push Gold to $1800

By Han Tan, Market Analyst, ForexTime

Gold prices are edging about 0.1 percent higher today, as global investors monitor the latest developments surrounding the coronavirus pandemic. There’s a climb in Covid-19 cases in 20 US states, while the number of cases in Tokyo also reported a rise over the weekend, highlighting the fact that the coronavirus is not easily vanquished.

Should markets get the sense that another round of lockdowns in major economies is drawing nigh, that may derail the optimism surrounding a rapid economic recovery and spur further gains in safe havens.

Note that on both the daily chart as well as the weekly timeframe, Bullion’s upwards trend seems to have plateaued around the mid-$1700 range. Gold bulls clearly benefitted for the two months since March when much of the global economy was placed on a lockdown, which in turn triggered a deep worldwide recession. However, since May, Gold has been unable to continue posting higher highs and higher lows, as the optimism surrounding the reopening of many major economies has kept Gold to a sideways pattern.

Still, the lingering fears in the markets appears to be keeping the $1670 support level mostly intact, perhaps providing the platform for Gold’s next big push higher.

The precious metal is just about two weeks away from registering its 7th consecutive quarterly gain, a run that stretches back to Q4 2018. This is the longest such streak since the 2008-2011 Gold bull run, with prices climbing for 12 consecutive quarters. That stretch also included the record high of $1920.60, a record that still stands till this day.

It’s amidst such tense market environments that Gold tends to shine. Bullion has already seen tailwinds from US interest rates falling to near-zero, coupled with the overall risk aversion from the global pandemic. However, the US Dollar’s resilience has hampered Gold’s ability to surge even higher.

Should signs of a second wave of Covid-19 cases worldwide become more prominent, that could be the catalyst for Gold prices reaching the psychologically-important $1800 level for the first time since 2012.

Disclaimer: The content in this article comprises personal opinions and should not be construed as containing personal and/or other investment advice and/or an offer of and/or solicitation for any transactions in financial instruments and/or a guarantee and/or prediction of future performance. ForexTime (FXTM), its affiliates, agents, directors, officers or employees do not guarantee the accuracy, validity, timeliness or completeness, of any information or data made available and assume no liability as to any loss arising from any investment based on the same.


Forex-Time-LogoArticle by ForexTime

ForexTime Ltd (FXTM) is an award winning international online forex broker regulated by CySEC 185/12 www.forextime.com

USDJPY Analysis: Japan’s industrial production downgrade bullish for USDJPY

By IFCMarkets

Japan’s industrial production downgrade bullish for USDJPY

Japan’s industrial production for April was downgraded: the final estimate was downgraded to -9.8% from -9.1% of preliminary estimate, following a 3.7% decline in March. This is bullish for USDJPY.

IndicatorVALUESignal
RSINeutral
MACDBuy
Donchian ChannelBuy
MA(200)Sell
FractalsBuy
Parabolic SARBuy


Summary of technical analysis

OrderBuy
Buy stopAbove 107.55
Stop lossBelow 106.77

Market Analysis provided by IFCMarkets

Week in review: Dollar, Euro, Pound & Gold in focus

By Lukman Otunuga, Research Analyst, ForexTime

This has been a rollercoaster trading week defined by volatile stock markets, dollar weakness, coronavirus-relate concerns and shaky Oil prices among many other themes.

Earlier in the week, market optimism over the world economy recovering quicker than initially anticipated weakened the Dollar with a dovish Federal Reserve rubbing salt into the wound. However, the unwelcome return of coronavirus related fears has sparked risk aversion – ultimately rekindling appetite for the world’s reserve currency.

Looking at the charts, the Dollar Index (DXY) remains in a downtrend on the daily charts with prices trading around 96.75 as of writing. Given how the Index is trading below the 20 Simple Moving Average and Moving Average Convergence Divergence (MACD) is pointing to the downside, the path of least resistance is south. For as long as prices are able to keep below 97.15, the next key levels of interest will be around 96.25 and 95.00.

Alternatively, a breakout above 97.15 may open the doors back towards 97.80.

EURUSD trapped within new range?

The past few days were quite choppy for the EURUSD as prices bounced within a 150 pip range with support at 1.1250 and resistance around 1.1400.

After hitting a fresh multi-month high above 1.14 mid-week, prices later tumbled back below 1.13 thanks to an appreciating Dollar.

Focusing on the technical picture, the party could be over for bulls if the 1.1250 support level is breached. The currency pair is already trading below the 20 Simple Moving Average on the H4 timeframe while the MACD has also crossed to the downside. A solid close below 1.1250 may signify the start of a bearish trend for the EURUSD.

On the daily charts, there is still some scope for prices to push higher but this will depend on whether 1.1360 gives way. A strong close above this level could trigger a move back towards 1.1420.

GBPUSD back below 1.2600.

Over the past three days, Sterling has dropped more than 250 pips against the Dollar with prices trading around 1.2570 as of writing. If the Dollar continues to appreciate, prices may sink towards 1.2500 in the week ahead.

If prices are able to break below 1.2500, the next key level of interest will be around 1.2350.

1.2500 could prove to be reliable support which could trigger a rebound back towards 1.2650.

Gold sparkles on coronavirus fears

Gold sparkled on Friday as renewed fears over a second coronavirus wave threatening global economic growth and stability magnetized investors to safe-haven destinations.

The metal has jumped over 0.6% today amid the risk-off and is on route to concluding the week almost 3% higher thanks to the mounting sense of unease. While Gold has the potential to push higher next week, an appreciating Dollar could put limit gains in the medium term.

In regards to the technical picture, a breakout above $1747 may open doors towards $1765. Should $1747 prove to be reliable resistance, prices may sink back towards $1720.

Commodity spotlight – Oil

Oil prices are likely to remain vulnerable and exposed to downside shocks thanks to coronavirus-related concerns.

The possibility of renewed lockdowns and delayed global economic recovery is bad news for Oil which remains one of the biggest causalities of the coronavirus menace. Although OPEC+ have agreed to extend production cuts by another month, in the grand scheme of things this may offer little support to Oil which remains in a losing battle with COVID-19 and world growth fears.

WTI Crude may sink towards $30 in the short to medium term after failing to clear the $40 resistance level.

Disclaimer: The content in this article comprises personal opinions and should not be construed as containing personal and/or other investment advice and/or an offer of and/or solicitation for any transactions in financial instruments and/or a guarantee and/or prediction of future performance. ForexTime (FXTM), its affiliates, agents, directors, officers or employees do not guarantee the accuracy, validity, timeliness or completeness, of any information or data made available and assume no liability as to any loss arising from any investment based on the same.


Forex-Time-LogoArticle by ForexTime

ForexTime Ltd (FXTM) is an award winning international online forex broker regulated by CySEC 185/12 www.forextime.com

Hertz, Tullow Oil, Northern Star & Rice Futures lead Weekly Top Gainers/Losers

By IFCMarkets

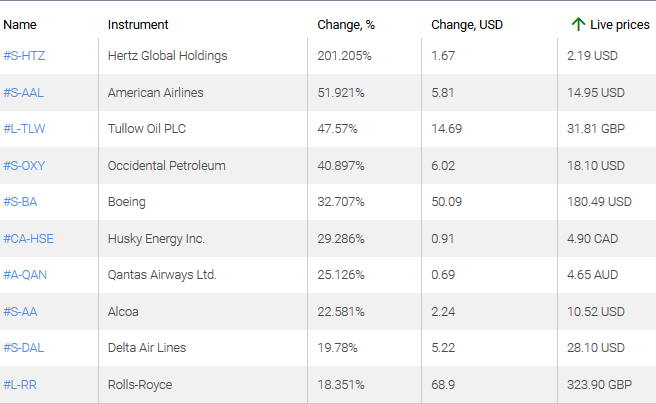
Top Gainers – The World Market

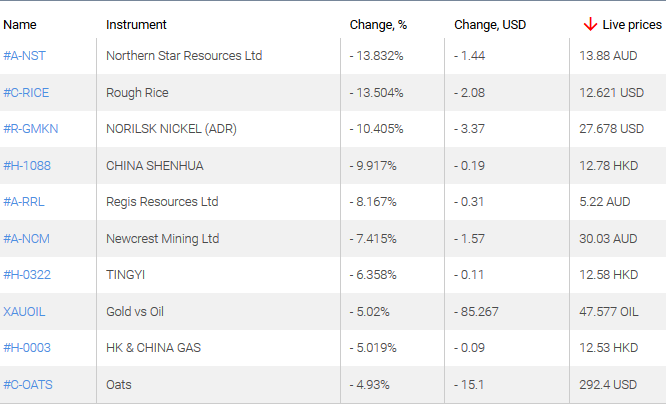
The markets returned to their normal state. The US dollar continued to fall during the last 7 days, but gold quotes rose. Accordingly, the stocks of the gold mining company, the euro currencies of exporting countries became the Top Gainers while the currency pairs based on the dollar were among the Top Losers.

1.Hertz Global Holdings, 201.205% – an American car rental company.

2.Tullow Oil PLC, 47.57% – a British oil company.

market sentiment ratio long short positions

 Top Losers – The World Market

1. Northern Star Resources Ltd – an Australian gold mining company.

2. Rice – continuous CFD on rice.

market sentiment ratio long short positions

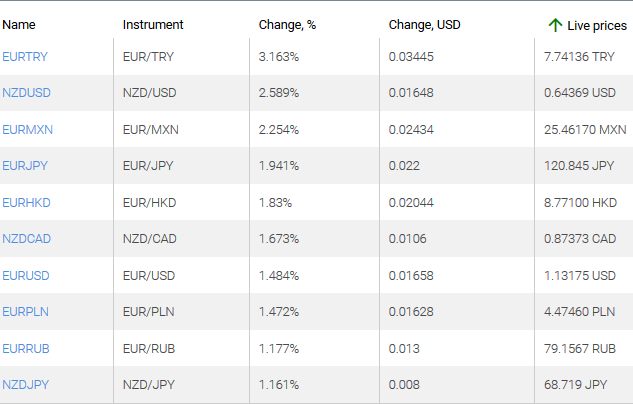
 Top Gainers – Foreign Exchange Market (Forex)

1. EURTRY, NZDUSD – the growth of these charts means the strengthening of the euro and the New Zealand dollar against the Turkish lira and the US dollar.

2. EURMXN, EURJPY – the growth of these charts means the strengthening of the euro against the Mexican peso and the Japanese yen.

market sentiment ratio long short positions

 Top Losers – Foreign Exchange Market (Forex)

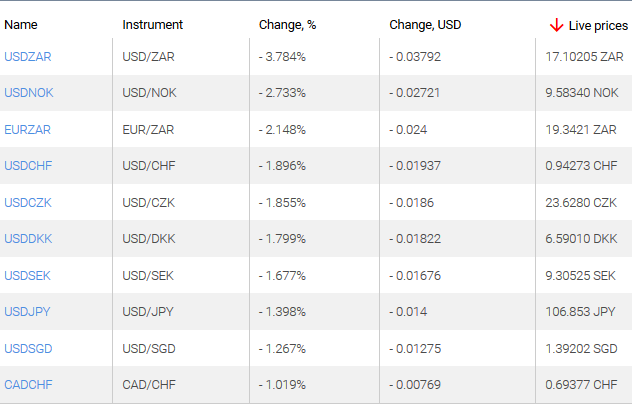
1. USDNOK, USDCHF – the drop of these charts means the strengthening of the Norwegian krone and the Swiss franc against the US dollar.

2. USDZAR, EURZAR – the drop of these charts means the weakening of the US dollar and the euro against the South African rand.

market sentiment ratio long short positions

Market Analysis provided by IFCMarkets

Note:
This overview has an informative and tutorial character and is published for free. All the data, included in the overview, are received from public sources, recognized as more or less reliable. Moreover, there is no guarantee that the indicated information is full and precise. Overviews are not updated. The whole information in each overview, including opinion, indicators, charts and anything else, is provided only for familiarization purposes and is not financial advice or а recommendation. The whole text and its any part, as well as the charts cannot be considered as an offer to make a deal with any asset. IFC Markets and its employees under any circumstances are not liable for any action taken by someone else during or after reading the overview.