Markets Taking The ‘Glass Half-Full’ Approach

By Lukman Otunuga, Research Analyst, ForexTime

For a third day in a row, global markets remain generally upbeat on the whole, although US stocks have creeped into the red after opening up in positive territory. Traders are shrugging off concerns about rising coronavirus cases and that much of Beijing is once again under lockdown.

Geopolitical tensions have popped up round the globe but in a world where only central bank liquidity matters, these concerns have been quickly forgotten. Sentiment has also been boosted after a cheap steroid, normally used to reduce inflammation in other diseases, was found to reduce death rates by around a third among the most severely illCovid-19 patients admitted to hospital.

The Dollar is up against the Euro for a second day as focus turn to the EU leader’s summit taking place on Friday. There have been reports that Chancellor Merkel does not expect an agreement to be reached on the EU’s proposed Recovery Fund and the future EU budget. She expects a decision to be made at the July summit.

AUD Bullish trend channel

The Aussie is currently consolidating near the recent cycle highs just below 0.70. The trend channel from late-March is still in play with a series of higher highs and higher lows.

The market looks likely to print an ‘inside day’ today, which highlights the contraction in volatility. However, this is a continuation pattern so unless we move below Monday’s low at 0.6776, prices are expected to move higher once more and make another attempt on 0.70.

USD/CAD weak below breakout level

Last week’s retrace of the June 1st breakdown below the 1.3730 zone has not managed to reclaim that level. Gains have been capped at the 21-day MA so far, which should point to more pressure on the 1.35 area where the 200-day MA resides.

If the bears get the upper hand, selling is expected to pick up sharply below here and head for the recent lows around 1.33. Buyers need to recover that 1.3730 zone to arrest the downtrend.

Disclaimer: The content in this article comprises personal opinions and should not be construed as containing personal and/or other investment advice and/or an offer of and/or solicitation for any transactions in financial instruments and/or a guarantee and/or prediction of future performance. ForexTime (FXTM), its affiliates, agents, directors, officers or employees do not guarantee the accuracy, validity, timeliness or completeness, of any information or data made available and assume no liability as to any loss arising from any investment based on the same.


Forex-Time-LogoArticle by ForexTime

ForexTime Ltd (FXTM) is an award winning international online forex broker regulated by CySEC 185/12 www.forextime.com

Demand for Risky Assets Has Weakened Again. World Economic Recovery Is in Doubt

by JustForex

The US dollar is being traded in different directions against a basket of currency majors despite optimistic economic data. Thus, core retail sales index (m/m) grew by 12.4% in May instead of the forecasted growth by 5.5%. Retail sales (m/m) increased by 17.7% in May instead of 8.0%. At the same time, the Fed Chairman made ivestors upset with a statement that markets are unlikely to count on a quick recovery of the US and world economy.

Financial market participants are concerned about the second wave of the COVID-19 epidemic. The Chinese government is fighting a second outbreak of coronavirus. Today schools in Beijing were closed and an emergency was introduced in the city. Tensions between North and South Korea also increase after North Korea blew up a joint post office on Tuesday and threatened to send troops into the demilitarized zone.

The “black gold” prices have been declining. Currently, futures for the WTI crude oil are testing the $37.75 mark per barrel. At 17:30 (GMT+3:00), US crude oil inventories will be published.

Market indicators

Yesterday, there was the bullish sentiment in the US stock market: #SPY (+1.92%), #DIA (+2.12%), #QQQ (+1.72%).

The 10-year US government bonds yield is growing. At the moment, the indicator is at the level of 0.75-0.76%.

The news feed on 2020.06.17:
  • – UK consumer price index at 09:00 (GMT+3:00);
  • – Eurozone consumer price index at 12:00 (GMT+3:00);
  • – Statistics on the real estate market in the US at 15:30 (GMT+3:00);
  • – Inflation report in Canada at 15:30 (GMT+3:00).

by JustForex

WHO announces the effectiveness of a new drug against coronavirus

By IFCMarkets

Top daily news

The WHO Director-General has announced the first effective medicine against Covid-19. In the US, Britain, and the EU, improved economic data came out yesterday and this morning. This reduced global risks and contributed to the growth of global stock indices, supported oil quotes and the US dollar index, and also weakened precious metals quotes. Investors are watching the border conflict between India and China. Its further escalation can adversely affect market dynamics.

Forex news

Currency PairChange
EUR USD-0.28%
GBP USD-0.25%
USD JPY+0.06%
On Tuesday, the US dollar index rose markedly thanks to excellent retail sales data for May. They increased by 17.7% compared to April figures. Annual retail sales still fell by 6.1%. Yesterday, the Industrial Production economic indicator was also released, which proved to be positive. The US Fed Chairman Jerome Powell announced the full recovery of the US economy would occur when the coronavirus epidemic was taken under control. This morning, WHO Director-General Tedros Adhanom Ghebreyesus announced the first effective Covid-19 drug called Dexamethasone (developed in Britain). The British pound today continued to strengthen for the second day in a row thanks to good May inflation data, which dropped to a 4-year low and amounted to 0.5% in annual terms. Tonight, data on the real estate market and construction will be published in the US, and inflation data – in Canada.

Stock Market news

IndicesChange
Dow Jones Index+2%
S&P 500+1.91%
Nasdaq 100+1.8%
Nikkei Index-0.56%
Australian Stock Index+0.83%

On Tuesday, the US stock market experienced growth of quotations. Industrials, Oil & Gas, and Healthcare turned out to be the leading sectors in the S&P 500. The main positive factors were the same ones mentioned in the “Forex news” section: good retail sales data and the development of a new medicine against coronavirus. The launch of the Fed’s corporate debt buy-back program was additional factor in the growth of stock indices. European stock indices are now up for the third day in a row thanks to the positive data on the recovery of the EU economy after the coronavirus pandemic. Rather positive indicators of ZEW investor and consumer sentiment came out in Germany, and the inflation in Britain decreased. According to the European Automobile Manufacturers Association, new car registrations increased slightly in May. HSBC Bank stocks rose 1% after reporting that they will continue to cut costs and are about to lay off 35,000 of their employees after the coronavirus pandemic is over. Now HSBC staff is 235 thousand people. The income of the global banking sector has been severely hit by Covid-19. So, according to the Federal Deposit Insurance Corporation, the total profit of US banks in the 1st quarter decreased by 70%.

Commodity Market news

CommoditiesChange
WTI Crude-1.41%
Brent Crude Oil-1.1%

Today, oil is being traded narrowly after a 3-day growth. Since last Friday, quotes have risen by 5-6% amidst an increase in world demand forecast from the International Energy Agency (IEA) for 2020 to 91.7 million barrels per day. The increase in oil prices has now stalled, pending the publication of the official US oil reserves change for the week at 18-30 CET. According to the independent American Petroleum Institute, reserves grew by 3.9 million barrels. This is a negative factor for oil prices, which has so far been offset by a positive one: Iraq has reduced oil export by 8% or 300 thousand barrels per day since early June.

Gold Market News

MetalsChange
Gold-0.88%

Gold is getting cheaper today amid the statement by the head of WHO on the effectiveness of the British Covid-19 drug called Dexamethasone and the US dollar index growth. Good macroeconomic data in developed countries may indicate a recovery in the global economy affected by the coronavirus pandemic. This is the 2nd negative factor for precious metals prices. However, the emerging border conflict between India and China may support their quotes.

Market Analysis provided by IFCMarkets

Note:
This overview has an informative and tutorial character and is published for free. All the data, included in the overview, are received from public sources, recognized as more or less reliable. Moreover, there is no guarantee that the indicated information is full and precise. Overviews are not updated. The whole information in each overview, including opinion, indicators, charts and anything else, is provided only for familiarization purposes and is not financial advice or а recommendation. The whole text and its any part, as well as the charts cannot be considered as an offer to make a deal with any asset. IFC Markets and its employees under any circumstances are not liable for any action taken by someone else during or after reading the overview.

COFFEE Analysis: Expected rise in global supply bearish for coffee price

By IFCMarkets

Expected rise in global supply bearish for coffee price

The United States Department of Agriculture (USDA) Foreign Agricultural Service forecast global coffee production will exceed demand by 6.4 million bags in 2020/21, as estimated in its biannual World Markets and Trade report released recently. The USDA forecasts world coffee production for 2020/21 to be 9.1 million 60-kilogram bags higher than the previous year, at record 176.1 million. Speculators increased their net short position in ICE arabica futures by 6,326 contracts to 17,489 contracts in the week to June 9, according to Commerzbank. And analysts note that coffee demand could be negatively impacted by a second wave of coronavirus infections. An expected rise in global demand and drop in demand is bearish for coffee price.

IndicatorVALUESignal
RSINeutral
MACDSell
Donchian ChannelSell
MA(200)Sell
FractalsSell
Parabolic SARSell


Summary of technical analysis

OrderSell
Buy stopBelow 94.21
Stop lossAbove 100.76

Market Analysis provided by IFCMarkets

Could China’s strategic pork reserve be a model for the US?

By David L. Ortega, Michigan State University

During the height of the coronavirus pandemic, we became accustomed to face-masked shoppers, social distancing and one-way aisles at the grocery store. But most shocking was the scene at the supermarket meat case.

Some meat processing plants closed or reduced capacity as workers contracted the virus. Disruptions to the supply chain resulted in shortages and price increases for beef and pork products. Purchase limits on meat and other items were reminiscent of wartime food rationing.

Ideas and solutions regarding the vulnerabilities of meat production have ranged from eliminating meat consumption to decentralizing meat production away from large packing plants to increasing automation of processing facilities.

Another solution may be to create a strategic meat reserve.

As a food and agricultural economist and Chinese food systems scholar, I have become very familiar with China’s strategic pork reserve and how the concept could apply in the United States.

China’s piggy bank

China is the world’s largest consumer and producer of pork.

The average Chinese person eats roughly 20 more pounds of pork per year than their American counterpart, with China producing over four times more pork than the U.S., or close to half of the world’s supply. Although the size of China’s strategic pork reserve is a tightly held state secret, Beijing calls upon these reserves when supplies run low.

Since August 2018, African swine fever, a highly contagious and deadly virus affecting pigs, has decimated China’s hog population. Millions of pigs, totaling more than 40% of China’s herd, have been killed by the virus or culled in an attempt to contain its spread. To control skyrocketing pork prices, China has tapped into its reserves.

When supplies run high, and prices get too low, the reserve is bolstered by increasing government demand. When supply is low, and prices get high, pork is released or auctioned into the market.

In the wake of African swine fever, this strategic pork reserve is one tool helping stabilize the market and ensure sufficient supply for consumers.

The United States and Canada are among the other countries with strategic reserves.
Dvortygirl/Wikimedia Commons, CC BY

American meat and Canadian syrup

While America’s recent experiences with meat supply disruptions are different, the resulting shortages and price increases are similar.

COVID-19 disruptions to the U.S. meat supply chain led to a nearly 40% temporary reduction in processing capacity, which resulted in significant increases in both wholesale and retail prices of pork and beef products in April and May. Meat production has since increased as processing plants have reopened.

While the U.S. does have substantial reserves of red meat in cold storage – 1.1 billion pounds, to be exact – these supplies are a tiny fraction of the over 50 billion pounds of meat produced annually and are not used in a strategic sense like China’s pork reserve.

But we don’t have to look on the other side of the world for examples of strategic food reserves. Our Canadian neighbors manage a strategic reserve of maple syrup which operates like a cartel.

A familiar concept

While some may find it radical, the idea of strategic reserves in the U.S. is not a new concept.

The United States Strategic Petroleum Reserve, with a storage capacity of 714 million barrels, was created to reduce the effects of oil supply disruptions and is an important foreign policy tool. And up until 2015, the United States had a National Raisin Reserve, which was created by the government following World War II to control prices.

The raisin reserve allowed producers to collectively influence supply, demand and prices. Likened to a government operated cartel, the U.S. Supreme Court ordered the reserve to cease operations, ruling it unconstitutional.

While a strategic reserve could help soften future meat supply disruptions, its ability to interfere with market operations is likely to be met with strong opposition. Moreover, a strategic reserve would require significant capital investments, industry coordination and increased government intervention.

It may not be time to start stockpiling the bacon yet, but it’s an idea worth considering if you want to avoid disappointment in the meat aisle.

About the Author:

David L. Ortega, Associate Professor of Food and Agricultural Economics, Michigan State University

This article is republished from The Conversation under a Creative Commons license. Read the original article.


Fibonacci Retracements Analysis 17.06.2020 (GBPUSD, EURJPY)

Article By RoboForex.com

GBPUSD, “Great Britain Pound vs US Dollar”

As we can see in the H4 chart, after updating the high and reaching the mid-term 50.0% fibo at 1.2892, GBPUSD started a new descending impulse due to the divergence and has already reached 23.6% fibo. The next downside targets may be 38.2%, 50.0%, and 61.8% fibo at 1.2277, 1.2110, and 1.1946 respectively. The resistance is the high at 1.2813. If the price breaks this level, the instrument may resume trading upwards.

GBPUSD_H4
Risk Warning: the result of previous trading operations do not guarantee the same results in the future

The H1 chart shows more detailed structure of the current descending movement. After the convergence, the pair is correcting to the upside. Considering the potential for a new rising impulse towards the high at 1.2813, the price may break it and then continue moving towards the post-correctional extension area between 138.2% and 161.8% fibo at 1.2861 and 1.2928 respectively.

GBPUSD_H1
Risk Warning: the result of previous trading operations do not guarantee the same results in the future

EURJPY, “Euro vs. Japanese Yen”

As we can see in the H4 chart, after reaching 38.2% fibo, EURJPY is correcting to the downside towards 50.0% and 61.8% fibo at 119.87 and 118.82 respectively. After finishing the pullback, the instrument may start a new rising wave towards the mid-term 50.0% fibo at 125.93 but only after breaking the high at 124.43.

EURJPY_H4
Risk Warning: the result of previous trading operations do not guarantee the same results in the future

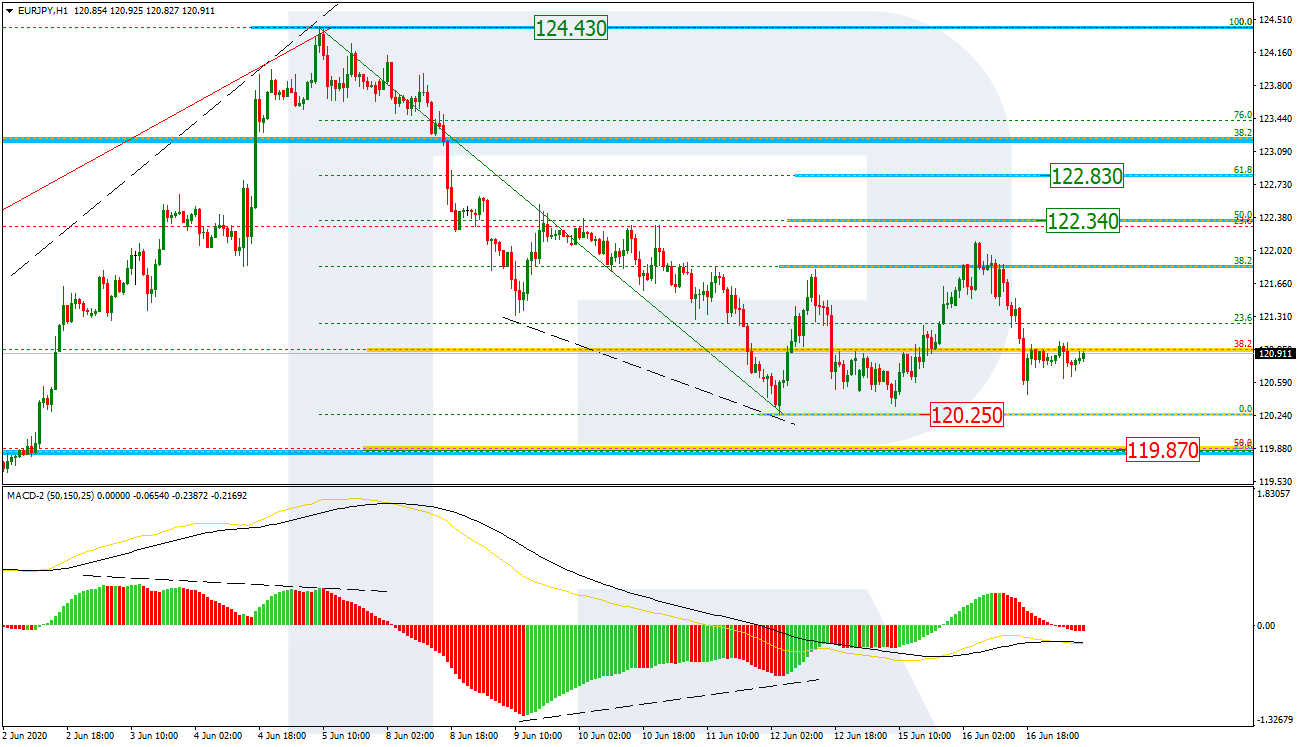
In the H1 chart, EURJPY is correcting to the upside after completing the descending wave and has already reached 38.2% fibo. Later, the market may reach 50.0% and 61.8% % fibo at 122.34 and 122.83 respectively. However, if the price breaks the low at 120.25, it may resume the descending tendency.

EURJPY_H1

Article By RoboForex.com

Attention!
Forecasts presented in this section only reflect the author’s private opinion and should not be considered as guidance for trading. RoboForex LP bears no responsibility for trading results based on trading recommendations described in these analytical reviews.

Forex Technical Analysis & Forecast 17.06.2020

Article By RoboForex.com

EURUSD, “Euro vs US Dollar”

After finishing another descending wave at 1.1227, EURUSD is correcting. Possibly, the pair may reach 1.1280 and then fall to break 1.1222. Later, the market may continue trading downwards with the short-term target at 1.1178.

EURUSD
Risk Warning: the result of previous trading operations do not guarantee the same results in the future

GBPUSD, “Great Britain Pound vs US Dollar”

GBPUSD continues falling towards 1.2470. After reaching it, the instrument may break it to the downside and then continue trading downwards with the short-term predicted target at 1.2250.

GBPUSD
Risk Warning: the result of previous trading operations do not guarantee the same results in the future

USDRUB, “US Dollar vs Russian Ruble”

After completing the descending wave at 69.20 along with the correction towards 69.90, USDRUB has formed a new consolidation range around the latter level. If later the price breaks the range to the downside, the market may form a new descending structure to reach 67.90 at least; if to the upside – choose an alternative scenario and start another growth with the target at 72.00.

USDRUB
Risk Warning: the result of previous trading operations do not guarantee the same results in the future

USDJPY, “US Dollar vs Japanese Yen”

USDJPY continues trading downwards to reach 107.03. Later, the market may start another growth towards 108.20. However, if the price breaks 107.00 to the downside, the instrument may resume trading downwards with the target at 106.60.

USDJPY
Risk Warning: the result of previous trading operations do not guarantee the same results in the future

USDCHF, “US Dollar vs Swiss Franc”

USDCHF is still falling towards 0.9450. Possibly, today the pair may reach it and then form one more ascending structure to break 0.9560. Later, the market may continue trading upwards with the short-term target at 0.9650.

USDCHF
Risk Warning: the result of previous trading operations do not guarantee the same results in the future

AUDUSD, “Australian Dollar vs US Dollar”

AUDUSD is consolidating around 0.6900. Today, the pair may form a new descending wave towards 0.6800 and then grow to return to 0.6900. If later the price breaks the range to the downside, the market may resume trading downwards with the target at 0.6716.

AUDUSD
Risk Warning: the result of previous trading operations do not guarantee the same results in the future

BRENT

Brent is consolidating above 40.00. Possibly, today the pair may grow to reach 43.40. However, if the price breaks 40.00 to the downside, the market may form a new descending structure to break 38.89 and then continue the correction with the target at 36.50.

BRENT
Risk Warning: the result of previous trading operations do not guarantee the same results in the future

XAUUSD, “Gold vs US Dollar”

Gold is consolidating above 1716.00. According to the main scenario, the price is expected to resume trading downwards with the first target at 1698.00 and then start a new correction towards 1715.50.

GOLD
Risk Warning: the result of previous trading operations do not guarantee the same results in the future

BTCUSD, “Bitcoin vs US Dollar”

BTCUSD is forming a narrow consolidation range around 9500.00. Possibly, the pair may expand the range up to 9700.00 and then form a new descending structure to break 9100.00. Later, the market may continue trading inside the downtrend with the target at 8700.00.

BITCOIN
Risk Warning: the result of previous trading operations do not guarantee the same results in the future

S&P 500

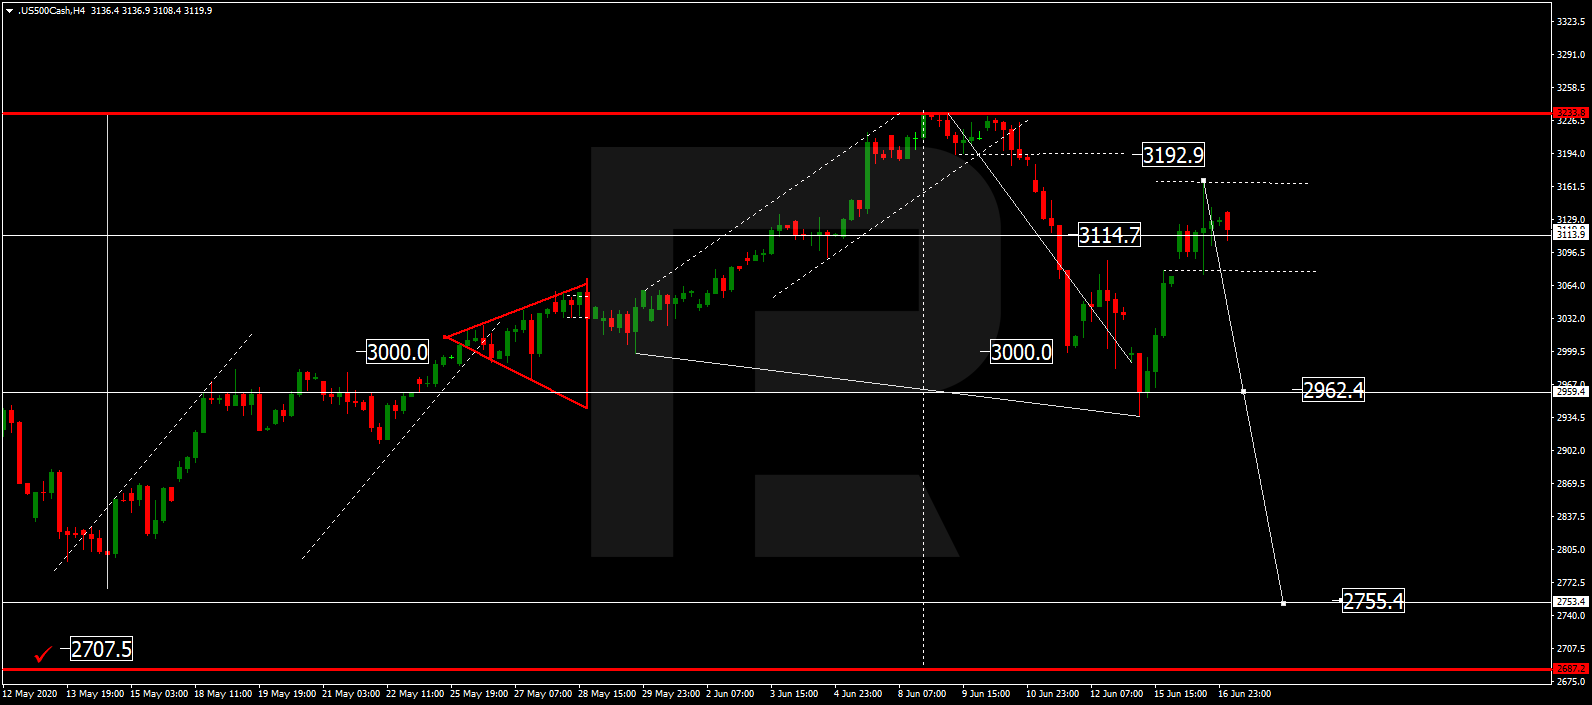
The Index is consolidating around 3115.0. If later the price breaks the range to the upside, the market may reach 3192.9; if to the downside at 3050.0 – form a new descending structure to break 2960.0 and then continue trading downwards with the short-term target at 2755.5.

S&P 500

Article By RoboForex.com

Attention!
Forecasts presented in this section only reflect the author’s private opinion and should not be considered as guidance for trading. RoboForex LP bears no responsibility for trading results based on trading recommendations described in these analytical reviews.

USDCAD Analysis: Preparing for publication of important statistics in Canada

By IFCMarkets

Preparing for publication of important statistics in Canada

The upward movement indicates the weakening of the Canadian dollar against the US dollar. Annual inflation in Canada is expected to rise, from -0.2% in April to 0.3% in May. Core inflation can rise to 1.45% from 1.2%. Data will be released on 16-30 CET. The Labour Market Review by the independent agency ADP will be published in Canada on Thursday. On Friday, June 19, retail sales will be released. Hydrocarbons make up a large part of Canada’s exports, so the dynamics of the exchange rate may depend on oil prices. The Fed’s regional directors are expected to speak this week, and this may have an impact on the American dollar. Fed Chairman Jerome Powell will speak on Wednesday and Friday at the Federal Open Market Committee (FOMC). On Wednesday, the US will publish the real estate market and construction indicators, on Thursday – the number of unemployed for the week, and on Friday – the current account balance for the first quarter. All their forecasts look neutral and can affect the market only if there is a large discrepancy in the real data.

IndicatorVALUESignal
RSIBuy
MACDNeutral
MA(200)Neutral
FractalsNeutral
Parabolic SARBuy
Bollinger BandsNeutral


Summary of technical analysis

OrderBuy
Buy stopAbove 1.366
Stop lossBelow 1.33

Market Analysis provided by IFCMarkets

Euro struggles against Dollar; Gold wobbles

By Lukman Otunuga, Research Analyst, ForexTime

The Euro remains trapped in a fierce battle against an unyielding Dollar with prices trading marginally below 1.1250 as of writing.

Over the past few days, the EURUSD has displayed explosive levels of volatility thanks to conflicting market themes and sharp swings in investor sentiment. With the Dollar finding renewed support from new coronavirus outbreaks in Beijing and rising geopolitical tensions, the Euro is poised to extend losses against the Greenback.

On the hourly timeframe, the head and shoulders technical pattern is bearish and suggests a move towards 1.1220 and 1.1180, respectively. Technical traders may wait for a solid hourly close below the 1.1220 intraday support level before riding the decline lower.

Zooming out to the H4 chart, bears seem to be in control with prices cutting below 1.1250. Technical lagging indicators like the 20 Simple Moving Average and MACD point to the downside. Sustained weakness under 1.1250 on the H4 chart could trigger a decline back towards 1.1200 which remains a significant support level.

Looking at things in the longer term, the Euro remains in a losing battle against the Dollar on the daily charts. Should the last line of defence at 1.1200 give way, expect prices to tumble towards 1.1150 and 1.1090, respectively.

Commodity spotlight – Gold

One would have expected Gold shine amid the market caution and rising geopolitical tensions.

However, the opposite was witnessed on Wednesday as prices shed 0.6% despite the rising levels of risk aversion. If the mighty Dollar continues to steal Gold’s safe-haven flows, the precious metal may sink lower in the short term.

In regards to the technical picture, the precious metal is under pressure on the daily charts. A breakdown below $1715 may open a path back towards $1700 and $1670. Should $1715 prove to be reliable support, prices may rebound towards $1747.

Disclaimer: The content in this article comprises personal opinions and should not be construed as containing personal and/or other investment advice and/or an offer of and/or solicitation for any transactions in financial instruments and/or a guarantee and/or prediction of future performance. ForexTime (FXTM), its affiliates, agents, directors, officers or employees do not guarantee the accuracy, validity, timeliness or completeness, of any information or data made available and assume no liability as to any loss arising from any investment based on the same.


Forex-Time-LogoArticle by ForexTime

ForexTime Ltd (FXTM) is an award winning international online forex broker regulated by CySEC 185/12 www.forextime.com

The Analytical Overview of the Main Currency Pairs on 2020.06.17

by JustForex

The EUR/USD currency pair

Technical indicators of the currency pair:
  • Prev Open: 1.13244
  • Open: 1.12620
  • % chg. over the last day: -0.53
  • Day’s range: 1.12360 – 1.12940
  • 52 wk range: 1.0777 – 1.1494

The demand for risky assets has weakened again. EUR/USD quotes have updated local lows. Investors are concerned about the second outbreak of coronavirus. The Fed Chairman Jerome Powell confirmed the grim picture of the prospects for economic recovery in the US after the COVID-19 virus pandemic. At the same time, positive data on US retail sales supported the greenback. Currently, the EUR/USD currency pair is consolidating in the range of 1.1225-1.1275. We recommend opening positions from these marks.

The Economic News Feed for 2020.06.17:
  • – Consumer price index in the Eurozone at 12:00 (GMT+3:00);
  • – A number of indicators on the real estate market in the US at 15:30 (GMT+3:00).

We also recommend paying attention to the speech by the Fed Chairman.

EUR/USD

Indicators signal the power of sellers: the price has fixed below 50 MA and 100 MA.

The MACD histogram is in the negative zone and continues to decline, which indicates the bearish sentiment.

Stochastic Oscillator is in the neutral zone, the %K line is below the %D line, which also gives a signal to sell EUR/USD.

Trading recommendations
  • Support levels: 1.1225, 1.1195, 1.1145
  • Resistance levels: 1.1275, 1.1310, 1.1350

If the price fixes below 1.1225, a further fall in EUR/USD quotes is expected. The movement is tending to 1.1190-1.1160.

An alternative could be the growth of the EUR/USD currency pair to 1.1310-1.1340.

The GBP/USD currency pair

Technical indicators of the currency pair:
  • Prev Open: 1.26050
  • Open: 1.25718
  • % chg. over the last day: -0.21
  • Day’s range: 1.25350 – 1.25886
  • 52 wk range: 1.1466 – 1.3516

The GBP/USD currency pair has been declining. The British pound has updated local lows. The demand for risky assets has weakened. At the moment, the key support and resistance levels are 1.2530 and 1.2600, respectively. A further drop in GBP/USD quotes is possible. We expect statistics on the real estate market in the US, as well as a speech by the Fed Chairman. We recommend opening positions from key levels.

In May, the UK consumer price index met market expectations and counted to +0.5% (y/y).

GBP/USD

Indicators signal the power of sellers: the price has fixed below 50 MA and 100 MA.

The MACD histogram is in the negative zone, which indicates the development of bearish sentiment.

Stochastic Oscillator is in the neutral zone, the %K line is below the %D line, which also gives a signal to sell GBP/USD.

Trading recommendations
  • Support levels: 1.2530, 1.2480, 1.2455
  • Resistance levels: 1.2600, 1.2675

If the price fixes below 1.2530, a further drop in GBP/USD quotes is expected. The movement is tending to 1.2480-1.2450.

An alternative could be the growth of the GBP/USD currency pair to 1.2640-1.2680.

The USD/CAD currency pair

Technical indicators of the currency pair:
  • Prev Open: 1.35668
  • Open: 1.35420
  • % chg. over the last day: -0.21
  • Day’s range: 1.35120 – 1.35719
  • 52 wk range: 1.2949 – 1.4668

The USD/CAD currency pair is in a sideways trend. There is no defined trend. The loonie is testing the following local support and resistance levels: 1.3510 and 1.3570, respectively. Financial market participants expect additional drivers. We recommend paying attention to the dynamics of oil quotes. Positions should be opened from key levels.

At 15:30 (GMT+3:00), a report on inflation will be published in Canada.

USD/CAD

Indicators do not give accurate signals: the price has fixed between 50 MA and 100 MA.

The MACD histogram has moved into the negative zone, which indicates the development of bearish sentiment.

Stochastic Oscillator is in the neutral zone, the %K line is above the %D line, which gives a signal to buy USD/CAD.

Trading recommendations
  • Support levels: 1.3510, 1.3455, 1.3390
  • Resistance levels: 1.3570, 1.3620, 1.3680

If the price fixes below 1.3510, USD/CAD quotes are expected to fall. The movement is tending to 1.3460-1.3430.

An alternative could be the growth of the USD/CAD currency pair to 1.3620-1.3680.

The USD/JPY currency pair

Technical indicators of the currency pair:
  • Prev Open: 107.325
  • Open: 107.292
  • % chg. over the last day: -0.01
  • Day’s range: 107.160 – 107.441
  • 52 wk range: 101.19 – 112.41

The USD/JPY currency pair is still being traded in a prolonged flat. There is no defined trend. The trading instrument continues to test the following key support and resistance levels: 107.05 and 107.65, respectively. The demand for “safe-haven” currencies has been resumed. We recommend paying attention to the dynamics of US government bonds yield. Positions should be opened from key levels.

During the Asian trading session, weak data on the trade balance of Japan have been published.

USD/JPY

Indicators do not give accurate signals: the price has crossed 50 MA.

The MACD histogram is near the 0 mark.

Stochastic Oscillator is near the overbought zone, the %K line has crossed the %D line. There are no signals at the moment.

Trading recommendations
  • Support levels: 107.05, 106.60
  • Resistance levels: 107.65, 108.20, 108.55

If the price fixes above 107.65, USD/JPY quotes are expected to rise. The movement is tending to 108.00-108.30.

An alternative could be a decrease in the USD/JPY currency pair to 106.70-106.40.

by JustForex