­

David Smith: ‘Common Sense 2.0’ Is a Call to Action to Hold Government Accountable

By The Gold Report

Source: Maurice Jackson for Streetwise Reports   06/16/2020

David Smith of The Morgan Report tells Maurice Jackson of Proven and Probable what he thinks about the current financial state of America, ways investors can protect themselves from the vagaries of modern times—including reading “Common Sense 2.0″—and mentions a few resource companies he finds worthwhile.

Maurice Jackson: Today, we’re going to discuss a very, very important topic and that is debt slavery. We’re also going to discuss common sense, and more importantly, what actions you need to take to protect your family. Joining us for a conversation is David Smith from my favorite newsletter, The Morgan Report. Mr. Smith, welcome to the show, sir.

David Smith: It’s great to be here, Maurice.

Maurice Jackson: What a delight to finally have you on the program, sir. All right, David, let’s begin today’s conversation with the financial state of America. What are your biggest concerns and why?

David Smith: Well, I have a bit of a laundry list but I think they’re all pretty important. I’d say the current state of our nation due to government overreach; financialization of the economy, which I read the other day was about 41% of gross domestic product, which involves shifting paper back and forth; debt creation; the militarization of the police; excessive foreign adventures; and the great imbalance of wealth between Main Street and Wall Street. It’s quite a list, unfortunately.

Maurice Jackson: It certainly is. And all respectively are important and germane for today’s conversation. How did America get to this point?

David Smith: We’ve been in the process of this for several decades, and it’s the reason that today most people have little trust in our core institutions, and that trust is not misplaced. The Constitution set up the government to serve and be accountable to we the people. Instead, it’s been turned into us serving them.

Maurice Jackson: If American is in so much debt, where are we getting the resources to pay for stimulus programs?

David Smith: Literally out of thin air. The government prints more and more money, either digitally or in print form, and the limit is unlimited, as people can see what’s going on here in the last few months. There doesn’t seem to be any limit to it, which costs the government almost nothing to do by the way.

Maurice Jackson: But the cost is a long-term cost, and we’re going to get into that here in a little bit further. Let me ask you this here, and this is a sensitive subject, but are American citizens becoming debt slaves?

David Smith: They are. I read something the other day that almost half of the people in the country, if they had a $400 or $500 expense come up that they hadn’t planned on, they couldn’t meet it. That is sad in what’s supposed to be the wealthiest nation on earth.

Maurice Jackson: You shared with me a couple of weeks ago that I should read a logical and practical book that addresses the aforementioned. What book am I referring to, sir?

David Smith: It’s a thin book available on Amazon called “Common Sense 2.0,” written by an individual using the pen name of Thomas Paine. The original Thomas Paine, as your readers may recall, authored a pamphlet in the same name at the start of the American Revolution. It inspired the patriots, in 1776, to declare independence from Great Britain, paving the way for the Declaration of Independence, and it’s still in print almost 250 years later.

If you substitute the words U.S. government for British, it sounds a lot like what we’re dealing with today. “Common Sense 2.0,” written by someone using the pen name Thomas Paine, is not a call to arms and it’s not written to start a revolution, except in the reader’s thinking and willingness to take nonviolent action in order to hold our government accountable for its behavior.

Maurice Jackson: Yeah, it’s so important to understand because when you read the book, it begins at the individual level. And so often what we hear today is it’s at the top and it begins here with the individual. We first must be empowered to understand what is taking place in the book addresses it. And again, the title of the book is “Common Sense 2.0,” and it’s a nonpartisan view, is that correct?

David Smith: That is correct.

Maurice Jackson: And it ties the relationship between several industries and parties, I should say, that have created the situation that we’re in, but you do not hear about it if you listen to the mainstream financial news networks. Can you expand on just some of the culprits that I’m referencing here?

David Smith: Well, one of the key things that the author mentions—I’ve always been fascinated with this little story, and it’s probably the most quoted presidential farewell address in American history. It was put out by Dwight D. Eisenhower in 1961, when he was leaving the presidency. Part of what he wrote was, “In the councils of government, we must guard against the acquisition of unwarranted influence whether sought or unsought by the military-industrial complex. We must never let the weight of this combination endanger our liberties or democratic processes.”

Now, Maurice, few people realize it, but Eisenhower, in an early draft with his brother, Milton, originally phrased it as the military-industrial-congressional complex. But he dropped the term congressional when he put it into the final form because, he said, “It’s more than enough to take on the military and private industry, I couldn’t take on Congress as well.” And he warned against the merchants of death dictating national policy lest it turned the U.S. into a garrison state, destroying from within what you’re trying to defend from without.

Eight years earlier, in 1953, when Stalin died, Eisenhower said, “We pay for a single fighter with a half-million bushels of wheat. We pay for a single destroyer with new homes that could have housed more than 8,000 people. This is not a way of life at all in any true sense. Under the cloud of threatening more, it is humanity hanging from a cross of iron.” And as it turned out he was correct in how Congress, as a member of this unholy triumvirate, would become nothing more than a subservient handmaiden with all three groups extorting wealth from the rest of us.

Maurice Jackson: About the military-industrial complex, one of the things that always concerns me is when I hear politicians discuss the defense budget. Because in my view. . .I don’t know how you feel about it. . .but we’re not doing defense, we’re doing offense.

David Smith: It is. I’ve read that the 9/11 attacks cost less than a million dollars to execute. And we have spent, by certain figures that I’ve seen lately, about $5 trillion in the Middle East and at Homeland to counteract what we didn’t figure out right the first time, and that to me is horrific.

And the expenses don’t just stop today, they go on for decades for the people that come back that have health issues, that have missing limbs, that need to be taken care of for the rest of their lives. It just goes on and on, and it was so unnecessary. It’s one thing to go there, to Afghanistan, for a month and break a few things and leave, but to stay there for 19 years, when we knew all along our policies were not working—that alone and in Syria and then Iraq—is just immorality of the baseless kind.

The Lockheed Martin F-35 has at least one contractor in the districts of over 470 congressmen. This was a quote from “Common Sense.” And so no matter how unable that plane is to ever carry out the mission, which so far it seems to be unable to do, it’s going to go on and on and on, and that’s emblematic of the problem that we have. When something doesn’t work, because so many people depend upon it for their congressional vote, they just keep voting funds not to mention whether or not it could ever work. Very sad.

I don’t know how you feel about this, but I feel pain in what we’re seeing here, and what we’re talking about, because it seems to me to be so unnecessary. Yet that built up over a long time, and people didn’t think it was that big a deal, and it became a big deal and we didn’t do anything.

That’s one thing we didn’t mention—that in 2008 we really could have turned things around if we had let nature take its course, but they bailed out the financial houses, not only in the U.S. but overseas, and everybody that created the moral hazard got bailed out except for Main Street. And now this is just 2008 on steroids and I feel so sad for the hundreds of thousands of businesses across the land who are not going to be able to get back to anything normal. Many of them are going to go out of business while the people that created this issue are wealthier than they ever were. By an order of magnitude, it just isn’t right.

Maurice Jackson: You and I had a discussion before this interview and we should have recorded it. But we were talking about Congress and their ability to have a privilege that you and I don’t have. And we were discussing insider trading and that’s just a small example. But can you just share that conversation we were having about the extension that. . .or liberties that they have that we don’t have. The constitution states that we’re all created equal, but if you and I were to do some of the actions that members in Congress do, we’d go to prison. Yet they have the ability to profit.

Now, I always find it interesting—if you did a research study on everyone that’s in Congress, there’s a commonality that they have irrespective of their party, it’s that they’re usually millionaires, yet the salary that they receive is nowhere near that. The question should become, where does that discretionary income come from? And no one seems to care.

David Smith: Well, it comes from several sources. Part of this peddling influence, where something is going on in our culture today with most of the major businesses, is called regulatory capture. You have an organization of government that’s supposed to regulate, like the FDA (U.S. Food & Drug Administration) or some other agencies, EPA (Environmental Protection Agency). And often they are doing the bidding of the people they’re supposed to regulate. And they do this not just out of the [kindness] of their heart, because very often they’ll go to work for them after they get out of Congress, and they get a fat check for the work that they’ve done while they were in Congress rather than serving we the people.

Another thing they do—and this was this year; it’s not something that happened years ago—as we moved into this massive crisis with the COVID-19 virus, and the economy fell off a cliff, some of the members of Congress—at least three or four that were made public—have sold or bought companies that they knew would be influenced by government policy announcements that were going to be made in the near future. They were on committees or they had access to inside information, and they literally made millions of dollars in their accounts by doing something that you and I would go to jail for if we made a couple of hundred dollars.

They’re acting on inside information. They were able to do this without apology, which goes well beyond what anyone else could or should be able to do. Also, oftentimes when Congress writes a law, such as the Obamacare Act, they write themselves out of it so that they are not beholden to the dictates of that Act, but the rest of us, whether we like it or not, had to participate. And that’s the sort of thing that rubs people the wrong way, and it should.

Maurice Jackson: It should, and that’s a discussion we had as well. And unfortunately, it seems to fall on deaf ears.

If we look at the situation we have currently, as of this recording we have protests because of events surrounding Mr. Floyd, as well as COVID-19, but there are no protests for the dialogue that we’re having right now. And the dialogue is paramount for everyone to understand the long-term consequences of debt slavery. That is a powerful word, that is a title that is placed on every one of us, and we seem to be just sitting dormant with impunity. Americans are simply allowing these things to happen. And if you don’t have the discussion about it—and even better than that, you have to have an understanding about it—and that’s where “Common Sense 2.0” should be your companion.

David Smith: Yes. And it’s a pseudonym for someone that’s a concerned citizen, someone who is very well informed, and [someone] who [not only] states all the problems he or she does know very effectively, but also solutions, some of which I feel are very, very profound and workable.

And like we’re mentioning, the term debt slave is exactly the metaphor and the terminology that should be used. Because when you are so far in debt that you have no resources to afford something coming up that might cost a few hundred dollars you hadn’t planned on, that could throw you into a financial panic. Something is wrong. We know this is not a country where the average wage per day is $30 a month. I mean, this is just stunning that we have allowed ourselves to get into this.

And part of it. . .it’s not so much that people have spent themselves into debt—they’ve done some of that themselves—but they’ve allowed the government, the people that were elected to represent them, do things and formulate policies that manifestly do not work, and take us deeper and deeper down that road towards financial slavery. And the consequences of this are a loss of freedom, loss of opportunity, loss of the ability to control our destiny and shape our future and that of our families, and ultimately the loss of self-respect. And all of those elements are directly in play today, because of what’s going on by our government over the last few decades.

Maurice Jackson: If one studies monetary history, you can tie where the money turns into currency, and then there is a degradation of the morals in that society, and then the empires crumble. That’s repeated throughout history and unfortunately, on our watch, we’re seeing that happen right here right now.

I just shake my head because I’m a proud father, and I want the very best for my family, and I believe I’m positioning myself and my family for the very best. But my concern is for the person listening that doesn’t expose himself to this information. They’re exposed to whatever the media is showing, whatever ESPN is showing or a television network is showing. They’re not focused on what they should be focused on. I appreciate you coming on today to shed some light on this for us.

Speaking of common sense, how does owning physical precious metals fit into this discussion?

David Smith: One of the things about precious metals, and people don’t often think about this, is that, especially gold and silver, they’re money. They’ve been money for thousands of years. Fiat money—fiat currency, we should call it—is paper money that is printed, and we believe it has value as long as we have confidence in it.

But every time in history, and David Morgan has shown this conclusively and others have as well—every currency that was ever printed, every paper money, from the time that Chinese first got the idea right on through to today—the purchasing power of that fiat currency has always gone to zero. And our own money in our pocket, which we think still has a lot of value, if you look at 1913 when the Federal Reserve Act was put into play, the purchasing power now compared to then is about $0.02, probably less.

And even since the 1960s, which many of us can remember, that $20 bill that you had in your pocket in 1960, it would buy $100 worth of product today. That $20 bill has lost 80% of its purchasing power just since 1960. It’s sad, and not too many people understand this.

And the problem is, inflation is a policy of the government. They come out and say, “We want to inflate the currency by 2% or 3% a year.” They’re telling you in plain terms, which most people don’t understand because they don’t know what inflation is and what it does. “We want to devalue the money in your pocket by $0.03 or $0.04 every year.” And it is a lot worse than that, that’s just the state at the moment.

Maurice Jackson: It’s very pernicious, because then you factor in taxes. It goes way beyond the small fractional number that you’d believe it is because, again, you have to consider compounding interest as well.

David Smith: And that’s what’s so pernicious, what you said about taxes. Let’s say you make a certain profit on a stock that you have, well, part of that profit is inflated. And so you didn’t make anything on that portion of it, but you are taxed on the whole thing. Part of the tax is on a phantom profit. So it’s adding insult to injury, exactly what you were implying.

Maurice Jackson: With regards to physical precious metals, when someone is new to the conversation, the question is always asked, how much should I have? And we’re not here to provide financial advice, but in your opinion, how much allocation should someone consider to their portfolio with regards to precious metals?

David Smith: Well, this is, as you mentioned, entirely dependent on the individual—their goals, their time frame and outlook, their financial resources, and their willingness to learn about the issues that are going on. But the figure that is often bandied about is around 5% or 10%, although in my view that number given where we are in the cycle, should higher.

But I think a person can place 10% of their liquid assets into gold and silver, buying it at hopefully a decent price without a huge premium, although premiums have been high lately, and putting away safely and using it as an insurance policy that can help against the degradation of their other assets due to inflation and to crises in the markets, some of which we’re seeing as we talk.

Maurice Jackson: May I ask you this? Which precious metal are you buying right now and why?

David Smith: Well, gold and physical silver I think are the two most important metals to have access to, and it’s really powerful if you have them in hand, so to speak—in other words, rather than buying an allocated portion in a bank, where your name is on a piece of paper but you could never go get it, and it’s mixed in with everybody else, a commingled account, or buying an ETF (exchange-traded fund) that claims to have it.

If you have some that you can put away and you don’t tell people about it—you put it in the bank box, you put it in a hole in the ground, you maybe have a little bit at home and in a place that only you know where it is, this type of thing—that’s the way to go about it.

[Gold and silver] are the two most reliable, because they’ve always been money. Some people like palladium and platinum, but gold and silver have always been considered money, going back 5,000 years. And so those are the two, really, that make the most sense in my view.

Maurice Jackson: Moving on to resource stocks, give us your outlook, I should say, on precious metals, and then also, if you would, the base metals.

David Smith: Well, the base metals are a little more problematic because they’re affected in price by the vagaries of the economy, this type of a thing. I think there’s a bit of a disconnect going forward. Unless we get into a hyperinflationary situation or a very strong global economy, which I don’t see happening anytime soon, base metals are going to lag in terms of appreciation. It’s not to say that there won’t be companies that do well that make a big discovery.

I think copper probably is one that, because it’s already in a bit of a deficit, will be relatively strong regardless of how strong the economy is over the intermediate term and the longer term. And, also, more and more copper is being used in electronic devices and cars and whatnot.

But gold and silver are in a class by themselves, because they’re driven not just by the supply-demand considerations, they’re influenced a lot by investment demand, but also because of the grade and the numbers of discoveries and the amount of time it takes to develop a mine have gotten longer and longer and the grades lower and lower. And so there’s this gap between what’s being taken out of the ground and what is available in relation to demand. And those, I believe, are going to drive gold and silver much higher in relation to base metals on a percentage basis going forward, over the next three to five years, at least.

Maurice Jackson: Mr. Smith, I’m going to ask you a question that I get asked several times: Should I buy the mining stocks first or should I get the precious metals? In other words, should I get a gold company or should I get gold?

David Smith: Let me phrase that the way David Morgan always does, and I’m totally on the same page with him on this. He always counsels his subscribers to buy the metal first. Get yourself some metal and put it away in a secure place, and then if you have extra money, and if you’re willing to accept the extra risks, which by definition go along with mining stocks, then do some involvement in that. And when you look at the mining stocks focus on the seniors, because they have less risk, or on well-run royalty companies. Have maybe a few juniors—the juniors will probably appreciate on a percentage basis much more powerfully over the next few years than will the seniors.

If you’re looking at the company that’s selling for $60/share today, the odds of going to $240 are possible, but not so much as likely as a mining stock that is producing today that maybe costs $2—it could go to $10 very easily. And so that percentage thing is there, you’re accepting a little bit more risk. Then maybe look at one or two exploration plays that you’ve researched carefully, and you’re comfortable with management. When you come to the risk and buy the deposit and this sort of thing, and layer that out, that’s your lottery ticket.

Maurice Jackson: Those are very responsible words by the way, because I always hear someone say this, “That’s new. I’m going to first go into the mining stocks, get this high return, and then after that happens I’m going to get the physical precious metals.” And my words to them are just as you shared.

I interview and have an opportunity, a relationship, with some of the most seriously successful people. And they’ve studied serially successful people in their own right and they implement the opposite philosophy. But someone new, for some reason, wants to take that quick approach. And so I appreciate the responsible words there. Are there any companies that have your attention right now and why?

David Smith: I’d just like to make one little comment on what you just said. That person is always operating under poor advice to try the mining companies first. If we were having this conversation 20 years ago it would be that way. But where we are now, with the financial crisis that we have going on and the demand by central banks and individuals for gold, if they were to do what he was suggesting, he might do very well on the mining stocks over the next year or two, but find himself unable to buy gold and silver at anything like the prices that exist currently. That’s a double reason why not to turn that idea on its head, in addition to what you just stated.

Maurice Jackson: Well, I’ll take you one step further. If we go back to March, I received a huge influx, of course, from several individuals that want to purchase physical precious metals, and their biggest complaint was the premiums. When you have a market condition that will support mining companies at a high level, as you just referred to, yes, I can only imagine now what the premiums will be for the physical precious metal. Because remember, [with] the mining companies, you’re not owning the metal—it’s more as a derivative of the metal in some regards. Again, very responsible words.

I’m sorry, were there any companies that have your attention at the moment that you’d like to share with us?

David Smith: I could give you a few and what I’d like to do, Maurice, is just to preface my answer by saying that the stocks that I mention, in the spirit of looking over my shoulder, they appeal to me; I hold most of them. I fully understand their stories and I’m willing to accept the risks, and there are always risks that owning companies in this sector involve. They tend to appreciate more rapidly than the metal, although they have not done so in recent years. I think that’s changing. But that’s because they involve greater risks. Readers need to perform their due diligence and see if any of them fit their financial situation, their risk profile, their goals and their time frame.

Having said that, these are some that I like and hold. I very much like and hold shares in Alexco Resource Corp. (AXU:NYSE.MKT; AXR:TSX); it’s up in the Yukon, Keno Hill. First Majestic Silver Corp. (FR:TSX; AG:NYSE; FMV:FSE) in Mexico. Endeavour Silver Corp. (EDR:TSX; EXK:NYSE; EJD:FSE), also in Mexico, which I regard as a turnaround to reaching earlier high-performance status play. Novo Resources Corp. (NVO:TSX.V; NSRPF:OTCQX) in Australia, Irving Resources Inc. (IRV:CSE; IRVRF:OTCBB) in Japan, and Great Bear Resources Ltd. (GBR:TSX.V; GTBDF:OTCQX) in the Red Lake area of Ontario. And I also very much like a new one that we have researched called Omineca Mining and Metals Ltd. (OMM:TSX.V; OMMSF:OTCMKTS), which is likely to be soon producing in Canada’s Caribou District.

And as a final mention, this [is] one I’m just starting to look into but it is intriguing and I want to look further. This one is called Metallic Minerals Corp. (MMG:TSX.V; MMNGF:OTCMKTS), and it’s up in Yukon’s Keno Hill, and not too far from Alexco. I haven’t taken a position yet, but I like their business plan and I like the fact that they’re in an area that hosts extremely high-grade silver deposits, and especially the fact that they put out for acquisition by others a couple of royalty properties. And, as you know, exploration companies don’t generally have revenue until they develop something or sell it. If Metallic can get one or two streams going, that would provide income to help offset their burn rate during the exploration, so I’ll be looking more deeply into that one.

Maurice Jackson: Well, thank you for sharing that with us, sir. In closing, what keeps you up at night that we don’t know about?

David Smith: I’ll tell you, the horrifying and sickening video of the cop pressing his leg against George Floyd’s neck, leading into his death, is a stark metaphor of what we’re facing today for most Americans, regardless of skin color, age or social status. If we allow the government systemic oppression to continue pressing against our necks, then how much better than George Floyd is our collective fate going to be?

Over the next few years, the people listening to your shows and reading your work will have the potential to make very large profits from the metals and miners as the precious bull run goes higher. But if we don’t get down to business and adopt some of the solutions that Thomas Paine lays out so clearly and forcefully in “Common Sense 2.0,” being correct about the markets isn’t going to make up for the other things that won’t be going right in their lives.

My advice is to get this book and read it several times. It’s only 100 pages long. Think deeply about what it has to say and then ask yourself, “How can I play a part in the positive solutions ‘Common Sense 2.0’ lays out?” There’s a saying down in Texas about people who are not what they pretend to be. It goes, “He’s all hat and no cattle.” Well, in my considered opinion, this Thomas Paine writer, whoever he or she is, with this little “Common Sense 2.0” book, proves that he’s all cattle.

Maurice Jackson: I couldn’t have said it better. Yeah, just to share with someone the labor intent to put into this, it’s not much time. I would feel comfortable giving this to an eighth-grader and their horizons will expand beyond their peers, because then they can look at other information that they’re exposed to regularly, and be able to question it properly, think it through, and realize the bovine feces that they’re being presented, because they’re not presented with the right information. And again, you’ve referenced the book several times here, “Common Sense 2.0”.

Last question, sir. What did I forget to ask?

David Smith: I don’t want to leave this point you just made, Maurice. . .[What] I learned, after as many years in a public school system and then later online instructing at the university level and high school level, is that a person who knows what they’re talking about should be able to explain their value proposition and their argument in ways that will be understandable to someone of any age. So that eighth-grader, or even someone in the third grade, should be able to understand an argument that is being made as well as someone in an Ivy League university, [to understand] the type of things that Thomas Paine here is talking about. And I believe that author has successfully done that and shows a great grasp of the issues and the ability to communicate that information to people of all different age levels.

And the answer to your question, “What did I forget to ask?” Let me say this. You might ask me if I’m an optimist, which I am. Despite all that seems to be going wrong in the world today, I believe that if enough people in our country come to understand the real reasons behind our disease, which implies a lack of being at ease and deciding to do something about it, then we can turn things around and create a future for our children. . .that they could grow and flourish in.

And for my money, this little book that we’ve been talking about is a Rosetta Stone for getting the job done in a way that we can all look back on and be proud—that we were willing to step up to the play and to tackle.

Winston Churchill famously said: “Americans always do the right thing after they’ve tried everything else.” This time let’s prove Winston Churchill wrong and stop doing things that don’t work right now. Thomas Paine has the solutions you need to accomplish it. And one of the things he mentioned is using a gold and silver-based coin, which would have the same denomination in any country in the world and have a certain number of grams of gold and silver in it. And that idea alone is worth the price of the book, and blew me away when I read it. So he saved the best for last and that’s in there, well stated.

Maurice Jackson: Yes, and it’s ingenious. All right, well, sir, how can someone find out more about your work?

David Smith: Well, I work with David Morgan of The Morgan Report—themorganreport.com. I’ve been working with him for almost two decades now. The Morgan Report is not the largest subscriber-based [report] in the field, but it’s read by investors of all experience levels, as well as large trading funds. Most of our subscribers have been with us for years. Each month we deliver information and perspectives designed to enable our readers to add to their knowledge base and make good decisions.

The TMR Asset Allocation tables help subscribers put together a risk-based portfolio that works for them, as this historic gold, silver, and mining share bull run gathers strength. David has profiled more exploration plays that went on to become producing mines than any other letter we know of. His monthly editorials are worth the subscription price alone, and he has a free letter. And for any of this, just go to The Morgan Report.

Maurice Jackson: Hands down, as I shared earlier, it is my favorite newsletter, period. And it’s not about—you referenced quality and quantity—forget quantity, it’s about quality. The quality work there, and the education that you see the commentary on, it’s astounding. You can’t beat the price.

And in reference to price, by the way, something we didn’t share, and in case someone may be under the impression, we do not benefit from you purchasing “Common Sense 2.0.” I just want to make sure that we’re clear on that. That is just a book that we’re referencing, that we have enjoyed and we’ve benefited from and we believe that you will benefit from.

David Smith: That is correct, Maurice. I ordered that from Amazon when I saw it. I got it in the mail on my dime. And if people read this, and if enough people read it to make a difference, that’ll be a payment in my bank account, my financial bank account of doing good things that will be more beneficial than any check that somebody could write to me.

Maurice Jackson: Mr. Smith, it’s been quite a delight to finally have you in our program. We wish you the absolute best and thank you for joining us today on Proven & Probable.

David Smith: And you’re entirely welcome, and the pleasure has been mine.

And as a reminder, I’m a licensed representative for Miles Franklin Precious Metals Investments, where we provide a number of options to expand your precious metals portfolio from physical delivery, off-shore depositories, and precious metal IRAs. Call me directly at 855-505-1900 or you may email maurice@milesfranklin.com.

And finally, please subscribe to provenandprobable.com, where we provide mining insights and bullion sales.

Maurice Jackson is the founder of Proven and Probable, a site that aims to enrich its subscribers through education in precious metals and junior mining companies that will enrich the world.

Sign up for our FREE newsletter at: www.streetwisereports.com/get-news

Disclosure:
1) Maurice Jackson: I, or members of my immediate household or family, own shares of the following companies mentioned in this article: Novo Resources, Metallic Minerals, Irving Resources. I personally am, or members of my immediate household or family are, paid by the following companies mentioned in this article: None. My company has a financial relationship with the following companies mentioned in this article: Metallic Minerals, Irving Resources and Novo Resources are sponsors of Proven and Probable. Proven and Probable disclosures are listed below.
2) David Morgan: I, or members of my immediate household or family, own shares of the following companies mentioned in this article: Novo Resources, Metallic Minerals, Alexco Resources, First Majestic Silver Corp., Endeavour Silver Corp., Great Bear Resources, Irving Resources and Omineca Mining and Metals.
3) The following companies mentioned in this article are billboard sponsors of Streetwise Reports: Metallic Minerals and Omineca Mining and Metals. Click here for important disclosures about sponsor fees. As of the date of this article, an affiliate of Streetwise Reports has a consulting relationship with Metallic Minerals and Omineca. Please click here for more information.
4) Statements and opinions expressed are the opinions of the author and not of Streetwise Reports or its officers. The author is wholly responsible for the validity of the statements. The author was not paid by Streetwise Reports for this article. Streetwise Reports was not paid by the author to publish or syndicate this article. The information provided above is for informational purposes only and is not a recommendation to buy or sell any security. Streetwise Reports requires contributing authors to disclose any shareholdings in, or economic relationships with, companies that they write about. Streetwise Reports relies upon the authors to accurately provide this information and Streetwise Reports has no means of verifying its accuracy.
5) This article does not constitute investment advice. Each reader is encouraged to consult with his or her individual financial professional and any action a reader takes as a result of information presented here is his or her own responsibility. By opening this page, each reader accepts and agrees to Streetwise Reports’ terms of use and full legal disclaimer. This article is not a solicitation for investment. Streetwise Reports does not render general or specific investment advice and the information on Streetwise Reports should not be considered a recommendation to buy or sell any security. Streetwise Reports does not endorse or recommend the business, products, services or securities of any company mentioned on Streetwise Reports.
6) From time to time, Streetwise Reports LLC and its directors, officers, employees or members of their families, as well as persons interviewed for articles and interviews on the site, may have a long or short position in securities mentioned. Directors, officers, employees or members of their immediate families are prohibited from making purchases and/or sales of those securities in the open market or otherwise from the time of the interview or the decision to write an article until three business days after the publication of the interview or article. The foregoing prohibition does not apply to articles that in substance only restate previously published company releases. As of the date of this article, officers and/or employees of Streetwise Reports LLC (including members of their household) own shares of First Majestic Silver, Novo Resources, Irving Resources, Omineca Mining and Metals, and Metallic Minerals, companies mentioned in this article.

Proven and Probable LLC receives financial compensation from its sponsors. The compensation is used is to fund both sponsor-specific activities and general report activities, website, and general and administrative costs. Sponsor-specific activities may include aggregating content and publishing that content on the Proven and Probable website, creating and maintaining company landing pages, interviewing key management, posting a banner/billboard, and/or issuing press releases. The fees also cover the costs for Proven and Probable to publish sector-specific information on our site, and also to create content by interviewing experts in the sector. Monthly sponsorship fees range from $1,000 to $4,000 per month. Proven and Probable LLC does accept stock for payment of sponsorship fees. Sponsor pages may be considered advertising for the purposes of 18 U.S.C. 1734.

The Information presented in Proven and Probable is provided for educational and informational purposes only, without any express or implied warranty of any kind, including warranties of accuracy, completeness, or fitness for any particular purpose. The Information contained in or provided from or through this forum is not intended to be and does not constitute financial advice, investment advice, trading advice or any other advice. The Information on this forum and provided from or through this forum is general in nature and is not specific to you the User or anyone else. You should not make any decision, financial, investments, trading or otherwise, based on any of the information presented on this forum without undertaking independent due diligence and consultation with a professional broker or competent financial advisor. You understand that you are using any and all Information available on or through this forum at your own risk.

( Companies Mentioned: AXU:NYSE.MKT; AXR:TSX,
EDR:TSX; EXK:NYSE; EJD:FSE,
FR:TSX; AG:NYSE; FMV:FSE,
GBR:TSX.V; GTBDF:OTCQX,
IRV:CSE; IRVRF:OTCBB,
MMG:TSX.V; MMNGF:OTCMKTS,
NVO:TSX.V; NSRPF:OTCQX,
OMM:TSX.V; OMMSF:OTCMKTS,
)
The V-Recovery and Beyond

Joseph J. McAlinden of McAlinden Research Partners outlines his firm’s view of what post-pandemic recovery will look like for various markets and explains why the firm is in a minority that foresees a V-shaped recovery.

The Energy Report – Source: McAlinden Research for Streetwise Reports   06/17/2020

Summary: In the months since the COVID-19 crash began, stock prices have been on a wild ride in anticipation of a tsunami of poor economic data. However, some investors appear to be seeing the light at the end of the tunnel including McAlinden Research Partners (MRP). While most see a V-shaped recovery as doubtful, we feel that the combination of what appears to be limitless fiscal and monetary stimulus, combined with better than expected reopening data in a number of states, provides compelling reason to expect a V-shaped recovery.

A V or not a V; that is the question. At least for the moment. According to a majority of commentators, the answer is not a V. But MRP is in the distinct minority, still expecting a sharp economic rebound.

This content was delivered to McAlinden Research Partners clients on May 29.
To receive all of MRP’s insights in your inbox Monday–Friday, follow this link for a free 30-day trial.

And now new questions have arisen, in particular, how permanently the effects of the COVID-19 pandemic will affect long-term growth beyond the initial recovery, whatever its shape. Many notable sources have described scenarios of substandard economic growth for years to come irrespective of the shape of the recovery in the short run. Given the vigorous rebound of stock prices globally, the answers to both questions have critical implications for investor decision-making.

Bursting the Cable News Bubble

Even with the S&P 500 closing in on its pre-crash high, many have struggled to let their guard down. While that is understandable, given the slow reopening of many facets of the U.S. economy, the financial media, as always, has their own hands on the reigns of investor sentiment as well. In fact, one could argue that the media is wielding even more power these days amid quarantines, layoff, and office closures that have driven up TV viewership. Per Comcast, the average American household is now watching at least eight hours more per week. In early March 2020, the average household watched 57 hours of content per week. That’s now up to 66 hours a week. More to our point, the Comcast data shows an increase of up to 64% in consumption of news programming since the start of COVID-19.

A 2017 study out of New York University, estimating the size of the tilt in financial media coverage found that a greater amount of media coverage foreshadows declines in firms’ profitability and negative earnings surprises. The study specifically points out that a news story is approximately 22% more likely to be covered if it is negative.

One example that has been tossed around recently, especially in regard to Europe, is the South Sea Bubble, a 1720 rush for stock in the UK’s South Sea Company following the passage of a bill giving the company a monopoly on trade in South America. Long story short, South Sea’s stock rose so strongly that bullish sentiment exploded around virtually any publicly traded company. When the price of South Sea finally passed its peak, a liquidity crunch enveloped thousands of investors that had bought their shares on credit and the whole market crashed, taking the English economy with it.

Actual parallels between the COVID crash and the speculation-driven South Sea Bubble are sparse. While the South Sea Bubble was full of inflated valuations with no revenue to back them, most of the gains we’ve seen in equity prices are accumulating toward blue chips or other high-powered earners with healthy balance sheets. In the NASDAQ Composite, for instance, Barron’s recently reported that the index’s top 10 largest stocks (a list that includes all of the FAANGs, as well as other power players like Intel, Nvidia, and Cisco) have gained almost $900 billion, triple the sum of the 2,600 other companies.

Ben Bernanke, former Federal Reserve chairman, has warned against any kind of comparison to other crashes, like the Great Depression. In a recent speech to the Brookings Institution, Bernanke noted that the Depression was ultimately triggered by a financial meltdown and made worse by bad policy choices, including the decision by his Fed predecessors to raise interest rates.

Perhaps the most comparable event in modern economic history would be the Spanish flu epidemic of 1918–1920, a global pandemic that may have resulted in up to 500 million cases and at least 50 million dead. Writing for VoxEu, Carola Frydman, an economic historian at the Kellogg School of Management, alongside professor and finance researcher Efraim Benmelech, recently analyzed the effects of that pandemic, which was countered by “social distancing” measures similar to those we’ve adopted today. Despite the Spanish flu being unusually deadly for those in their 20s and 30s, the duo wrote that the economic fallout was “mostly modest and temporary,” despite an inevitable recession. The rebound of the U.S. economy in the aftermath set the stage for a strong decade of economic growth that followed. Much like today, the stock market recovered substantially amid the pandemic, with the Dow index increasing by 10.5% in 1918 and by 30.5% in 1919.

Why Do We See the V?

None of this is to say that we aren’t in very unique territory and very serious concerns about economic growth, corporate earnings, and the overall health of the global population are invalid. But a detailed analysis of available data shows many reasons to feel a bit more optimistic than certain sensationalist “experts” would lead many to believe. That demonstrable bias toward the negative might be part of explaining why just 25% of investors surveyed by Bank of America Merrill Lynch think the latest rally in stocks is part of a new bull market. An even smaller group of just 10% is buying a V-shaped recovery.

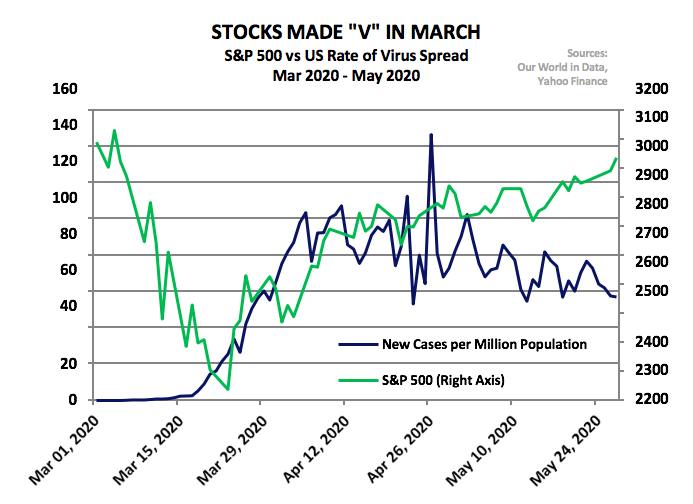
While MRP remains cautious of a W-shape in equities, which could follow an inevitable barrage of shocking economic data for the first and second quarters, we remain steadfastly entrenched in the V-shaped camp when it comes to the economic recovery, as we first noted back in March.

Aside from the aforementioned rebound we’ve already seen in stock prices, as the S&P 500 has surged 25% since its March trough, V shapes have already been forming in several other corners of the economy.

Data from Redfin showed a “stunning” rebound in housing market activity over the last month, as homebuying demand is now 16.5% above pre-coronavirus levels while home values have seen accelerating growth. Mortgage applications to purchase a home rose 9% last week from the previous week and from a year earlier, according to the Mortgage Bankers Association’s seasonally adjusted index. It was the sixth straight week of gains and a 54% recovery since early April.

Though this resurgence has largely been led by existing home sales, particularly among millennials on the hunt for cut-rate mortgages on their first home, demand for housing at these low rates will eventually flow through to the market for new homes as well, especially with an ever-shrinking supply of homes for sale. Supply of homes for sale fell 19.7% year over year (yoy) last month, notching the lowest April inventory figure ever.

Though April housing starts actually dipped to their lowest level, it was also the severest month yet for lockdown and quarantine measures across the country, likely placing holds on construction and other activity related to homebuilders. Despite very rough data from the National Association of Home Builders (NAHB), homebuilder sentiment actually rose 7 points from 30 to 37—a modest improvement, but one that could mark the bottom for corona-induced damage to the housing market.

MRP added LONG Homebuilders to our list of themes in March and we believe, when lockdowns ease, tightness in the housing market will begin pushing homebuilders to new highs.

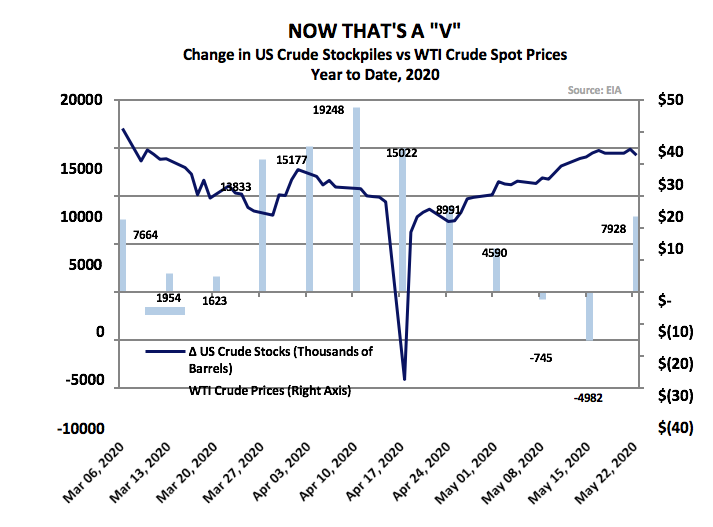
The price of crude oil, as well as gasoline and other refined products are also on the rise after falling into negative territory for the first time ever.

Demand in China, the world’s second largest consumer of crude oil, behind the U.S., crashed by about 20% as the country went into lockdown in February. Consumption of gasoline and diesel has fully recovered as factories reopen and commuters drive rather than use public transport. Bloomberg reports that consumption was at about 13 million barrels a day, just shy of the 13.4 million barrels a day of May 2019 and 13.7 million barrels a day of December 2019, led by an uptick in driving among Chinese commuters and travelers, an effort to avoid public transit. Earlier this month, MRP noted that same phenomenon ratcheting up miles driven across Europe and the U.S. as well.

The Wall Street Journal also covered the bullish turn for oil in the U.S. as the pickup in refiner demand to supply Americans getting back on the road has helped West Texas Intermediate’s (WTI’s) recovery. Pipeline flows from Cushing to Midwestern refiners are 400,000 barrels a day higher than they were in early April, according to commodity-market information provider Genscape. WTI crude prices closed last week out at a 10-week high after the Energy Information Administration (EIA) reported an oil inventory draw of nearly 5 million barrels for the week to May 15. Though this most recent week snapped a two-week decline inventories, output cuts across many U.S. shale fields are just beginning to be picked up in the data.

MRP also initiated LONG Crude Oil and U.S. Energy as a theme last month, on the back of global production cuts by Saudi Arabia and Russia, as part of a broader OPEC+ syndicate, and various non-OPEC producers across Europe and the Americas.

Perhaps the most critical signals of a rebound may be found in broader consumer data.

The preliminary reading of the University of Michigan’s consumer-sentiment survey in May edged up to 73.7 from 71.8 in April, beating economists’ forecast of a small decline. While the weekly gauge of consumer comfort from Bloomberg has continued to edge down, the latest decline was the smallest since the coronavirus-induced plunge started about a month and a half ago. Like the previous two examples, it looks like peak lockdown in the April-May period will likely coincide with the bottom of these data points.

The latest personal income data, released on Friday, showed a 10.5% surge month over month (mom) in April, the biggest rise on record and beating forecasts of a 6.5% decline. Though the latest core PCE (personal consumption expeditures) data fell to just 1% yoy, down from 1.7% in March, part of that could be chalked up to the personal savings rate hitting an all-time high of 33%, up from 12.7% in the month prior.

In the coming months, we expect the massive fiscal stimulus provided by the passage of March’s CARES Act, along with accompanying legislation, to be a much more powerful catalyst than many expect. The initial stimulus checks, ranging anywhere from $1,200 to $2,400 for most individuals and families (plus $500 per child), doled out $290 billion in direct payments, and has already proved to be an early buoy for spending on both durable and non-durable goods.

Among 6,000 people who received their checks by April 21, surveyed by economists from Columbia University, Northwestern University, the University of Chicago and the University of Southern Denmark, spending increased between $50 to $75 apiece on expenditures like food and non-durable goods in the first three days, while the purchase of durable goods increased by $20. That’s not much, but it was enough to get a number of executives, particularly those from major retailers including Target, Best Buy, Lowe’s, Home Depot and Walmart, talking about noticeable upticks in discretionary spending on their most recent earnings calls. Apple CEO Tim Cook reported a boost “across the board” in the wake of stimulus checks.

While the early data shows the uptick in consumer spending is only a moderate improvement, the largest share of stimulus recipients are apparently saving their checks for later. Per a separate survey from Ipsos and Axios, 38% said they chose to put their stimulus into savings, the most popular answer among survey respondents. While money being squirreled away into savings accounts in itself is not good news for spending, it’s actually good news for the health of many American consumers.

The more significant boost to American consumers is going to be the CARES Act’s federal enhancement to unemployment insurance—a provision adding $600 per week on top of a recipient’s state unemployment benefits until August. Because of this, Noah Williams, director of the Center for Research on the Wisconsin Economy at the University of Wisconsin-Madison, estimates that around 40% of all workers could theoretically earn more while unemployed than going back to work.

The effect of this will likely be twofold. First, those who are frictionally or acutely unemployed will not have their spending constrained too tightly by joblessness in the short term. Additionally, those looking to get back into work quickly could even benefit from the inflated benefits in bargaining for higher wages at their new jobs, raising average hourly earnings over the longer-term.

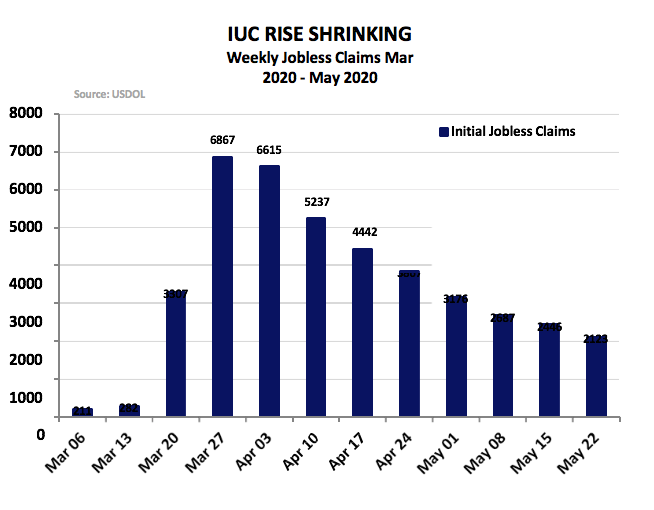
Even if employment is slow to surge back to the record highs the U.S. had seen before the outbreak of COVID-19, 80% of Americans remain employed today and the number of initial jobless claims have shrunk for eight consecutive weeks. While 40 million unemployed Americans is a tragic outcome, many had expected U.S. to be looking at a much worse employment situation than we are today.

When analyzing the data, the story seems to be a delay of demand among consumers as opposed to destruction of it. In fact, we could be looking at the most literal example of “pent-up demand” possible as most people are stuck at home, left with few places to buy, as opposed to few things they plan to buy.

What’s Driving the Stock Price Surge?

As mentioned earlier, stocks have rebounded strongly from their 30%+ crash in March. While the market has seen some of its best weeks in decades leading to a recent breakout above the 3,000 mark for the S&P 500, many investors remain cautious, questioning where the bullish sentiment is coming from and how sustainable the current rally really is.

Last month, a survey by Barron’s found only 39% of money managers say they’re bullish about the outlook for U.S. equities this year; 20% are bearish and 41% describe themselves as neutral.

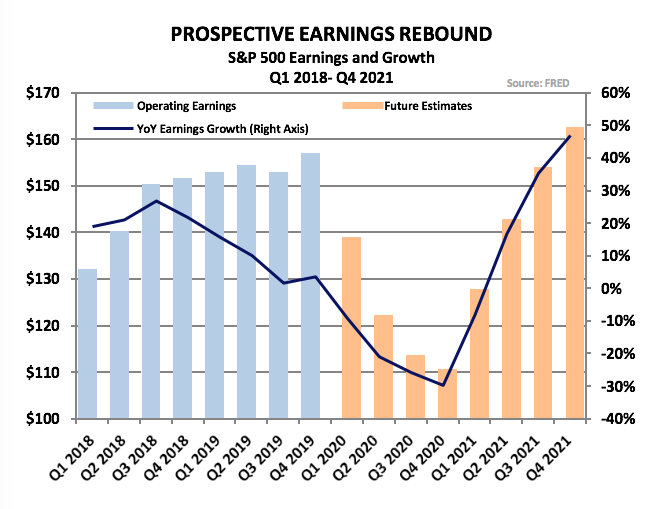
The S&P 500’s first quarter (Q1) earnings are expected to fall more than 9% versus the previous quarter, while the 12-months trailing P/E (price/earnings ratio) on the S&P 500 is likely to surpass 22, based on the latest earnings estimates from S&P indices (currently 95% of companies in the index have reported for the quarter), up from about 18 in Q1/2019. Earnings are expected to fall even further in Q2/2020, which would elevate the trailing P/E even more than it already has been if stock prices remain at current levels.

Upon further analysis, there are likely two forces sustaining this rally.

Though many in the aforementioned Barron’s poll were bearish for this year, 83% are bullish on stocks’ prospects for 2021, while a mere 4% say they are bears. Essentially, many investors are looking through the acute damage of the crisis and focusing on the light at the end of the tunnel in 2021. S&P indices estimates earnings for 2021 indicate double digit earnings growth in the second, third, and fourth quarters of the year.

This recovery in earnings will also help to depress price-earnings ratios. If we assume an S&P 500 worth 3,000 at the end of this quarter, the 12-months forward P/E would be about 21, still expensive, but only slightly higher than the four-year average of 20.

Along with improving expectations for 2021, we can probably chalk up some of the rising valuations to a surge of new accounts among millennial investors, rushing to take advantage of their first opportunity at bear market bargains.

Earlier this month, CNBC wrote that people earning between $35,000 and $75,000 annually increased stock trading by 90% more than the prior week after receiving their stimulus check, data show. Americans earning $100,000 to $150,000 annually increased trading 82% and those earnings more than $150,000 traded about 50% more often. “Securities trading” encompasses the buying and sells of stocks, ETFs (exchange-traded funds) or moving a 401k. Charles Schwab saw “monumental volumes” with a record 609,000 new accounts in Q1 and millennial-favored stock trading app Robinhood saw daily trades up 300% in March yoy. Robinhood also told CNBC “over half” of its customers are first-time investors.

Post-Lockdown Policy Expectations

As of last week, all states entered some phase of reopening, coinciding with a bit more optimism among economists and central bankers.

Georgia, one of the first states to begin reopening nonessential businesses at the end of April, has seen largely positive results in the wake of easing restrictions. CNN reports that the seven-day moving average of coronavirus cases steadily declined from late April until mid-May, a reflection of the earlier stay-at-home order. The moving average of cases then flattened at just over 500 new cases per day.

Per a recent JP Morgan study, almost all states have seen lower infection reproduction rates (R rates) after lockdown measures were lifted. This pattern of decline continued even when a lag period for new infections was accounted for. An R rate, or the average number of people who will become infected by one person with the virus, below 1.0 is a key indicator that the spread of the virus has been maintained. Just two states, Minnesota and North Dakota, had an R rate above 1.

Most importantly, JP Morgan said the current trajectory of the R rate shows a “second wave” of infections similar to the initial outbreak of coronavirus in the U.S. would be unlikely.

The better-than-expected data on the virus itself coincides with positive news on the monetary policy front.

Though the Fed never actively considered negative interest rates for the U.S., futures markets had been pricing them in until very recently. This rebound above zero shows that most traders are easing their expectations for the necessity of additional monetary relief.

Some at the Fed even believe we are already at the bottom of the COVID crash. Federal Reserve Bank of New York President John Williams recently told Bloomberg that “[b]ased on what we are seeing now, I think we are pretty close; maybe May or June will be the low point right now, based on the data we are seeing.”

However, it is worth noting that the bank is considering yield curve control as a final major action. Yield curve control, where a central bank caps yields on government bonds of a chosen maturity through potentially unlimited purchases, has been used by Japan and was recently adopted in Australia.

Yield curve control would also be a sign of lower for longer rates, a dovish turn for a Fed that had not so long ago expected 2020 to be a year of hikes.

Analyzing the Longer-Term Outlooks

A number of respected observers have suggested that secular growth will be impaired by longer-term consequences of the pandemic and the shutdown. Deglobalization, working from home, restricted travel and burgeoning debt are all thought to negatively affect economic growth beyond a few quarters of rebound. JP Morgan has dubbed the expected rebound and subsequent drag on economic output as “Bouncing to Malaise.” Others, like top economist Mohamed El-Erian of Allianz, described the longer-term outlook as part of a “new normal 2.0” that resembles the U.S.’s prolonged recovery from the financial crisis. Stanford economist Nicholas Bloom shares that view, expecting a 10% contraction in the economy and a deteriorated long-term outlook.

While El-Erian is correct in his assessments about the aftermath of the financial crisis, the slow growth and inflation of the late 2000s and early 2010s can be largely chalked up to reflexive (and sometimes excessive) regulations across the economy, enacted while the wounds of the 2008 financial crisis were still fresh and legislators more suggestible.

Though expectations for what kind of regulatory environment we’ll see in the future could be heavily dependent on the 2020 election season, it’s worth noting that the deregulatory trajetory the U.S. was on in 2017–2019 had certainly boosted growth and likely played a part in the rising wages that characterized the period.

Regardless, downbeat scenarios for the post-corona secular environment are certainly plausible, but once again, looking back might help us see what’s ahead.

It is certainly ironic that we are just about a century removed from the Spanish flu, but as we stated earlier, the human and financial resolve we saw following such a disaster suggests something far more positive could develop. Indeed, the economy plunged into a brief, but steep recession in the early portion of the next decade, but almost immediately following that recession’s trough, business activity surged into high gear and Americans Charlston-ed their way into the Roaring Twenties.

In a recent piece, Barron’s highlighted several important parallels between the 1920s and today. America entered both decades with lower taxes, high technological innovation, and a deregulatory regime. As Mark Twain is said to have remarked, “History does not repeat itself, but it does rhyme.” So, could a new Roaring Twenties be in the cards? It is certainly possible.

Beyond the immediate recovery, which we maintain will be V-shaped with the low point being mid-year, we also believe at the ensuing environment will be one of above average inflation and growth. Globalization contributed to slow job growth, stagnating wages in the U.S., along with helping to hold down inflation. The reverse Is likely to be true. As companies change supply chain arrangements and seek sources of supply closer to home (whether by choice or by mandate), domestic growth will benefit, wages should improve further and capital spending will have to accelerate.

So, although we are very concerned that the monster deficits and helicopter money will come back to haunt us eventually, we do believe that the stock markets move in the past two months is pointing the way to a strong post-corona environment—at least, for the next few years.

Joseph J. McAlinden, CFA, is the founder of McAlinden Research Partners (MRP) and its parent company, Catalpa Capital Advisors. He has 50 years of investment experience. Mr. McAlinden founded Catalpa Capital in March 2007 after leaving Morgan Stanley Investment Management, where he had spent 12 years, serving first as chief investment officer and later as chief global strategist. During his 10-year tenure as chief investment officer, he was responsible for directing MSIM’s daily investment activities and oversaw more than $400 billion in assets. As chief global strategist, he developed and articulated the firm’s investment policy and outlook. Prior to Morgan Stanley, Mr. McAlinden held positions as chief investment officer at Dillon Read and as president and CEO of Argus Research.

 McAlinden Research Partners

McAlinden Research Partners (MRP) provides independent investment strategy research to investors worldwide. The firm’s mission is to identify alpha-generating investment themes early in their unfolding and bring them to its clients’ attention. MRP’s research process reflects founder Joe McAlinden’s 50 years of experience on Wall Street. The methodologies he developed as chief investment officer of Morgan Stanley Investment Management, where he oversaw more than $400 billion in assets, provide the foundation for the strategy research MRP now brings to hedge funds, pension funds, sovereign wealth funds and other asset managers around the globe.


Sign up for our FREE newsletter at: www.streetwisereports.com/get-news

Disclosure:
1) McAlinden Research Partners disclosures are below.
2) The following companies mentioned in this article are billboard sponsors of Streetwise Reports: None. Click here for important disclosures about sponsor fees. The information provided above is for informational purposes only and is not a recommendation to buy or sell any security.
3) Statements and opinions expressed are the opinions of the author and not of Streetwise Reports or its officers. The author is wholly responsible for the validity of the statements. The author was not paid by Streetwise Reports for this article. Streetwise Reports was not paid by the author to publish or syndicate this article. Streetwise Reports requires contributing authors to disclose any shareholdings in, or economic relationships with, companies that they write about. Streetwise Reports relies upon the authors to accurately provide this information and Streetwise Reports has no means of verifying its accuracy.
4) This article does not constitute investment advice. Each reader is encouraged to consult with his or her individual financial professional and any action a reader takes as a result of information presented here is his or her own responsibility. By opening this page, each reader accepts and agrees to Streetwise Reports’ terms of use and full legal disclaimer. This article is not a solicitation for investment. Streetwise Reports does not render general or specific investment advice and the information on Streetwise Reports should not be considered a recommendation to buy or sell any security. Streetwise Reports does not endorse or recommend the business, products, services or securities of any company mentioned on Streetwise Reports.
5) From time to time, Streetwise Reports and its directors, officers, employees or members of their families, as well as persons interviewed for articles and interviews on the site, may have a long or short position in securities mentioned. Directors, officers, employees or members of their immediate families are prohibited from making purchases and/or sales of those securities in the open market or otherwise from the time of the interview or the decision to write an article until three business days after the publication of the interview or article. The foregoing prohibition does not apply to articles that in substance only restate previously published company releases.

McAlinden Research Partners:
This report has been prepared solely for informational purposes and is not an offer to buy/sell/endorse or a solicitation of an offer to buy/sell/endorse Interests or any other security or instrument or to participate in any trading or investment strategy. No representation or warranty (express or implied) is made or can be given with respect to the sequence, accuracy, completeness, or timeliness of the information in this Report. Unless otherwise noted, all information is sourced from public data.

McAlinden Research Partners is a division of Catalpa Capital Advisors, LLC (CCA), a Registered Investment Advisor. References to specific securities, asset classes and financial markets discussed herein are for illustrative purposes only and should not be interpreted as recommendations to purchase or sell such securities. CCA, MRP, employees and direct affiliates of the firm may or may not own any of the securities mentioned in the report at the time of publication.

UK holds rate, boosts asset purchases 100 bin pounds

By CentralBankNews.info

The central bank of the United Kingdom left its benchmark interest rate at essentially zero but raised its target for buying government bonds by another 100 billion pounds, saying further easing of monetary policy is warranted despite signs the contraction in the global and UK economy in the second quarter of this year will be less severe than it had expected in May.
Despite this sliver of optimism, the Bank of England (BOE) said the outlook was “unusually uncertain” as it depends on the evolution of the pandemic and downside risks to the global outlook remain, including the spread of Covid-19 virus within emerging markets and advanced economies.
The U.K. economy shrank by an annual 1.6 percent in the first quarter of this year, the largest decline since the end of 2009, and this drop in activity and rising spare capacity is putting downward pressure on inflation to well below the BOE’s target of 2.0 percent.
Consumer price inflation dropped to 0.5 percent in May from 0.8 percent in April and BOE said “a further easing of monetary policy is warranted to meet its statutory objectives.”
The Bank of England (BOE)’s monetary policy committee (MPC) unanimously agreed to keep the Bank Rate steady at 0.1 percent for the second time following two cuts in March, but voted 8-1 to raise the target for purchasing UK government bonds, financed by the issuance of reserves, by another 100 billion, taking the stock of total asset purchases to 745 billion pounds.
“The MPC will continue to monitor the situation closely and, consistent with its remit, stands ready to take further action as necessary to support the economy and ensure a sustained return of inflation to the 2% target,” it said, adding it would also continue to review its asset purchase program.
The BOE initially launched its asset purchase program, also known as quantitative easing, in March 2009 during the global financial crises. On March 19 this year, when it cut its bank rate to the current level, it also increased the purchase target by 200 billion pounds.
In its May monetary policy report, BOE published what it said were “plausible illustrative economic scenario,” given the uncertainties surrounding any forecasts. This included a very sharp fall in UK gross domestic product in the first half of this year and a sharp rise in unemployment that will push inflation significantly below its target given lower energy prices and weak demand.
BOE forecast the UK economic output would be some 30 percent lower in the second quarter of this year that at the end of 2019 as output would fall by around 3 percent in the first quarter and a further 25 percent in the second quarter.
Economic output would then pick up in the second half of the year but it will still take until the end of 2021 or early 2022 to return to its previous growth path.
Under the “illustrative scenario,” UK GDP would contract by 14 percent this year from 1.0 percent growth in 2019, but then bounce back to expand 15 percent in 2021 and 3.0 percent in 2022.
Consumer price inflation would drop to an average of 0.6 percent this year from 1.8 percent last year and the remain low at 0.5 percent in 2021 before rising to 2.0 percent in 2022 while the unemployment rate would average 8 percent this year and then 7 percent in 2021.
In April UK GDP shrank by around 20 percent following a 6 percent fall in March, but BOE said recent data suggest economic output has begun to recover as consumer spending and services output are picking up, supported by easier monetary and fiscal policy.
Payments data are also consistent with a recovery in consumer spending in May and June though payrolls data suggest the labour market has weakened materially and households are worried about their job security.

The Bank of England released the following statement:

“The Bank of England’s Monetary Policy Committee (MPC) sets monetary policy to meet the 2% inflation target, and in a way that helps to sustain growth and employment. In that context, its challenge at present is to respond to the severe economic and financial disruption caused by the spread of Covid-19.  At its meeting ending on 17 June 2020, the MPC voted unanimously to maintain Bank Rate at 0.1%. The Committee voted unanimously for the Bank of England to continue with the existing programme of £200 billion of UK government bond and sterling non-financial investment-grade corporate bond purchases, financed by the issuance of central bank reserves. The Committee voted by a majority of 8-1 for the Bank of England to increase the target stock of purchased UK government bonds, financed by the issuance of central bank reserves, by an additional £100 billion, to take the total stock of asset purchases to £745 billion.
Risky asset prices have recovered further from their March lows, although they have remained sensitive to news on the evolution of the pandemic.  Recent data outturns suggest that the fall in global GDP in 2020 Q2 will be less severe than expected at the time of the May Monetary Policy Report. There are signs of consumer spending and services output picking up, following the easing of Covid-related restrictions on economic activity. Recent additional announcements of easier monetary and fiscal policy will help to support the recovery. Downside risks to the global outlook remain, however, including from the spread of Covid-19 within emerging market economies and from a return to a higher rate of infection in advanced economies.
UK GDP contracted by around 20% in April, following a 6% fall in March. Evidence from more timely indicators suggests that GDP started to recover thereafter. Payments data are consistent with a recovery in consumer spending in May and June, and housing activity has started to pick up recently. The LFS unemployment rate was unchanged at 3.9% in the three months to April. But other and more timely indications from the claimant count, HMRC payrolls data and job vacancies suggest that the labour market has weakened materially. Following stronger than expected take-up of the Coronavirus Job Retention Scheme, a greater number of workers are likely to be furloughed in the second quarter. Evidence from business surveys and the Bank’s Agents is consistent with a weak outlook for employment in coming quarters. Some households are also worried about their job security.
Twelve-month CPI inflation declined from 1.5% in March to 0.8% in April, triggering the explanatory letter from the Governor to the Chancellor published alongside this monetary policy announcement. CPI inflation fell further in May, to 0.5%. Current below-target rates of CPI inflation can in large part be accounted for by the effects of the pandemic. The collapse in global oil prices has had direct effects on inflation, via the prices of motor fuels, and indirect effects by reducing input costs in other sectors of the economy. The sharp drop in domestic activity is also adding to downward pressure on inflation through increased spare capacity in most sectors of the economy.
The unprecedented situation means that the outlook for the UK and global economies is unusually uncertain. It will depend critically on the evolution of the pandemic, measures taken to protect public health, and how governments, households and businesses respond to these factors.
The emerging evidence suggests that the fall in global and UK GDP in 2020 Q2 will be less severe than set out in the May Report. Although stronger than expected, it is difficult to make a clear inference from that about the recovery thereafter. There is a risk of higher and more persistent unemployment in the United Kingdom. Even with the relaxation of some Covid-related restrictions on economic activity, a degree of precautionary behaviour by households and businesses is likely to persist. The economy, and especially the labour market, will therefore take some time to recover towards its previous path. CPI inflation is well below the 2% target and is expected to fall further below it in coming quarters, largely reflecting the weakness of demand.
At this meeting, the MPC judges that a further easing of monetary policy is warranted to meet its statutory objectives. The Committee agreed to increase the target stock of purchased UK government bonds by an additional £100 billion in order to meet the inflation target in the medium term. The Committee expects that programme to be completed, and the total stock of asset purchases to reach £745 billion, around the turn of the year.
The MPC will continue to monitor the situation closely and, consistent with its remit, stands ready to take further action as necessary to support the economy and ensure a sustained return of inflation to the 2% target. The Committee will keep the asset purchase programme under review.”


Quiet range trading in stocks and currencies

By Lukman Otunuga, Research Analyst, ForexTime

Markets remain fairly subdued after the weekly jobless claims data from across the pond remained above the one million level for the thirteenth straight week. The resurgence in coronavirus cases continues to upend bets of a swift economic recovery with the US stock markets snapping a three-day winning streak and the dollar slightly firmer into last week’s highs.

Three European central banks have met today with the Bank of England disappointing many who wanted more than the £100bn injection to its QE programme. Although taking a more optimistic view on the economy compared to the May meeting, downside risks remain which has left sterling vulnerable.

The Norges Bank raised its projections for growth and inflation while also lifting its rate path, and this has seen the Krone rally to one-week highs versus the euro. Meanwhile the Swiss Franc has barely budged, after the SNB pushed back against currency appreciation caused by the pandemic.

Pound in danger

The initial spike in sterling with the hawkish Bank of England headlines evaporated fairly quickly and cable has broken through the 100 day MA support at 1.2520.

Today’s close will be significant if prices can hold below the 50% retracement of the December high and March low in the 1.2460 area. Resistance above now resides at 1.2550 followed by the 1.26 zone.

EUR following broad USD sentiment

Focus will be on tomorrow’s EU leaders talks about the relief package as the ‘Frugal Four’ and others make their feelings known. The fiscal hawks prefer grants to loans, which may upset the current Euro ‘bonhomie’.

The single currency is trading in a narrow range with trend signals not suggesting a strong move in either direction. The 1.12-1.14 range does have a slightly bearish bias so watch the 1.12 level as strong support.

Disclaimer: The content in this article comprises personal opinions and should not be construed as containing personal and/or other investment advice and/or an offer of and/or solicitation for any transactions in financial instruments and/or a guarantee and/or prediction of future performance. ForexTime (FXTM), its affiliates, agents, directors, officers or employees do not guarantee the accuracy, validity, timeliness or completeness, of any information or data made available and assume no liability as to any loss arising from any investment based on the same.


Forex-Time-LogoArticle by ForexTime

ForexTime Ltd (FXTM) is an award winning international online forex broker regulated by CySEC 185/12 www.forextime.com

Trump’s reported Bitcoin instruction shows he is out of touch: deVere CEO

By George Prior

Trump’s reported instruction to the U.S Treasury Secretary to ‘go after Bitcoin’ highlights how “backward-looking and out-of-touch” he is, says the CEO of one of the world’s largest independent financial advisory and fintech organizations.

The slamming indictment from Nigel Green, the chief executive and founder of deVere Group, follows revelations in the new book by former national security adviser John Bolton.

In ‘The Room Where It Happened’, Bolton says he heard Donald Trump tell Treasury Secretary Steven Mnuchin to “go after Bitcoin.”

Mr Green says: “It is highly likely that Trump did, indeed, launch an attack on Bitcoin. Last summer, he went on a Twitter tirade lambasting the world’s largest cryptocurrency.

“Assuming the instruction to the Treasury Secretary is true, it highlights how backward-looking and out-of-touch the current U.S. President is on this issue.”

He continues: “Cryptocurrencies, such as Bitcoin, are becoming almost universally regarded the future of money.

“Why? Because of the staggering pace of the digitalization of our lives and cryptocurrencies are digital by their very nature.

“They’re also borderless, making them perfectly suited to the world of commerce, trade, and the movement of people.”

He goes on to add: “The serious coronavirus-triggered global recession, like the crash of 2008/2009,  has created a loss of trust in governments, central banks and legacy financial institutions, leaving the door open for the immutable blockchain technology that powers cryptocurrencies.

“In addition, it comes down to demographics. Younger generations, such as Millennials and Gen Z, are digital natives and more likely to hold crypto assets. If demographics are on your side, the future probably is, too.

“Another important indicator is that institutional investors are increasing their exposure to crypto all the time, bringing with them their institutional expertise, clout and capital.”

The deVere CEO concludes: “For the leader of the world’s largest economy to want ‘to go after’ Bitcoin paints him as King Canute trying to turn back the tide.”

About:

deVere Group is one of the world’s largest independent advisors of specialist global financial solutions to international, local mass affluent, and high-net-worth clients.  It has a network of more than 70 offices across the world, over 80,000 clients and $12bn under advisement.

Japanese Candlesticks Analysis 18.06.2020 (EURUSD, USDJPY, EURGBP)

Article By RoboForex.com

EURUSD, “Euro vs. US Dollar”

As we can see in the H4 chart, after completing the pullback close to the support level, EURUSD has formed a Doji pattern. Right now, the pair may start reversing. The downside target remains at 1.1155. At the same time, there is another scenario, which implies that the price may continue trading upwards without testing the support level at 1.1155.

EURUSD
Risk Warning: the result of previous trading operations do not guarantee the same results in the future

USDJPY, “US Dollar vs. Japanese Yen”

As we can see in the H4 chart, after testing the support area again and forming a Hammer pattern, USDJPY is reversing. The current situation implies that the market may resume the ascending tendency towards 107.65. Still, there is an opposite scenario, which says that the instrument may break the support area and continue trading downwards to reach 106.45.

USDJPY
Risk Warning: the result of previous trading operations do not guarantee the same results in the future

EURGBP, “Euro vs. Great Britain Pound”

As we can see in the H4 chart, after testing the rising channel’s downside border one more time and forming a Harami pattern, EURGBP is still reversing. The upside target is at 0.9025. After that, the instrument may resume the ascending tendency and update its highs. However, there might be another scenario according to which the instrument may fall and return to 0.8920.

EURGBP

Article By RoboForex.com

Attention!
Forecasts presented in this section only reflect the author’s private opinion and should not be considered as guidance for trading. RoboForex LP bears no responsibility for trading results based on trading recommendations described in these analytical reviews.

Ichimoku Cloud Analysis 18.06.2020 (EURUSD, USDJPY, XAUUSD)

Article By RoboForex.com

EURUSD, “Euro vs US Dollar”

EURUSD is trading at 1.1247; the instrument is moving below Ichimoku Cloud, thus indicating a descending tendency. The markets could indicate that the price may test the cloud’s downside border at 1.1260 and then resume moving downwards to reach 1.1115. Another signal in favor of further downtrend will be a rebound from the descending channel’s upside border. However, the bearish scenario may be canceled if the price breaks the cloud’s upside border and fixes above 1.1305. In this case, the pair may continue growing towards 1.1395.

EURUSD
Risk Warning: the result of previous trading operations do not guarantee the same results in the future

USDJPY, “US Dollar vs Japanese Yen”

USDJPY is trading at 106.87; the instrument is moving below Ichimoku Cloud, thus indicating a descending tendency. The markets could indicate that the price may test Tenkan-Sen and Kijun-Sen at 107.05 and then resume moving downwards to reach 106.25. Another signal is favor of further downtrend will be a rebound from the descending channel’s upside border. However, the bearish scenario may no longer be valid if the price breaks the cloud’s upside border and fixes above 107.55. In this case, the pair may continue growing towards 108.45.

USDJPY
Risk Warning: the result of previous trading operations do not guarantee the same results in the future

XAUUSD, “Gold vs US Dollar”

XAUUSD is trading at 1727.00; the instrument is moving above Ichimoku Cloud, thus indicating an ascending tendency. The markets could indicate that the price may test the cloud’s upside border at 1720.00 and then resume moving upwards to reach 1755.00. Another signal in favor of further uptrend will be a rebound from the support level. However, the bullish scenario may no longer be valid if the price breaks the cloud’s downside border and fixes below 1710.00. In this case, the pair may continue falling towards 1675.00. To confirm further growth, the asset must break the upside border of the Triangle pattern and fix above 1735.00.

XAUUSD

Article By RoboForex.com

Attention!
Forecasts presented in this section only reflect the author’s private opinion and should not be considered as guidance for trading. RoboForex LP bears no responsibility for trading results based on trading recommendations described in these analytical reviews.

The Analytical Overview of the Main Currency Pairs on 2020.06.18

by JustForex

The EUR/USD currency pair

Technical indicators of the currency pair:
  • Prev Open: 1.12620
  • Open: 1.12419
  • % chg. over the last day: -0.17
  • Day’s range: 1.12249 – 1.12613
  • 52 wk range: 1.0777 – 1.1494

There is an ambiguous technical pattern on the EUR/USD currency pair. The trading instrument is currently consolidating. The key support and resistance levels are 1.1215 and 1.1265, respectively. The demand for risky assets is still low. Investors are concerned about the growing number of new cases of COVID-19 virus. The number of infected around the world has exceeded 8.3 million. We expect important economic reports from the US. A further drop in EUR/USD quotes is possible. We recommend opening positions from key levels.

The Economic News Feed for 2020.06.18:
  • – Initial jobless claims in the US at 15:30 (GMT+3:00);
  • – Philadelphia Fed manufacturing index at 15:30 (GMT+3:00).
EUR/USD

Indicators do not give accurate signals: the price is consolidating near 50 MA.

The MACD histogram is near the 0 mark.

Stochastic Oscillator is near the overbought zone, the %K line has crossed the %D line. There are no signals at the moment.

Trading recommendations
  • Support levels: 1.1215, 1.1190, 1.1160
  • Resistance levels: 1.1265, 1.1290, 1.1325

If the price fixes below the level of 1.1215, a further fall in EUR/USD quotes is expected. The movement is tending to 1.1180-1.1150.

An alternative could be the growth of the EUR/USD currency pair to 1.1300-1.1340.

The GBP/USD currency pair

Technical indicators of the currency pair:
  • Prev Open: 1.25718
  • Open: 1.25400
  • % chg. over the last day: -0.16
  • Day’s range: 1.25150 – 1.25668
  • 52 wk range: 1.1466 – 1.3516

GBP/USD quotes are consolidating. The technical pattern is ambiguous. Financial market participants have taken a wait-and-see attitude before today’s meeting of the Bank of England. It is expected that the regulator will keep the key marks of monetary policy at the same level. We recommend paying attention to the comments by the Central Bank representatives. At the moment, the local support and resistance levels are 1.2510 and 1.2565, respectively. Positions should be opened from these marks.

At 14:00 (GMT+3:00), the Bank of England will announce its interest rate decision.

GBP/USD

Indicators signal the power of sellers: the price has fixed below 50 MA and 100 MA.

The MACD histogram is in the negative zone, which indicates the development of bearish sentiment.

Stochastic Oscillator is in the neutral zone, the %K line has crossed the %D line. There are no signals at the moment.

Trading recommendations
  • Support levels: 1.2510, 1.2455, 1.2400
  • Resistance levels: 1.2565, 1.2610, 1.2675

If the price fixes below 1.2510, a further drop in GBP/USD quotes is expected. The movement is tending to 1.2460-1.2400.

An alternative could be the growth of the GBP/USD currency pair to 1.2610-1.2650.

The USD/CAD currency pair

Technical indicators of the currency pair:
  • Prev Open: 1.35420
  • Open: 1.35710
  • % chg. over the last day: +0.16
  • Day’s range: 1.35456 – 1.36091
  • 52 wk range: 1.2949 – 1.4668

The USD/CAD currency pair is still being traded in a flat. There is no defined trend. At the moment, the local support and resistance levels are 1.3540 and 1.3615, respectively. Investors expect additional drivers. Economic reports from the United States are in the focus of attention. We also recommend paying attention to the dynamics of oil quotes. Positions should be opened from key levels.

The news feed on Canada’s economy is calm enough.

USD/CAD

Indicators do not give accurate signals: the price has crossed 50 MA.

The MACD histogram is near the 0 mark.

Stochastic Oscillator is in the oversold zone, the %K line has crossed the %D line. There are no signals at the moment.

Trading recommendations
  • Support levels: 1.3540, 1.3510, 1.3455
  • Resistance levels: 1.3615, 1.3680

If the price fixes below 1.3540, USD/CAD quotes are expected to fall. The movement is tending to 1.3500-1.3470.

An alternative could be the growth of the USD/CAD currency pair to 1.3660-1.3690.

The USD/JPY currency pair

Technical indicators of the currency pair:
  • Prev Open: 107.292
  • Open: 107.003
  • % chg. over the last day: -0.31
  • Day’s range: 106.701 – 107.074
  • 52 wk range: 101.19 – 112.41

The technical pattern is still ambiguous on the USD/JPY currency pair. USD/JPY quotes continue to be traded in flat. At the moment, the local support and resistance levels are 106.60 and 107.15, respectively. The demand for “safe-haven” currencies is still high. Today, we recommend paying attention to economic releases, as well as to the dynamics of US government bonds yield. Positions should be opened from key levels.

The news feed on Japan’s economy is calm.

USD/JPY

Indicators do not give accurate signals: the price is consolidating near 50 MA.

The MACD histogram is in the negative zone, but above the signal line, which gives a weak signal to sell USD/JPY.

Stochastic Oscillator is in the overbought zone, the %K line has crossed the %D line. There are no signals at the moment.

Trading recommendations
  • Support levels: 106.60, 106.00
  • Resistance levels: 107.15, 107.65, 108.20

If the price fixes below 106.60, USD/JPY quotes are expected to fall. The movement is tending to the round level of 106.00.

An alternative could be the growth of the USD/JPY currency pair to 107.60-107.90.

by JustForex

Will the second wave of Covid-19 end the current rally?

By Hussein Sayed, Chief Market Strategist (Gulf & MENA), ForexTime

It has been one hundred days since the WHO declared the coronavirus outbreak a pandemic. During this time, we experienced the worst sell-off and fastest recovery in stock market history. But the biggest lesson learnt over this period was that old rules no longer apply and many assets became detached from the traditional forces that drive them.

After a violent sell-off in March, governments and central banks came to the rescue led by the US Federal Reserve. Many economies will see their GDP’s shrink by the fastest rate on record in the second quarter, but valuations are near historic highs, particularly in the US. That is simply because market participants believe monetary and fiscal policies are solid enough to fill the gap for growth that has been lost.

The new story making headlines today is fear of a second wave in the coronavirus. Several US states have reported a surge in infection cases with California and Texas hitting a new record.  Meanwhile, millions of people in Beijing are now under lockdown restrictions again after more than 100 cases were reported, which are linked to a wholesale food market.

The belief that the global economy will swiftly recover during the third quarter is now uncertain. The faster economies reopen, the more likely we will see a second wave of infections translate into new lockdowns. Hence the path over the coming months will be murky.

Equity markets began to reflect this risk last week when the S&P 500 plunged 4.8%, but it quickly recovered some of these losses after the Fed announced it would start individual corporate bond purchases in secondary markets, as opposed to buying corporate-credit ETF’s.

Covid-19 and the Fed’s actions are influencing a herd mentality to financial markets where rational risk and reward calculations are no longer in place –  the first sign of trouble sees investors flee to safe havens, and when the Fed plays the put, they take the opposite side of the trade. This kind of environment will keep volatility heightened in the near-term.

In my opinion, the problem that the Fed and other central banks have caused over the past couple of months is that retail investors are bidding up some of the worst performing companies just because they believe the current policies will keep them afloat; the classic example being the car rental group Hertz in the US which declared bankruptcy last month. This is leading to the creation of a big bubble in asset prices and the further it grows, the more damage it will make when it bursts.

No one knows how all this will play out eventually, but we must understand from previous experiences that bubbles tend to grow much bigger before they burst, and there could be a lot of money to be made if the timing of your exit is right. Currently, the two forces in play are a second wave of Covid-19 cases and policy actions. The one which proves to have the stronger influence will lead the next move in markets, but you need a lot of courage to play this game.

Disclaimer: The content in this article comprises personal opinions and should not be construed as containing personal and/or other investment advice and/or an offer of and/or solicitation for any transactions in financial instruments and/or a guarantee and/or prediction of future performance. ForexTime (FXTM), its affiliates, agents, directors, officers or employees do not guarantee the accuracy, validity, timeliness or completeness, of any information or data made available and assume no liability as to any loss arising from any investment based on the same.


Forex-Time-LogoArticle by ForexTime

ForexTime Ltd (FXTM) is an award winning international online forex broker regulated by CySEC 185/12 www.forextime.com

DE30 Analysis: Improving German data bullish for DE30

By IFCMarkets

Improving German data bullish for DE30

Germany’s economic data of the last couple of weeks were not all bad. While trade and current account surplus fell more than forecast in April with factory orders dropping more than expected, construction activity contraction slowed in May and investors’ sentiment improved more than forecast for June. Thus, the construction PMI for May rose to 40.1 from 31.9 in April. Readings above 50 indicate expansion of activities in the sector, below 50 indicate contraction. And the ZEW indicator of economic sentiment for Germany increased for the third consecutive time reaching 63.4 for June from 51 in May when an increase to 60 was forecast. Both expectations and assessment of the current situation improved. The improvement in economic data is the result of reopening of economies after lockdown measures are being lifted gradually, as well as various stimulus measures. Thus, the European Council is meeting at the end of the week to discuss a recovery proposal by the bloc’s executive to raise 750 billion euros worth of debt to supplement spending worth 1.1 trillion euros in 2021-27. Positive data are bullish for DE30.

IndicatorVALUESignal
MACDBuy
StochasticNeutral
Donchian ChannelBuy
MA(200)Buy
FractalsBuy
Parabolic SARBuy


Summary of technical analysis

OrderBuy
Buy stopAbove 12431.28
Stop lossBelow 11806.85

Market Analysis provided by IFCMarkets