Technical Patterns, Future Expectations and More – Part I

By TheTechnicalTraders 

– We get a lot of questions from individuals every week. Our research posts contain a lot of varied examples of Technical Analysis, Economic Data Points, Advanced Price Theory, and other more obscure analysis techniques.  Yet, sometimes our readers want to know more – how do we read the tea leaves to try to adopt a consensus approach to trading, investing, and hedging the global markets at times like these?

The easiest answer is that we are a team of technical researchers and analysts.  Every day we are watching our proprietary modeling systems, various market symbols, and technical/price setups that occur throughout the globe.  Because we specialize in US stocks, ETFs, and Futures, our concern is how the US market will react to these impulses.  Having said that, we explore ideas about how capital will flow from one asset class to another over time as various rotations in the global market take place.

Every week, we communicate different points of view and do so across different time frames which provides you with a full view of long and short term expectations and potential moves for stocks and commodities.

Sometimes this can be confusing to follow if you don’t understand the time horizon we are discussing. One article may be about a major double top in the stock market with long term bearish implications, and the next article about more upside potential in stocks as the stock market tries to fill the February price gap window. One is bearish, the other is bullish, both provide a ton of insight for a different type of trader and time horizon looking forward.

The team is able to explore and identify any potential trade setup/trigger we believe is important for our future success.  Our team can identify short, intermediate, or longer-term setups in any symbol or market segment.  We then discuss the potential for each setup/trigger and attempt to validate the setup/trigger using our proprietary technology.  We focus on confirmed trade setups originating from a variety of proprietary technology solutions that are aligned with our researcher’s general analysis.

This keeps our team honed in on what is really happening in the markets as we attempt to identify the “Best Asset Now” related to potential risk and profit.  The one thing that many people don’t understand is how much we discuss “RISK”.  The first thing any of our researchers accomplish before they suggest a trade setup is a “Risk Analysis” related to the price structure and future expectations.  Our researchers may think a certain symbol or asset class is the greatest trade of the year, but risk factors associated with general market conditions, recent support/resistance levels, or volatility may disqualify that trade simply because we won’t allow anything to take excessive risks for our members. Our view is “there will always be another trade setting up in the next two or three days”.

Before you continue, we suggest taking a moment to read some of our other “bigger picture” research posts on silver, gold, and the US markets. Be sure to opt-in to our free market trend signals before closing this page so you don’t miss our next special report!

MARKET PERSPECTIVES

We are sharing some of our most recent research with all of you to help you understand how we view different market perspectives and opportunities as triggers set up in the US stock market.  We view some of these longer-term triggers as “bigger waves” that are setting up out in the ocean.  When they hit the shore, they have the potential of disrupting things quite extensively and causing quite a bit of damage. But until they hit the shoreline, they are just big waves that are pending in the future.

Our shorter-term systems help us navigate the smaller price rotations and are often what we fall back onto to confirm trade triggers.  If the bigger wave suggest greater risk is a factor, then we’ll adjust the targets and stops for our shorter-term triggers to help eliminate risk and turn the short-term trades into a  “scalping-type” of trade.  Quick in and out for 5% to 7% (or more) and then wait for the next setup.

In a broader sense, we are simply navigating the seas and tides while attempting to identify the best opportunities for our members.  We write about all types of technical and price pattern triggers – even economic data.  Internally, we focus on technical patterns and setups that are generated by our proprietary trading/modeling systems.  So, when you read any of our public research posts, remember that internally we may be viewing things quite differently as the technical and modeling systems are only deployed for subscribers or members.

MIRRORED 200 DAY MA SETUP

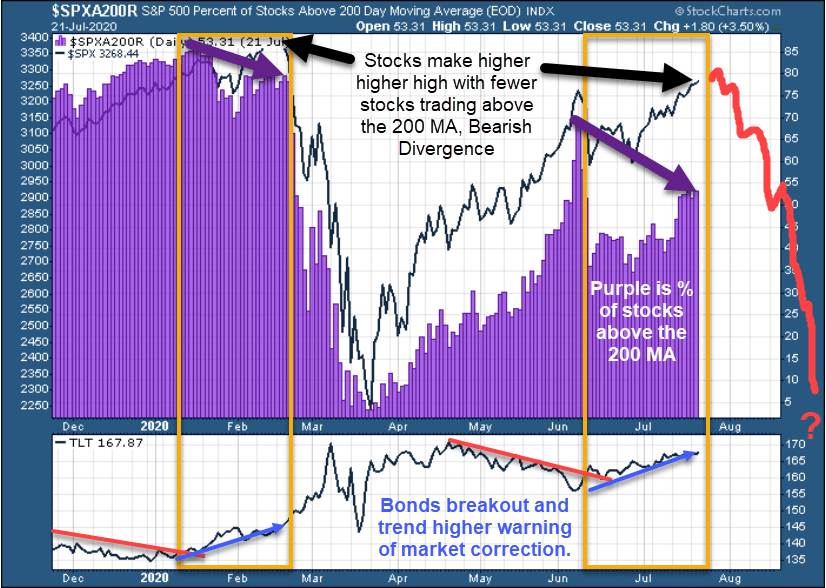
This first example highlights what we believe is a very clear longer-term setup relating to the general market weakness across a broad segment of the US stock market.  Back in February 2020, a similar type of pattern set up just before the February 24 collapse.  Now, we have a bigger and broader divergence between the number of stocks above their 200 Day Moving Average levels while Bonds (TLT) is climbing higher.  This, generally, warns that the markets are stalling and may settle into a downside price trend.

Could the downside price trend be aggressive and volatile?  You bet it could.  But right now we know this “big wave” is pending and we also know that risks seem rather high for a downside price correction given this technical pattern setup.

BEARISH DIVERGENCE

This second chart highlights the Jobless Claims levels over the past 6+ months of 2020.  The one thing we want to highlight is the moderate increase in the latest Jobless Claims level and how that may represent a “second wave” of COVID-19 cases prompting additional closures/shut-downs within the US economy in some states.  The last thing this recovery effort needs right now is another wave of newly unemployed workers and this data could become a very real problem when you consider the spending, housing, mortgage, credit card, and other factors that are associated with “a loss of income” for any active consumer.  There is a domino-process that is likely to take place if these workers are unable to find new jobs quickly.

JOBLESS CLAIMS STARTING TO RISE AGAIN…

Now, as we close out this first part of our Technical Patterns, Trading Perceptions, Future Expectations, and More research post, we want to ask you if you would do anything differently than we currently do to attempt to effectively trade and manage risk levels throughout these incredible times and price swings in the global markets?  Remember, we actually called these incredible price moves back in July/August 2019 (and earlier) with our Super-cycle research and other longer-term cycle analysis:

July 24, 2019: THE BLACK HOLE IN GLOBAL BANKING IS BEING EXPOSED

August 14, 2019: GLOBAL CENTRAL BANKS MOVE TO KEEP THE PARTY ROLLING

August 28, 2019: PRECIOUS METALS ABOUT TO PULL A CRAZY IVAN

Over the past 12 months, we’ve effectively called many of the biggest market moves and trends – in some cases many months in advance.  Our predictions related to precious metals have been highlighted on many other podcasts and segments.  We consider it an honor to be included in other’s interpretations and presentations – yet we also know the accuracy of our research is what really counts.

This brings us back to the start of this post – our efforts in generating these free research posts is to help you understand what we are thinking along different time horizons to help you develop your own consensus outcome.  We hope you are gaining real value from our efforts because we are not going to stop now – this is when you need us the most.  2020 through 2024 are going to include some of the biggest price swings we’ve seen in decades.

Get our Active ETF Swing Trade Signals or if you have any type of retirement account and are looking for signals when to own equities, bonds, or cash, be sure to become a member of my Passive Long-Term ETF Investing Signals which we are about to issue a new signal for subscribers.

Chris Vermeulen
Chief Market Strategist
Founder of Technical Traders Ltd.

NOTICE: Our free research does not constitute a trade recommendation or solicitation for our readers to take any action regarding this research.  It is provided for educational purposes only.  Our research team produces these research articles to share information with our followers/readers in an effort to try to keep you well informed.  Visit our web site (www.thetechnicaltraders.com) to learn how to take advantage of our members-only research and trading signals.
 

Dollar fights back; Gold steadies around $1950

By Lukman Otunuga, Research Analyst, ForexTime

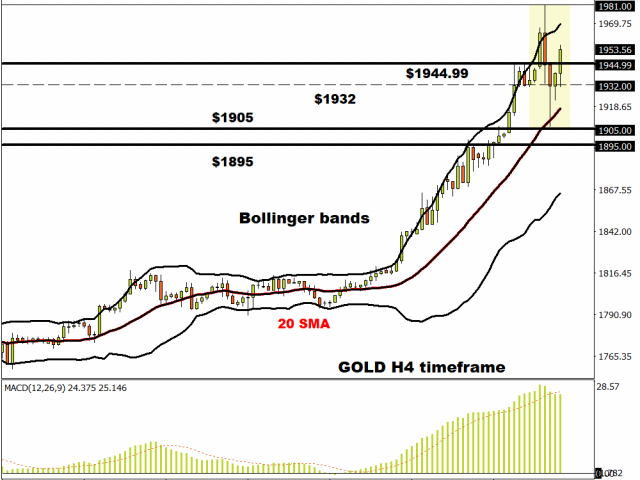
The mighty dollar is endeavouring to track higher for the first time in seven sessions after a sharp pullback in gold prices overnight and early in the European session. The yellow metal could not sustain highs above $1981 and collapsed after that new peak, before spiking lower again to $1907 on profit-taking. Bulls and bullion bank short covering have steadied the shiny ship however and we are trading above $1950 once more.

Gold futures (December contract) have touched $2,000 to attract the headlines, but a 10% advance over the past eight sessions does suggest some consolidation would be welcome for gold bugs. Of course, fundamentals are still glowing with low real yields, expansive fiscal and monetary policy, and diversification well-known and well supported.

The Republicans have put forward their latest relief package, but it does not have the Democrats support as yet so expect more delay and discussions with current support programs expiring soon. The Fed meeting takes centre stage tomorrow with the market expecting soothing dovish words from Chair Powell. A more sober assessment of reality, similar to what happened during the June meeting may hurt risk appetite.

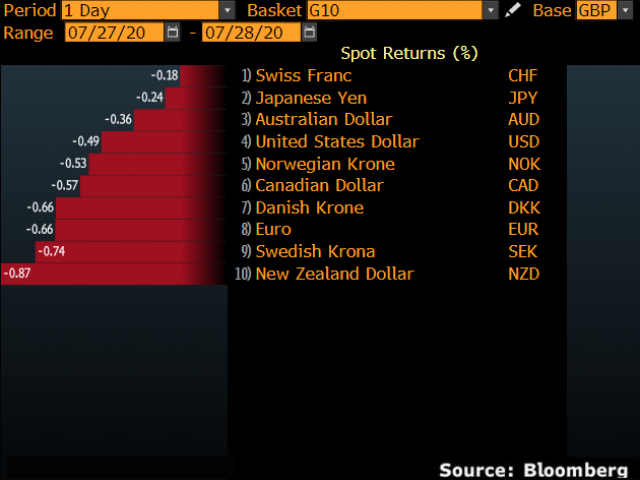
Sterling riding the Dollar weakness wave

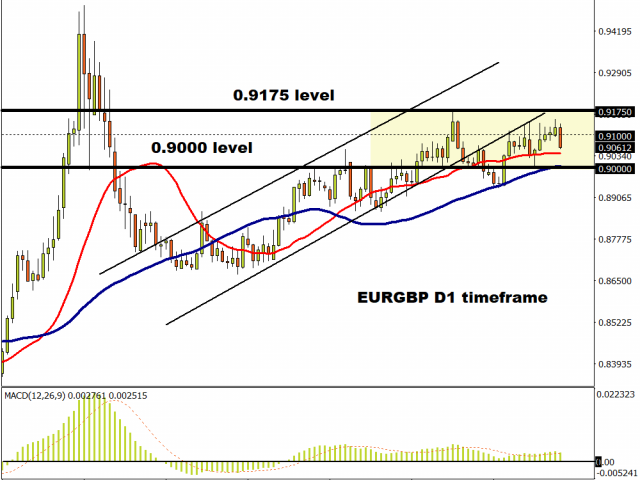
GBP is the strongest major today and is also fighting back against the Euro as EUR/GBP trades below 0.91. There appears to be quite a resistance zone around that level with the June high at 0.9175 above.

Lingering longer-term concerns around stalled trade talks and the government’s response to the pandemic are not hindering the pound at present. Eight straight days of gains versus the greenback is the most for any major so we should expect some retracement soon as momentum indicators are now overbought.

USD/JPY finally breaks the range

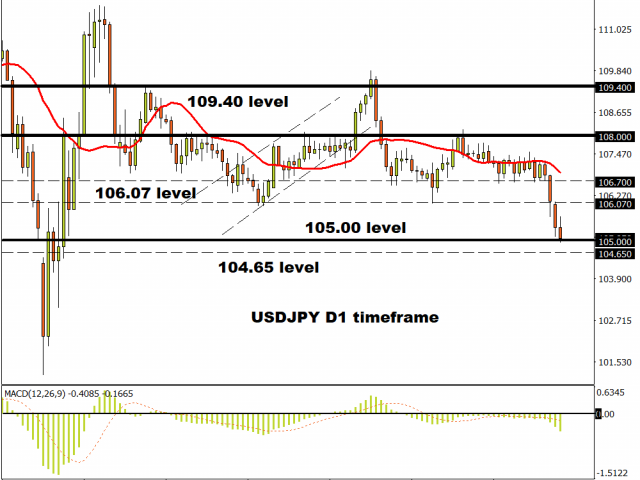
The downside break of DXY through the March low has pushed USD/JPY down past the recent cycle low at 106.07 and on towards 105. A break of this level would not be surprising due to the recent range trading with the next target at 104.65, but the pace of the decline may slow now as short-term conditions looks oversold. Resistance above lies around 106.30.

Disclaimer: The content in this article comprises personal opinions and should not be construed as containing personal and/or other investment advice and/or an offer of and/or solicitation for any transactions in financial instruments and/or a guarantee and/or prediction of future performance. ForexTime (FXTM), its affiliates, agents, directors, officers or employees do not guarantee the accuracy, validity, timeliness or completeness, of any information or data made available and assume no liability as to any loss arising from any investment based on the same.


Forex-Time-LogoArticle by ForexTime

ForexTime Ltd (FXTM) is an award winning international online forex broker regulated by CySEC 185/12 www.forextime.com

Murrey Math Lines 28.07.2020 (AUDUSD, NZDUSD)

Article By RoboForex.com

AUDUSD, “Australian Dollar vs US Dollar”

As we can see in the H4 chart, there has been a “false” breakout of 5/8. In this case, the pair is expected to fall and reach the support at 3/8. However, this scenario may be canceled if the price breaks 5/8 to the upside. After that, the instrument may continue growing towards the resistance at 6/8.

AUDUSD_H4
Risk Warning: the result of previous trading operations do not guarantee the same results in the future

In the M15 chart, the pair may break the downside line of the VoltyChannel indicator and, as a result, continue trading downwards.

AUDUSD_M15
Risk Warning: the result of previous trading operations do not guarantee the same results in the future

NZDUSD, “New Zealand Dollar vs US Dollar”

As we can see in the H4 chart, after breaking 5/8, NZDUSD is expected to continue trading upwards to reach the resistance at 7/8. However, this scenario may no longer be valid if the price breaks 5/8 to the downside. After that, the instrument may continue falling towards the support at 4/8.

NZDUSD_H4
Risk Warning: the result of previous trading operations do not guarantee the same results in the future

In the M15 chart, the pair may break the upside line of the VoltyChannel indicator and, as a result, continue moving upwards.

NZDUSD_M15

Article By RoboForex.com

Attention!
Forecasts presented in this section only reflect the author’s private opinion and should not be considered as guidance for trading. RoboForex LP bears no responsibility for trading results based on trading recommendations described in these analytical reviews.

Japanese Candlesticks Analysis 28.07.2020 (GOLD, NZDUSD, GBPUSD)

Article By RoboForex.com

XAUUSD, “Gold vs US Dollar”

As we can see in the H4 chart, the uptrend continues. After finishing an Engulfing pattern not far from the resistance level, XAUUSD may reverse and form a slight correction. Later, the price is expected to resume trading upwards. In this case, the upside target may be at 1990.00. At the same time, an alternative scenario implies that the pair may correct towards 1920.00 after updating the highs.

XAUUSD
Risk Warning: the result of previous trading operations do not guarantee the same results in the future

NZDUSD, “New Zealand vs. US Dollar”

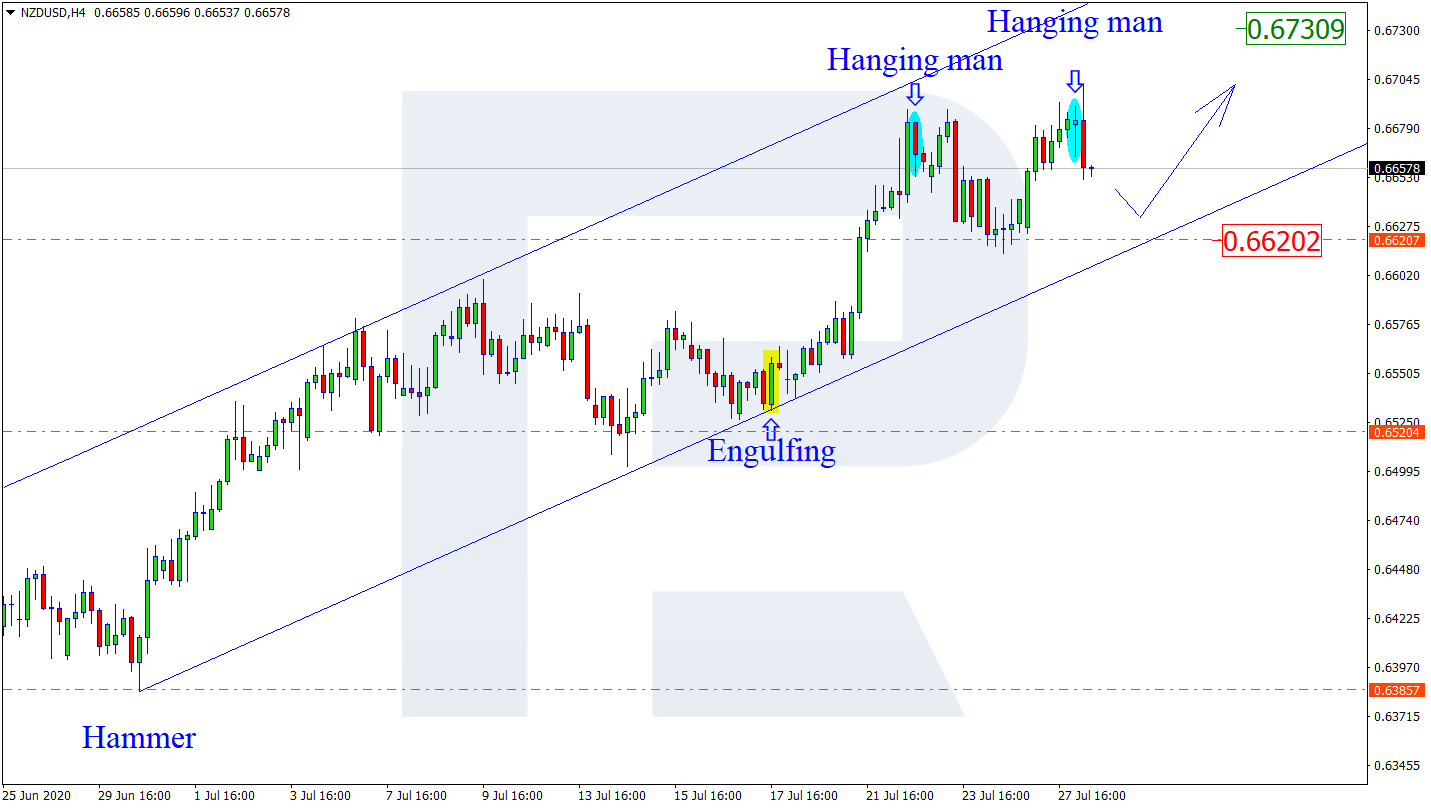
As we can see in the H4 chart, the ascending tendency continues. After forming a Hanging Man pattern close to the resistance level, NZDUSD has started reversing. At the moment, the price is expected to correct towards the support area at 0.6620. Later, the market may rebound from the area and resume growing to reach 0.6730. Still, there is another scenario, which suggests that the instrument may correct towards 0.6520.

NZDUSD
Risk Warning: the result of previous trading operations do not guarantee the same results in the future

GBPUSD, “Great Britain Pound vs US Dollar”

As we can see in the H4 chart, the pair is still forming the ascending channel. After forming a Shooting Star pattern close to the resistance level, GBPUSD has started reversing. At the moment, the price is expected to correct and fall towards 1.2788. However, there might be another scenario, according to which the price may continue trading upwards without reversing and correcting.

GBPUSD

Article By RoboForex.com

Attention!
Forecasts presented in this section only reflect the author’s private opinion and should not be considered as guidance for trading. RoboForex LP bears no responsibility for trading results based on trading recommendations described in these analytical reviews.

The Analytical Overview of the Main Currency Pairs on 2020.07.28

by JustForex

The EUR/USD currency pair

Technical indicators of the currency pair:
  • Prev Open: 1.16419
  • Open: 1.17456
  • % chg. over the last day: +0.87
  • Day’s range: 1.16987 – 1.17737
  • 52 wk range: 1.0777 – 1.1781

During yesterday’s trading session, the greenback weakened against the basket of world currencies. At the moment, the dollar index is stable. Investors have started partially fixing positions before the Fed meeting. On Monday, Senate Republicans unveiled a $1 trillion stimulus plan for the economy with the White House, laying the groundwork for negotiations with Democrats. At the moment, EUR/USD quotes are consolidating in the range of 1.1685-1.1740. A technical correction is possible in the near future. We expect economic reports from the US. We recommend opening positions from key levels.

The news feed on 2020.07.28:
  • – CB consumer confidence index in the US at 17:00 (GMT+3:00).
EUR/USD

Indicators do not give accurate signals: the price is testing 50 MA.

The MACD histogram has been declining, which indicates a possible correction of EUR/USD quotes.

Stochastic Oscillator is in the neutral zone, the %K line has crossed the %D line. There are no signals at the moment.

Trading recommendations
  • Support levels: 1.1685, 1.1625, 1.1580
  • Resistance levels: 1.1740, 1.1780, 1.1800

If the price fixes above 1.1740, further growth of EUR/USD quotes is expected. The movement is tending to 1.1780-1.1800.

An alternative could be a decline in the EUR/USD currency pair to 1.1640-1.1600.

The GBP/USD currency pair

Technical indicators of the currency pair:
  • Prev Open: 1.27854
  • Open: 1.28799
  • % chg. over the last day: +0.69
  • Day’s range: 1.28381 – 1.29043
  • 52 wk range: 1.1466 – 1.3516

The GBP/USD currency pair has become stable after prolonged growth. At the moment, the British pound is consolidating. Local support and resistance levels are 1.2840 and 1.2900, respectively. A technical correction is possible in the near future. Today we recommend paying attention to economic releases from the US. Positions should be opened from key levels.

The news feed on the UK economy is calm.

GBP/USD

Indicators signal the power of buyers: the price has fixed above 50 MA and 100 MA.

The MACD histogram is in the positive zone, but below the signal line, which gives a weak signal to buy GBP/USD.

Stochastic Oscillator is in the neutral zone, the %K line is above the %D line, which indicates the bullish sentiment.

Trading recommendations
  • Support levels: 1.2840, 1.2805, 1.2760
  • Resistance levels: 1.2900, 1.2950

If the price fixes above 1.2900, further growth in GBP/USD quotes is expected. The movement is tending to 1.2940-1.2960.

An alternative could be a decline in the GBP/USD currency pair to 1.2800-1.2770.

The USD/CAD currency pair

Technical indicators of the currency pair:
  • Prev Open: 1.34217
  • Open: 1.33544
  • % chg. over the last day: -0.47
  • Day’s range: 1.33313 – 1.33905
  • 52 wk range: 1.2949 – 1.4668

The USD/CAD currency pair is in a sideways trend. The technical pattern is ambiguous. Investors expect additional drivers. At the moment, the local support and resistance levels are 1.3340 and 1.3390, respectively. USD/CAD quotes are tending to recover. We recommend paying attention to the dynamics of “black gold” prices. Positions should be opened from key levels.

The news feed on Canada’s economy is calm.

USD/CAD

Indicators do not give accurate signals: the price is testing 50 MA.

The MACD histogram is near the 0 mark.

Stochastic Oscillator is in the overbought zone, the %K line has crossed the %D line. There are no signals at the moment.

Trading recommendations
  • Support levels: 1.3340, 1.3300
  • Resistance levels: 1.3390, 1.3440, 1.3480

If the price fixes below 1.3340, a further fall in USD/CAD quotes is expected. The movement is tending to 1.3310-1.3290.

An alternative could be a recovery of the USD/CAD currency pair to 1.3440-1.3480.

The USD/JPY currency pair

Technical indicators of the currency pair:
  • Prev Open: 106.015
  • Open: 105.372
  • % chg. over the last day: -0.58
  • Day’s range: 105.220 – 105.685
  • 52 wk range: 101.19 – 112.41

The bearish sentiment still prevails on the USD/JPY currency pair. The trading instrument has updated its local lows again. At the moment, USD/JPY quotes are consolidating. Local support and resistance levels are 105.40 and 105.80, respectively. The yen has the potential for further growth. We recommend paying attention to the dynamics of US government bonds yield. Positions should be opened from key levels.

Today, the news feed on Japan’s economy is calm.

USD/JPY

Indicators do not give accurate signals: the price is testing 50 MA.

The MACD histogram is near the 0 mark.

Stochastic Oscillator is in the neutral zone, the %K line is below the %D line, which indicates the bearish sentiment.

Trading recommendations
  • Support levels: 105.40, 105.10
  • Resistance levels: 105.80, 106.15, 106.45

If the price fixes below 105.40, a further drop in USD/JPY quotes is expected. The movement is tending to 105.10-104.80.

An alternative could be the growth of the USD/JPY currency pair to 106.10-106.30.

by JustForex

Brexit-worried Brits move to buy the weak dollar

By George Prior

Dollar weakness and fears of a pound plunge in a hard Brexit scenario are prompting a growing number of Britons to buy dollars, reveals the CEO of one of the world’s largest independent financial advisory organisations.

The comments from Nigel Green, chief executive and founder of deVere Group, which operates in 100 countries globally, follow the Dollar Index, which tracks the greenback against a basket of six other currencies, falling 0.5% on Monday, trading at levels not seen since May 2018.

The downside moves ahead of the Federal Reserve’s policy meeting later this week.

Mr Green notes: “A sharp dollar sell-off on Monday is being seen by Brits who think internationally as an opportunity to buy dollars as they are fearing a sharp plunge in the pound in the event of a no-deal Brexit – which is looking increasingly inevitable.

“The dollar is being weighed down by concerns over the strength of the U.S. economic recovery, the presidential election which creates uncertainty, plus the mounting tensions between Washington and Beijing.

“Whilst the ‘greenback’ – a robust safe-haven asset in times of turbulence – is down, quite sensibly Brits are moving in to buy it as a considerable drop in sterling can be expected if the UK crashes out of the EU in December without a deal.”

He continues: “A low pound will help to slash Britons’ purchasing power and lead to a drop in UK living standards. Weaker sterling means imports are more expensive, with rising costs being passed on to consumers.”

The drop in sterling is good for UK exports some insist, however around half of the country’s exports rely on imported components. “These will become more expensive as the pound falls in value,” noted Mr Green.

“In addition, a weaker pound is, of course, bad news for British expats, amongst others, who receive income or pensions in sterling and as Brits looking to travel overseas,” he added.

The dollar index edged slightly higher on Tuesday after slumping to a two-year low, but all eyes are now on the outlook from the Fed which may outline a possible move in policy stance.

The deVere CEO concludes: “The dollar is heading towards its worst month in nearly a decade, losing 3.9% in July.

“Against the current backdrop of a continuing coronavirus spread in the U.S. putting at risk the country’s economic recovery, plus the massive EU fiscal deal, it is likely that the dollar will remain under considerable pressure for some time.

“Therefore, Brits worried about the fallout of Brexit will increasingly move to take the opportunity to buy dollars.”

About:

deVere Group is one of the world’s largest independent advisors of specialist global financial solutions to international, local mass affluent, and high-net-worth clients.  It has a network of more than 70 offices across the world, over 80,000 clients and $12bn under advisement.

The Dollar Index Has Become Stable. Investors Expect the Fed Meeting

by JustForex

During yesterday’s trading session, the greenback continued to lose ground relative to its main competitors. The dollar index (#DX) has updated its key lows again. At the moment, the US dollar is stable. Financial market participants have started partially fixing their positions before the Fed meeting.

The regulator is expected to keep interest rates unchanged. At the same time, the Central Bank may signal an increase in economic stimulus. On Monday, Senate Republicans unveiled a $1 trillion stimulus plan for the economy with the White House, laying the groundwork for negotiations with Democrats. We recommend following the latest information on this issue. Investors will assess US economic reports today.

Oil quotes continue to consolidate. At the moment, futures for the WTI crude oil are testing the $41.50 mark per barrel. We recommend paying attention to the API weekly crude stock at 23:30 (GMT+3:00).

Market indicators

Yesterday, there were purchases in the US stock market: #SPY (+0.73%), #DIA (+0.48%), #QQQ (+1.78%).

The 10-year US government bonds yield has been growing. At the moment, the indicator is at the level of 0.60-0.61%.

The news feed for 2020.07.28:
  • – CB consumer confidence index in the US at 17:00 (GMT+3:00).

by JustForex

Equity bulls ride on stimulus optimism

By Lukman Otunuga, Research Analyst, ForexTime

Global equity bulls may continue their unstoppable momentum this week as investors weigh expectations for another U.S stimulus package against the coronavirus menace.

(Source: bloomberg terminal)

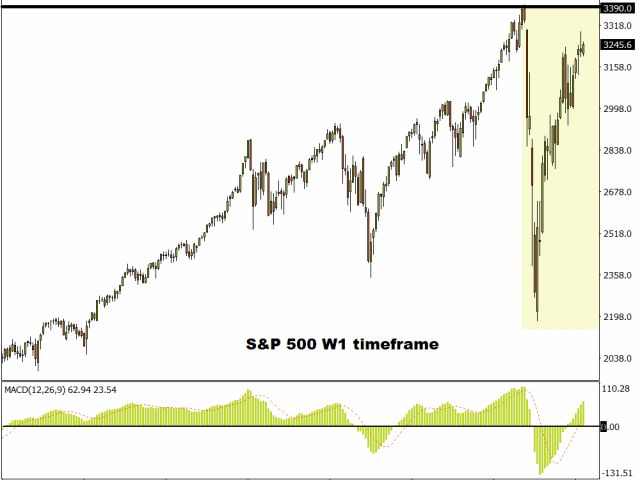
Market speculation around the Federal Reserve reinforcing its dovish message in the face of US-China tensions, mixed economic data and rising coronavirus cases provide an argument for stock markets to push higher in the near term. While stimulus hopes and low-interest rates are empowering equity bulls, the million-dollar question is for how long?

(S&P 500 weekly timeframe)

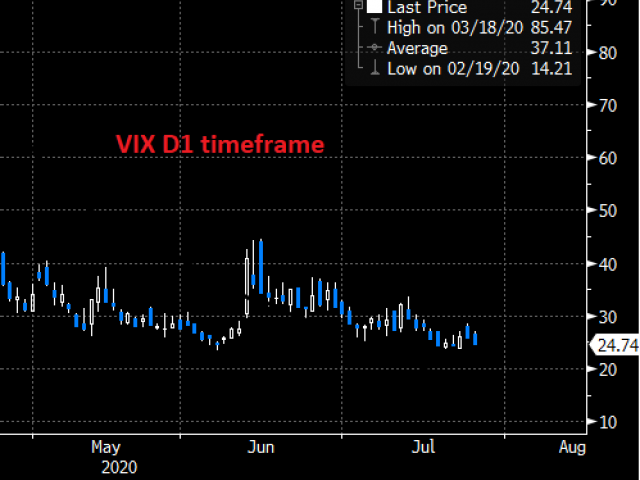
The explosive movements witnessed across currency and commodity markets over the past few weeks continue to highlight how global sentiment remains fragile to coronavirus developments. Looking at the Chicago Board Options Exchange’s CBOE Volatility Index (VIX) which is a measure used to track volatility on the S&P 500, it has declined over the past few days. However, there could be a rise VIX ‘fear-gauge’ this week if earnings disappoint and US-China tensions mount.

Equity bears still have enough ammunition to make an unwelcome return should global growth concerns and rising coronavirus cases among many other negative themes rekindle risk aversion.

Dollar in the dumps…

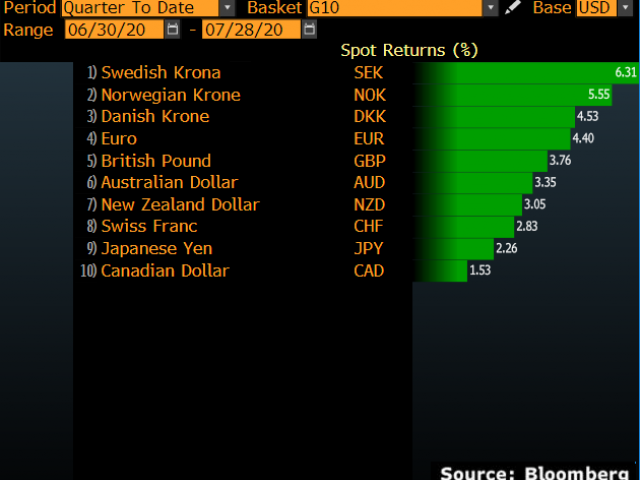
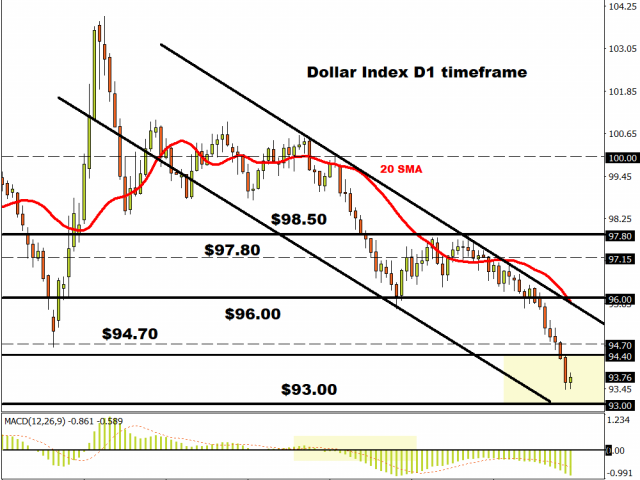
There was no love for the Dollar yesterday as sharp increases in US coronavirus cases rattled investor confidence. The once mighty Dollar has depreciated against every single G10 currency since the start of Q3 and is currently trading at levels not seen in two-years below 93.80!

Looking at the technical picture, prices are heavily bearish on the daily charts as there have been consistently lower lows and lower highs. Sustained weakness below 94.00 may encourage a decline back towards 93.50 and 93.00, respectively. If prices can break above 94.00, then a technical bounce back towards 94.40 and 94.70 could be on the cards.

EURUSD sprints to multi-year high

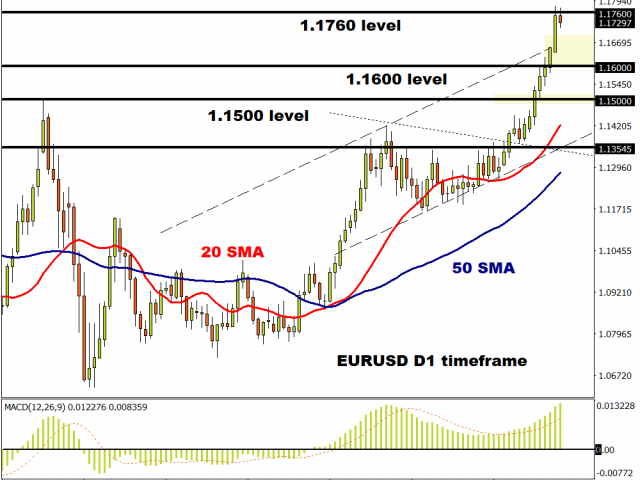
Euro bulls wasted no time in exploiting the Dollar’s weakness to propel prices to levels not seen since September 2018 above 1.1760.

Over the past two weeks, the currency pair has jumped over 400 pips thanks to renewed buying sentiment towards the Euro and a depressed US Dollar. While prices have the potential to push higher once the 1.1760 level is conquered, a technical correction could be around the corner. If 1.1760 proves to be reliable resistance, the EURUSD is likely to retrace back towards 1.1670 – 1.1620 regions before rebounding higher.

GBPUSD slams into 1.2900

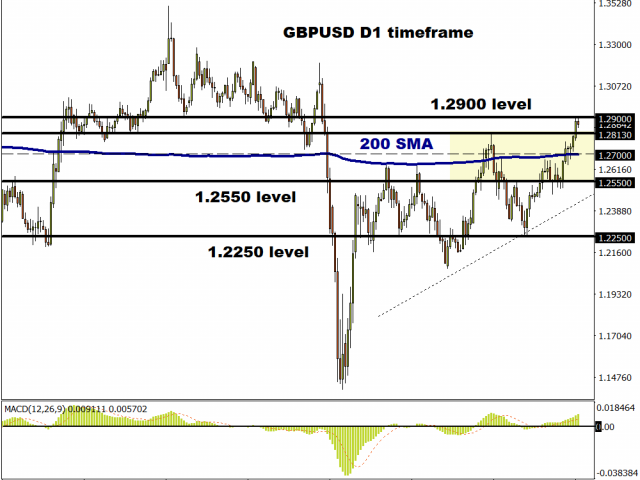
The technical picture on the GBPUSD is bullish. A solid daily close above 1.2900 could open the gates towards 1.3000. Alternatively, a technical correction from the 1.2900 resistance is seen triggering a decline back towards 1.2813 and 1.2700, respectively.

Gold remains the star of the show

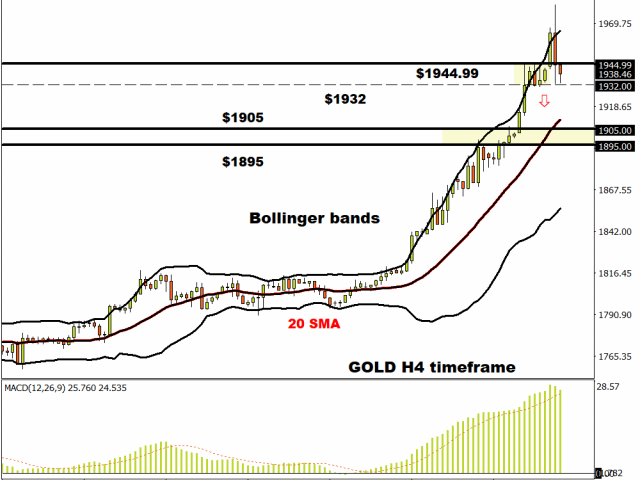
Gold rallied a fresh all-time high above $1980 on Tuesday before tumbling back below $1950 as investors engaged in a bout of profit taking.

The precious metal has gained almost 10% since the start of Q3 and is up over 27% year-to-date! While the medium to longer-term outlook for Gold remains tilted to the upside, losses could be witnessed in the short term amid profit taking and price action.

Looking at the technical picture, a close below the $1932 level could trigger a decline back towards $1905.

Disclaimer: The content in this article comprises personal opinions and should not be construed as containing personal and/or other investment advice and/or an offer of and/or solicitation for any transactions in financial instruments and/or a guarantee and/or prediction of future performance. ForexTime (FXTM), its affiliates, agents, directors, officers or employees do not guarantee the accuracy, validity, timeliness or completeness, of any information or data made available and assume no liability as to any loss arising from any investment based on the same.


Forex-Time-LogoArticle by ForexTime

ForexTime Ltd (FXTM) is an award winning international online forex broker regulated by CySEC 185/12 www.forextime.com

Markets mixed after a mixed start to week

By IFCMarkets.com

Top daily news

Global markets are mixed currently after a mixed session on Monday. US equities ended higher Monday led by technology shares as Republican lawmakers signaled a new coronavirus relief program extending direct payments to Americans of $1200 each would be unveiled shortly.

Forex news

Currency PairChange
EUR USD+0.41%
GBP USD-0.31%
USD JPY+0.22%
The Dollar weakening has halted currently . The live dollar index data show the ICE US Dollar index, a measure of the dollar’s strength against a basket of six rival currencies, fell 0.8% Monday as durable goods orders slowed to 7.3% in June after 15.7% growth in May. Both GBP/USD and EUR/USD accelerated climbing Monday as German business sentiment continued recovery – the Ifo Institute’s business climate index rose to above-expected 90.5 from an upwardly revised 86.3 in June. Both pairs are lower currently. AUD/USD reversed its sliding while USD/JPY continued sliding yesterday with both Australian dollar and yen lower currently against the greenback.

Stock Market news

IndicesChange
Dow Jones Index-0.21%
GB 100 Index-0.01%
Hang Seng Index+0.68%
Futures on three main US stock indexes are mixed currently ahead of the two-day meeting for the Federal Reserve that begins today. Companies continue reporting second quarter results today with Visa, Pfizer and AMD among them. As of the end of last week, 79% of SP 500 companies that had reported results beat lowered estimates. Stock indexes in US ended higher Monday: the three main US stock indexes posted gains ranging from 0.4% to 1.7% as lawmakers continued discussions of a new coronavirus rescue package. European stock indexes are mixed currently as travel stocks fell yesterday after British government imposed a two-week quarantine on anyone returning from Spain. Asian indexes are mixed today with shares higher in Hong Kong and Shanghai despite rising US-China tensions.

Commodity Market news

CommoditiesChange
Brent Crude Oil-0.26%
WTI Crude-0.44%
Brent is extending gains today. Oil prices ended higher on Monday: the US oil benchmark West Texas Intermediate (WTI) for September added 0.8% Monday and is up currently. September Brent crude edged up 0.2% to $43.41 a barrel on Monday.

Gold Market News

MetalsChange
Gold-1.24%

Gold prices are pulling back today. August gold rallied 1.8% to $1931 an ounce on Monday.

By IFCMarkets.com

NASDAQ Double Top & Price Channels Suggest Pending Price Correction

By TheTechnicalTraders 

– Our research team continues to attempt to navigate the difficult market dynamics ahead as traders’ concerns related to continued global economic functions persist.  We believe the US stock market has rallied well beyond sustainable levels and the recent move in the US Dollar and Precious Metals has issued a clear warning that global traders are not buying into the current valuation levels of the major indexes.  The NASDAQ (NQ) has rallied to new all-time highs at a time when a majority of the US Stock Market is contracting and concerns about future earnings/revenues continue to shock investors.  It is almost as if a large group of traders piled into the “Fed Recovery” message and ignored the fact that the COVID-19 virus event is vastly different than any other price correction we’ve experienced over the past 40+ years.

NQ DOUBLE TOP SETUP

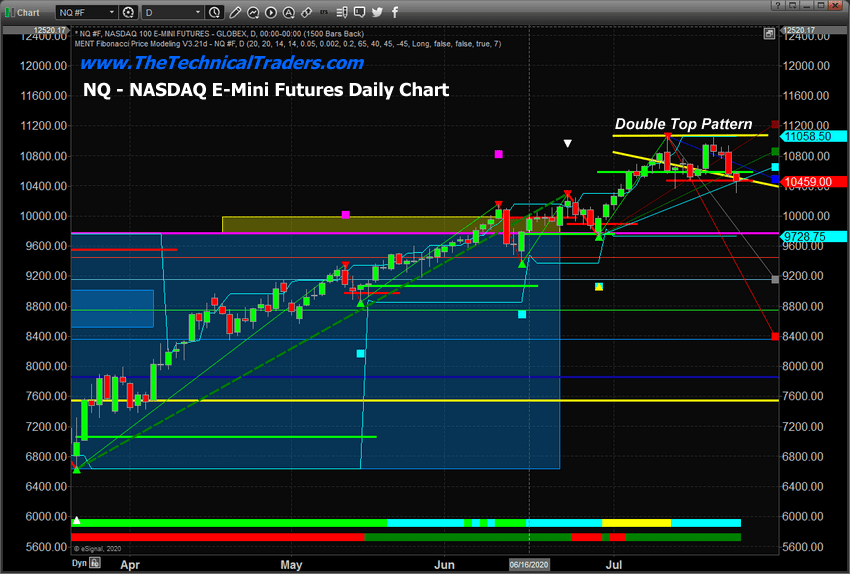
Recently, the NQ setup a very clear Double Top pattern near a somewhat obscure Fibonacci level (85.4%).  The Double Top pattern is a common technical pattern that suggests a resistance has formed near the Double Top price level, near 11058.50. Next week, critical GDP data and economic data will be announced on Thursday, July 30.  We believe the move in Gold and Silver is foreshadowing an ominous series of data that will reflect a very clear 20% to 30%+ contraction in the US and global economy.  The Double Top pattern in the NQ could be a very strong warning that the FOMO (Fear Of Missing Out) rally may be over.

NASDAQ DAILY CHART

NQ 100% MEASURED MOVE SETUP

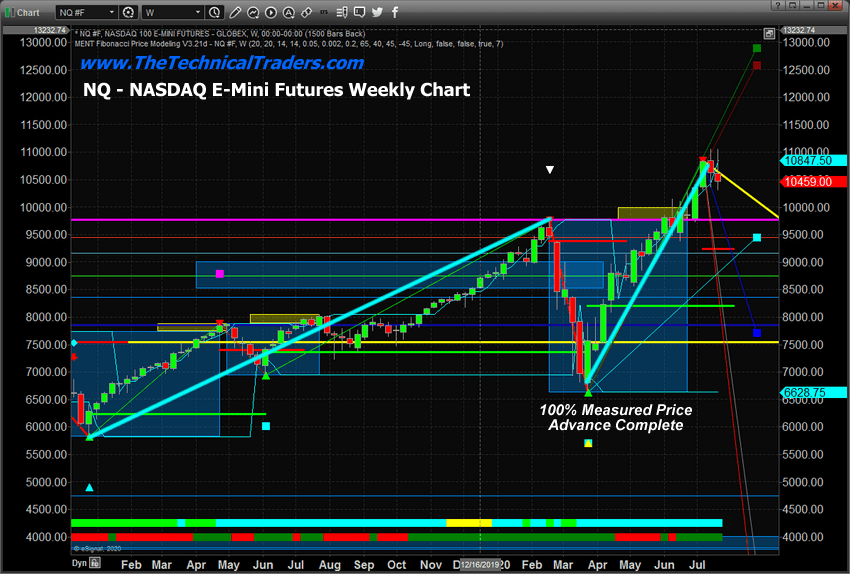
This NQ Weekly chart highlights the nearly 3,950 point rally from the low in December 2018 to the high formed on February 17, 2020.  The current low formed in March 2020, near 6628, to the recent peak level, near 11,085, represents a “100% measured price advance” of 4,430 points.  Yes, the current rally extended the 100% measured move by 12.15% – which often happens as price tests resistance or support. Measuring from Weekly closing bar to Weekly closing bar on this chart, the 100% measured move is only about 50 points away from a true 100% advance.

NASDAQ WEEKLY CHART

We believe this combination of technical price patterns suggests the US stock market, particularly the high-flying NASDAQ (NQ), may be setting up for a dramatic price decline.  Both the Double Top and 100% Measured Move patterns suggest price has reached a limit.  If our interpretation of these technical patterns is correct, after such an incredible price rally in the face of unsure future economic data, we believe a move back to 8,750 is not out of the question (or lower).

Before you continue, be sure to opt-in to our free market trend signals 
before closing this page, so you don’t miss our next special report!

NQ FIBONACCI CHANNELS

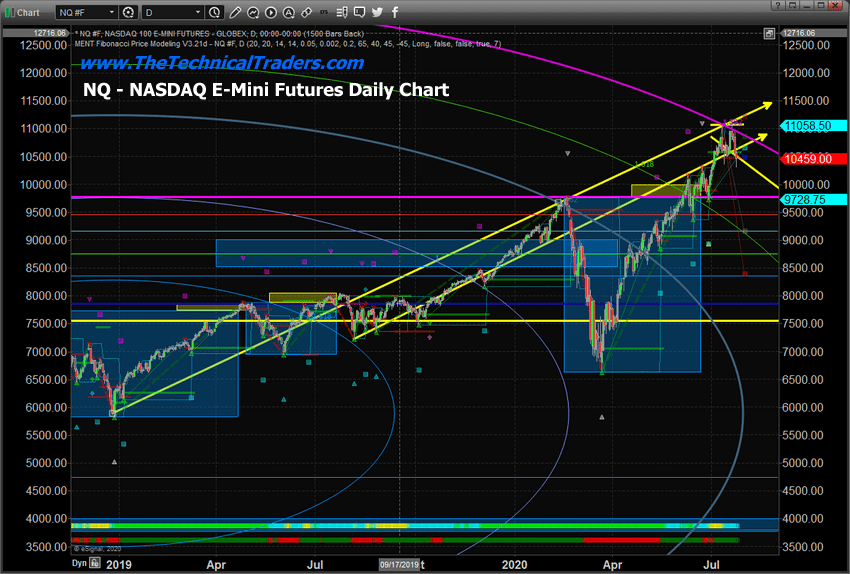
Very few people understand the relationship of Fibonacci price theory and how it relates to price action.  Fibonacci Price Theory suggests that price must move higher or lower to establish new price highs or lows within a trend.  Obviously, the NQ has rallied to “new price highs” – thus the current trend is “bullish”.  Yet, a Double Top pattern is also a critical warning of resistance near the dual top level.  Additionally, a 100% measured price advance is another warning sign that price may have reached an upside limit.  Now, we add our proprietary Fibonacci Price Amplitude Arcs using a 0.854% Fibonacci extension level.

This extension level is not commonly used by many traders but is completely valid if you spend a bit of time exploring the Fibonacci Number Sequence and the relationship between the numbers.  In fact, there are a number of levels between the 0.75% and 1.0% common Fibonacci levels that are valid for traders.

We have drawn the 1.854% Fibonacci Price Amplitude Arc in a MEGENTA color to highlight just how critical this level appears on the Weekly price chart.  If our research is correct, we now have three technical/Fibonacci patterns that are setting up warning us that the NQ price may turn downward and begin a new downside price rotation.  When we combine this with the data that we are expecting this week (GDP, Consumer and other data), this could turn into a “knockout blow” for the high-flying NASDAQ.

NASDAQ DAILY – FIBONACCI CHANNELS

If you were paying attention, you already know that the US Dollar is under pressure and the Precious Metals are showing signs that fear is rising in the global markets.  This next week, and the weeks that follow, will likely result in global traders attempting to re-valuate expectations based on the level of destruction the COVID-19 virus has done to the US and global economy.

Our researchers expect a minimum of a 20% to 25% contraction in consumer and business engagement in the US – possibly much more.  In March 2020, our research team suggested the Q1 and Q2 GDP data could contract by as much as -10% to -15%, potentially pushing the 2020 yearly GDP level into a -5% or deeper level.  On Thursday, July 30, 2020, we’ll find out just how rough Q2 of 2020 really was for the US.

This is when the crap is likely to stick to the walls, so our advice would be to protect your open longs, prepare for increased volatility and don’t get married to any position you have right now.  If you have not already prepared for this move, do it quickly early this week.

If the news is bad enough, there is no reason why the US and global markets could not attempt to retest recent low-price levels again.  Remember, Fibonacci Price Theory suggests price is ALWAYS seeking new price highs or new price lows.  Just because the NQ has reached new price high levels does not mean the S&P500, Dow Jones or other indexes, which have not reached new all-time highs, could not collapse and attempt to find new price low levels.

Get our Active ETF Swing Trade Signals or if you have any type of retirement account and are looking for signals when to own equities, bonds, or cash, be sure to become a member of my Passive Long-Term ETF Investing Signals which we are about to issue a new signal for subscribers.

Chris Vermeulen
Chief Market Strategist
Founder of Technical Traders Ltd.

NOTICE: Our free research does not constitute a trade recommendation or solicitation for our readers to take any action regarding this research.  It is provided for research and educational purposes only.  The Technical Traders Ltd. does not provide financial or investment advice, so please contact your financial advisor before making decisions about your personal finances.