Explorer Drills ‘High-Grade Hits’ in Quebec

By The Gold Report

Source: Streetwise Reports   06/26/2020

A Laurentian Bank Securities report notes Troilus Gold’s new drill results from the final holes of its latest drill campaign demonstrate expansion potential.

In a May 14 research note, Laurentian Bank Securities analyst Jacques Wortman wrote that new drill results from the Southwest Zone (SWZ) of Troilus Gold Corp.’s (TLG:TSX; CHXMF:OTCQB) Troilus project in Quebec “demonstrate expansion potential to the northeast and returned high-grade intervals, characteristic of the company’s geological model and consistent with mineralization in the past-producing Z87 pit.”

These new results, which Wortman presented in his report, are for the last six of Troilus Gold’s 11-hole, 6,000 meter (6,000m), phase 2, Southwest Zone drill program. Phase 1 encompassed seven holes.

Overall, the new findings underscore the “presence and importance of high-grade gold,” the analyst wrote, not only at Southwest but also on the Troilus property as a whole. They also support the company’s geological model that “highlights the trend for high-grade intercepts within broader disseminated mineralized zones related to fold and shear patterns that create high-grade traps,” added Wortman.

He listed some of the best assays of the batch, which come from three of the holes. TLG-ZSW20-181 returned 13.28 grams per ton (13.28 g/t) gold equivalent (Au eq) over 1m within a broader intercept of 1.18 g/t Au eq over 21m.

TLG-ZSW20-186 showed 16.1 g/t Au eq over 1.1m, 1.33 g/t Au eq over 5m and 1.43 g/t Au eq over 5m. TLG-ZSW20-190 demonstrated 46.4 g/t Au eq over 1m.

“We are encouraged by the presence of the high-grade gold traps at the SWZ,” Wortman said. “While some of these structures could potentially be accessed by open-pit mining, there is the potential that deeper mineralization will require underground mining methods, consistent with the resource base at the Z87 and J Zones.”

Troilus Gold is expected to announce sometime this month or next a resource estimate for the Troilus project, which will incorporate all of its recent Southwest Zone drill results.

Laurentian rates Troilus Gold a Buy and has a CA$3.50 per share price target on the stock. The current share price is about CA$0.98.

Sign up for our FREE newsletter at: www.streetwisereports.com/get-news

Disclosure:
1) Doresa Banning compiled this article for Streetwise Reports LLC and provides services to Streetwise Reports as an independent contractor. She or members of her household own securities of the following companies mentioned in the article: None. She or members of her household are paid by the following companies mentioned in this article: None.
2) The following companies mentioned in this article are billboard sponsors of Streetwise Reports: Troilus Gold. Click here for important disclosures about sponsor fees.
3) Comments and opinions expressed are those of the specific experts and not of Streetwise Reports or its officers. The information provided above is for informational purposes only and is not a recommendation to buy or sell any security.
4) The article does not constitute investment advice. Each reader is encouraged to consult with his or her individual financial professional and any action a reader takes as a result of information presented here is his or her own responsibility. By opening this page, each reader accepts and agrees to Streetwise Reports’ terms of use and full legal disclaimer. This article is not a solicitation for investment. Streetwise Reports does not render general or specific investment advice and the information on Streetwise Reports should not be considered a recommendation to buy or sell any security. Streetwise Reports does not endorse or recommend the business, products, services or securities of any company mentioned on Streetwise Reports.
5) From time to time, Streetwise Reports LLC and its directors, officers, employees or members of their families, as well as persons interviewed for articles and interviews on the site, may have a long or short position in securities mentioned. Directors, officers, employees or members of their immediate families are prohibited from making purchases and/or sales of those securities in the open market or otherwise from the time of the interview or the decision to write an article until three business days after the publication of the interview or article. The foregoing prohibition does not apply to articles that in substance only restate previously published company releases.

Disclosures from Laurentian Bank Securities, Troilus Gold Corp., May 14, 2020

Laurentian Bank Securities Inc. and/or its officers, directors, representatives, traders, analysts and members of their families may hold positions in the stocks mentioned in this document and may buy and/or sell these stocks on the market or otherwise.

The Research Analyst’s compensation is based on various performance and market criteria and is charged as an expense to certain departments of Laurentian Bank Securities
(LBS), including investment banking.

Laurentian Bank Securities Inc. may, in exchange for remuneration, act as a financial advisor or tax consultant for, or participate in the financing of companies mentioned in this document.

Within the last 24 months, LBS has undertaken an underwriting liability with respect to equity securities of, or has provided advice for a fee with respect to, this issuer.

The Analyst has visited material operations of this issuer.

This issuer paid a portion of the travel-related expenses incurred by the Analyst to visit material operations of this issuer.

To access Laurentian Bank Securities’ regulatory disclosures, please click here.

( Companies Mentioned: TLG:TSX; CHXMF:OTCQB,
)
After 2nd Quarter Carnage, the Quest for Philippine Recovery

By Dan Steinbock

– Recently, the IMF downgraded most growth projections, due to weaker private consumption and elevated uncertainty in investment. Those are the twin engines of the Philippine economy. So, what’s ahead for economic recovery?

As I wrote in a report 2 months ago (click here), the global economic outlook of the International Monetary Fund (April 2020) was too optimistic. Last week, the IMF downgraded most of its projections. Now global growth is projected at -4.9% in 2020, almost 2 percentage points below the previous forecast.

Consumption growth has been downgraded for most economies, due to the larger-than-anticipated disruption to domestic activity. Worse, investment is expected to remain subdued as firms defer capital expenditures amid elevated uncertainty.

If consumption growth has historically been central in the Philippines, while investment has fueled the country’s “Build, Build, Build” infrastructure drive, what’s ahead for economic recovery?

Pandemic liabilities of consumption-led growth

In the Philippines, the impact of the great coronavirus contraction began already in the 1st quarter, when the economy shrank by 0.2% on year-on-year basis.

The effect was dramatic, even though the official number of cases was still relatively low (less than 2,100 versus more than 35,000 today) and nationwide quarantine began to dampen demand only toward the end of the quarter. With plunging international conditions, travel and tourism, retail and transportation took heavy hits.

For years, the conventional wisdom was that economic growth in the Philippines is fueled by consumption. In the West, observers saw the status quo as positive because it supported foreign exports into the country.

Nevertheless, for years, I have been warning that under adverse conditions consumption-reliant economy can prove a severe liability because, without a vibrant domestic manufacturing base, such growth keeps the country under dependency.

When international conditions are positive and global economy thrives, so will Philippine consumption and economy. Unfortunately, the reverse applies as well – and that’s what we have seen in the course of the past few months.

In the 1st quarter, growth in household consumption, which accounts three-fourths of the GDP, fell flat. As the global economy has been frozen, Philippine business, investment and consumer confidence have been impaired as well.

But there’s much worse to come.

1st quarter plunge only prelude to 2nd quarter carnage

As the global coronavirus contraction spread in the first half of the year, the plunge is reflected by the revised Philippine economic outlook.

The fall of both exports and imports was only to be expected following the rapid deterioration in external demand and the disruption of supply chains.

Obviously, months of lockdowns and quarantines around the world have reverberated adversely on the supply side as well. Economic growth has decelerated in all sectors. Growth in services fell four-fifths to 1.4% on a quarterly basis, mainly as net effect of the plunge in transport and accommodation, food services, and trade.

In the past, construction, perhaps even manufacturing, was thriving. Now both fell, as did agriculture.

The current forecast for 2020 has been downgraded to -3.8%. Both household consumption and investment have slowed more than expected. And the contraction in the global economy will continue to drag external trade, tourism and remittances.

Nevertheless, the Asian Development Bank’s (current) forecast for 2021 is maintained at 6.5%, supported by public infrastructure spending and anticipated recovery in consumer and business confidence.

Thanks to its secular economic potential, the Philippines certainly could experience a strong V-shaped recovery. But it will not prove as smooth as currently anticipated. In the global economy, the plunge of the 1st quarter is just a prelude to the massive collateral damage in the 2nd quarter, which is almost over.

In the Philippines, too, new downgrades are likely to reflect the new normal in the coming months.

Hollow “lives vs livelihoods” debates

In the past few months, critics of the Duterte government first downplayed the impending economic damage associated with the coronavirus contraction. When the stance proved flawed, the tactic was reversed. More recently, they have pushed for even longer lockdowns and quarantines, despite prohibitive economic costs.

These debates are not predicated on the recovery of the Philippine economy and the well-being of its citizens. Rather, such debates, which blame the government for the global pandemic, reflect early positioning for the 2022 election – that is, political exploitation of dire economic realities.

In 2019, the budget debacle proved extraordinarily costly because it weakened Philippine output potential right before the global pandemic and the coronavirus contraction. Should they result in real political polarizations, current “lives versus livelihoods” divisions could contribute to a slower than expected recovery.

Today, all economies in Southeast Asia hope to gradually ease lockdowns, quarantines and restrictive measures. Yet, in the Philippines, some argue that the quarantines should continue longer to ensure adequate bending of the epidemic curve. They believe that lives precede livelihoods.

In contrast, others claim that such measures would be foolish because they downplay the adverse economic consequences of the quarantines. They claim that without livelihoods lives will be lost.

In reality, both sides have a point, but neither is right. Without lives, there are no livelihoods. Conversely, without livelihoods, lives will be lost. The challenge is not to choose between one or the other. The challenge is the right and timely balance between the two.

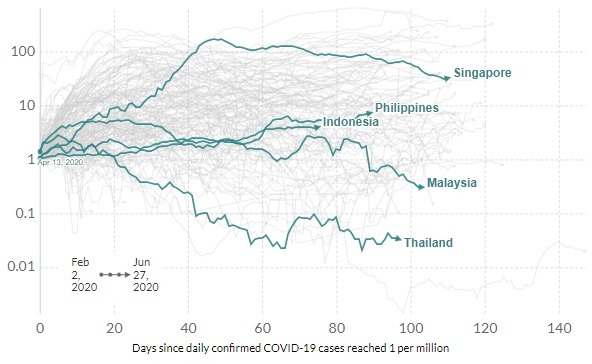
While the recent surges in confirmed cases reflect intensified testing rather than changes in the pandemic status quo, Philippine recovery cannot fully move ahead until the epidemic curve is effectively bending. And the reality is that while the Philippines is getting closer to bending the curve, it hasn’t succeeded yet in per capita terms (Figure).

Figure Getting closer to bending the curve*

Daily Covid-19 cases per million: ASEAN economies

Source: European CDC, June 27, 2020

Fiscal and monetary flexibility facing stress tests

Obviously, household consumption and investment growth has plunged in the 2nd quarter. But if the pandemic can be kept in check in the coming months and the epidemic curve finally bends, infrastructure investment and household consumption could intensify the hoped-for recovery.

The Duterte government’s infrastructure and fiscal economic changes have lifted the share of investment growth up to 27% of GDP from barely 20% in the Aquino era (2010-16). However, since the government must now allocate more to the struggle against the pandemic, public expenditure and construction outlays will be delayed.

Consequently, now it’s the time to push even harder the infrastructure drive and fiscal economic changes. If this effort proves successful, the growth forecast for the current year is still likely to hover at around -3.5% to -4.5% on a year-to-year basis. But the coming recovery could prove stronger than expected.

In the past months, the Bangko Sentral (BSP) has cut the policy rate by 125 basis points, pushing the benchmark rate down to a record low 2.75% (which is likely to cut closer to 2.0% in the coming months). The reserve requirement ratio (RRR) has been cut down to 12% (with another 200 basis-points reduction likely ahead).

Obviously, the BSP has tried to neutralize the pandemic impact on economic growth.

Recently, lower energy prices and reduced imports have offset the fall in remittances. But since global recovery is likely to prove more challenging than expected, weaker government revenues (and rising deficit) and impending stimulus package (3.1% of GDP) will stress-test fiscal policies in the second half of the year.

Challenging scenarios

If, in addition to the catastrophic consequences of the Trump administration’s failed pandemic policies, the White House will accelerate its trade wars against China and US allies in Europe and East Asia, global economic headwinds will prove much worse than expected.

In that scenario, the anticipated global recovery would prove subdued in the second half of the year and a multi-year global recession could no longer be excluded, especially as the heavily-indebted advanced economies’ recent and huge debt-taking may result in new debt crises, which could spill over to poorer countries.

Furthermore, such negative scenarios would be reinforced if the development of vaccine and viral therapies will take longer than expected.

In the coming months, the Philippines, like so many other countries, will face the greatest risks (and opportunities) since World War II. Now the margin for error in economic policies and pandemic containment is slim to nil.

About the Author:

Dr. Dan Steinbock is an internationally recognized strategist of the multipolar world and the founder of Difference Group. He has served at the India, China and America Institute (USA), Shanghai Institutes for International Studies (China) and the EU Center (Singapore). For more, see https://www.differencegroup.net

Based on Dr Steinbock’s briefing on June 27, 2020.


Dollar bearish bets increase continued on mixed US reports

By IFCMarkets

US dollar net short bets rose to $16.93 billion from $15.69 against the major currencies during the one week period, according to the report of the Commodity Futures Trading Commission (CFTC) covering data up to June 23 and released on Friday June 26. The significant increase in Pound bearish bets as the Bank of England left interest rates unchanged at 0.1% but increased its bond buying by £100 billion ($125 billion) were offset by decrease in bearish bets on Canadian dollar and increase in yen bullish bets. Euro bearish bets changed little as European Union’s 27 governments started negotiations over a proposal for a 750 billion euro ($841 billion) recovery fund. The Pound, Canadian and Australian dollars maintained net short positions against the dollar. The bearish dollar bets rose as US initial jobless claims rose above-expected 1.5 million the previous week while Chicago Fed’s national activity index recovered in May – indicating expanding economy.


CFTC Sentiment vs Exchange Rate

June 23 2020BiasEx RateTrendPosition $ mlnWeekly Change
CADbearishnegative-1538344
AUDbearishnegative-333116
EURbullishnegative16835348
GBPbearishnegative-1448-191
CHFbullishnegative192-19
JPYbullishnegative3223648
Total16931

Market Analysis provided by IFCMarkets

Note:
This overview has an informative and tutorial character and is published for free. All the data, included in the overview, are received from public sources, recognized as more or less reliable. Moreover, there is no guarantee that the indicated information is full and precise. Overviews are not updated. The whole information in each overview, including opinion, indicators, charts and anything else, is provided only for familiarization purposes and is not financial advice or а recommendation. The whole text and its any part, as well as the charts cannot be considered as an offer to make a deal with any asset. IFC Markets and its employees under any circumstances are not liable for any action taken by someone else during or after reading the overview.

Coming Up: UK, Spain & Canada GDP

By Orbex

As we are coming to the conclusion of the second quarter, we are about to hit a deluge of key economic data.

This data will likely determine whether we keep trending in a V shape, or turn down into the second wave of the W. The increased uncertainty has all but erased the most recent attempt by markets to push higher, and once again we are in limbo.

Everyone expects Q2 data to be worse than Q1. However, the hope is to see a clear turn to the upside starting around mid-May. Companies that have reported so far have indicated that they’ve seen a more recent upturn in sales, though consumer demand remains lower compared to this time last year.

Let’s review some of the major data that could jostle the markets.

What We Are Looking For

As it’ll be the last day of the quarter tomorrow, we have a busy data schedule ahead. Therefore, we ought to expect some extra volatility in GBP, EUR and CAD pairs.

In particular, the UK is dumping a substantial amount of information on the markets right before they open, including their customarily delayed GDP figures.

We can expect final Q1 GDP growth for the UK to repeat the preliminary figures at -2.0%. This compares to flat growth in the prior quarter, which is significant as it would confirm that the UK is merely technically escaping falling into a recession in the first quarter. A reminder that Q1 was before most of the effect of the pandemic was felt.

Projections are for annualized GDP growth to also repeat the preliminary figure at -1.6%, compared to 1.1% growth in 2019.

Spain is in Focus Again

We want to pay attention to Spain now, not just because they were one of the worst affected by coronavirus in Europe, but because their finances make them one of the more vulnerable to the economic fallout.

As with the prior recession, Spain is likely to be the bellwether of the evolution for the eurozone as it faces the diplomatic hurdles of coordinating a centralized response to the pandemic.

Projections are for the final Q1 GDP for Spain to repeat the preliminary figure at -5.2%, compared to 0.4% growth in the fourth quarter. On an annualized basis, this would imply a negative growth of -4.1%, compared to 1.8% in the prior reading. The lack of tourism during spring likely to have taken a toll on Spain’s economy.

Canada is the Exception

From Canada, we get relatively newer data, which is likely to be very interesting for the markets. April was the month when Canada was the most affected by the virus, and we can expect it to mark the low point.

The hope is that it’s all upside from here, as businesses began to reopen in May.

The consensus of expectations for Canada’s April GDP is for a contraction of -12.3%. This is in comparison to -7.2% in March. This implies a total of -18.6% reduction in GDP since the beginning of the pandemic.

By Orbex

Crude Prices on the Comeback as Producers Cut Supply and Upstream Investments

As crude prices are pushing up against $40 per barrel, defying many bearish predictions from the first quarter, McAlinden Research outlines optimistic prospects for the market.

The Energy Report – Source: McAlinden Research for Streetwise Reports   06/25/2020

Crude prices are pushing up against $40 per barrel, defying many bearish predictions from the first quarter. Output cuts in nearly all major oil producing nations have been effective thus far and can be expected to continue through at least July. Even after the supply cut deals expire, however, crude producers are now forecast to cut hundreds of billions of dollars in spending on expansion for years to come, which should provide support to longer-term pricing prospects. It is important to note that U.S. production capacity from shale producers also remains vulnerable with many drillers still staring down the barrel of bankruptcy.

Crude Demand Digging Out of the Depths

In its monthly oil-market report Tuesday, the International Energy Agency (IEA) said that while the world’s demand for crude will drop by 8.1 million barrels per day (bpd) this year, slightly less than forecast in last month’s report, demand in 2021 will rebound by a record 5.7 million bpd. Stripping out jet-fuel demand, global oil demand should reach pre-crisis levels in mid-2021, the IEA’s executive director Fatih Birol said Tuesday. “The key issue is when people will start to fly,” he said, adding that “if there is a solution to the coronavirus problem and the economy rebounds as foreseen, we may well see in the near term oil demand go back to pre-crisis levels.”

To receive all of MRP’s insights in your inbox Monday–Friday, follow this link for a free 30-day trial. This content was delivered to McAlinden Research Partners clients on June 17.

This is huge news for the energy sector, which has already begun to see early signs of recovery. Not only have crude prices rebounded to their highest level since early March, now closing in on $40 per barrel, but gasoline prices are also climbing back up. Earlier this month, we highlighted rebounding traffic volume in the U.S., but some experts now say that the reopening of many states will lead to more cars being on the road than before the outbreak of COVID-19.

Fear of contagion from the virus is expected to push up the number of people forgoing public transit for their commute and other travels. A recent survey from research outfit Elucd found that 44% of New Yorkers, for example, will avoid public transit after quarantine ends, and that another 31.5% plan to use mass transit less by walking, driving or biking. Nationwide, the poll found that 45.8% of people will “avoid transit entirely.”

China, Europe and other areas around the globe are experiencing the same phenomenon, which should be a boon to gasoline sales for months to come.

Speaking of China, by far the world’s largest importer of oil, the country’s April crude demand was almost back at levels seen a year previously. In May, the Chinese imported a record amount of oil. Shipments to China surged to 47.97 million tons in May, or 11.34 million bpd. That’s a 15% jump from April and 160,000 bpd more than the previous record set in November. Shipping data indicates that China could import more than 14 million bpd in June, according to Sean Tan, an analyst with commodity research firm Kpler.

US Shale Cuts Drive Production to Multi-Year Low

Oil production from the seven most prolific U.S. shale basins will fall to 7.632 million bpd, the Energy Information Administration (EIA) said on Monday in its latest edition of the Drilling Productivity Report. That would be the lowest level of production in two years as all of the seven basins are expected to see some drop off in July.

Though the cuts have helped oil prices have rebound from their lows, reaching previously unthinkable negative levels in April, profitability is still hard to come by for struggling drillers. This means time and money are running out for a number facing insolvency.

Back in April, Rystad Energy had warned that, in a $20 oil environment, 533 U.S. oil exploration and production companies would file for bankruptcy by the end of 2021. At $10, there could have been more than 1,100 bankruptcies. Though it looks like shale drillers have avoided those worst-case scenarios, many still face an insurmountable amount of debt going forward. MRP previously noted that more than $200 billion of North American oil-and-gas debt will mature over the next four years, including $41 billion just this year. That total will increase to $45 billion next year and then balloon to $68 billion in 2022.

Per the latest Rystad data, if U.S. oil prices average about $30 this year, around 73 oil and gas producers in the U.S. will still face bankruptcy, with 170 more following in 2021. Oil is hovering safely above that mark for now, but the threat of bankruptcy, along with lack of financing options, should prevent many shale drillers from taking any measures to increase output in the near term.

MRP has highlighted the inability of U.S. shale producers lack of cash flow going all the way back to 2018. While plentiful capital injections were easy to come by back then, banks and other creditors continue to slash credit lines. Moody’s Corp. and JP Morgan Chase & Co. forecast a total reduction of as much as 30% to the asset-backed loans, or tens of billions of dollars.

As the Wall Street Journal writes, some are concerned that the cutback in lending could signal a permanent contraction in oil-and-gas lending, as financial institutions, already facing pressure from activists and governments to pull back from fossil fuels, retreat from a sector that has delivered underwhelming profits for most of the past decade.

Though Goldman Sachs is predicting a V-shaped bounce back in oil demand, supply will exhibit an L-shaped recovery. Effectively, the Investment Bank expects supply to be suppressed for some time as, not only does shutting in oil wells damage their output capacity and take work to get them back online, but declines in capital expenditure and access to capital will suppress new exploration and drilling for some time.

The IEA sees a similar struggle to regain potential capacity from before the pandemic. The agency now expects total energy investment to fall from $1.9 trillion to $1.5 trillion, a 20% decline in 2020 compared to last year—the largest decline on record. Upstream investment has been struck particularly hard, expected to drop from $483 billion last year to $347 billion this year; that’s a drop of almost one-third. If oil sector investment were to stay at these projected 2020 levels, this would reduce the previously expected level of supply in 2025 by almost 9 million bpd.

Last month, MRP noted that the potential of muted investment levels and new project activity could combine with the rebound in global oil demand once the coronavirus crisis is over to swing the global oil market into a potential oil supply deficit of some 5 million bpd, according to Rystad data. Oil prices would top $68 a barrel to balance the market, the consultancy said.

OPEC+ Cuts Deeper, Saudis Cut Exports to Asia

Saudi Arabia reduced the amount of crude it will supply next month to seven refiners in Asia after striking an extension on their OPEC+ deal, which will now be in effect through July. The volume of contracted oil the seven buyers will receive for July was cut by 10% to 40%, according to refinery officials who asked not to be identified as the information is private.

The OPEC+ syndicate, which is unofficially headed by the Saudi Kingdom and non-OPEC member Russia, will remain committed to maintaining production cutbacks amounting to about 10% of global supply.

Surprisingly, Venezuela’s collapsing oil industry, in a constant state of decline for years now, has largely flown under the radar as of late despite being at its absolute breaking point. As fields across the nation shut amid a relentless U.S. campaign to cut the country off from global oil markets, World Oil writes that the number of rigs drilling for crude fell to just one in May, according to data from Baker Hughes. Another lone rig was drilling for gas. That marks a 96% decline since January, when drilling fell to levels not seen since 1963. State-owned PDVSA’s total oil production decreased 16% to 645,700 bpd last month—that’s 57% lower than the company’s previously planned output.

We continue to believe early supply-side measures taken by oil producing nations has been effective in taming the global crude supply, holding the market over until sufficient demand can return. We also believe that the most well-positioned firms to withstand the intermediate period will be large-scale operators with diversified, productive assets.

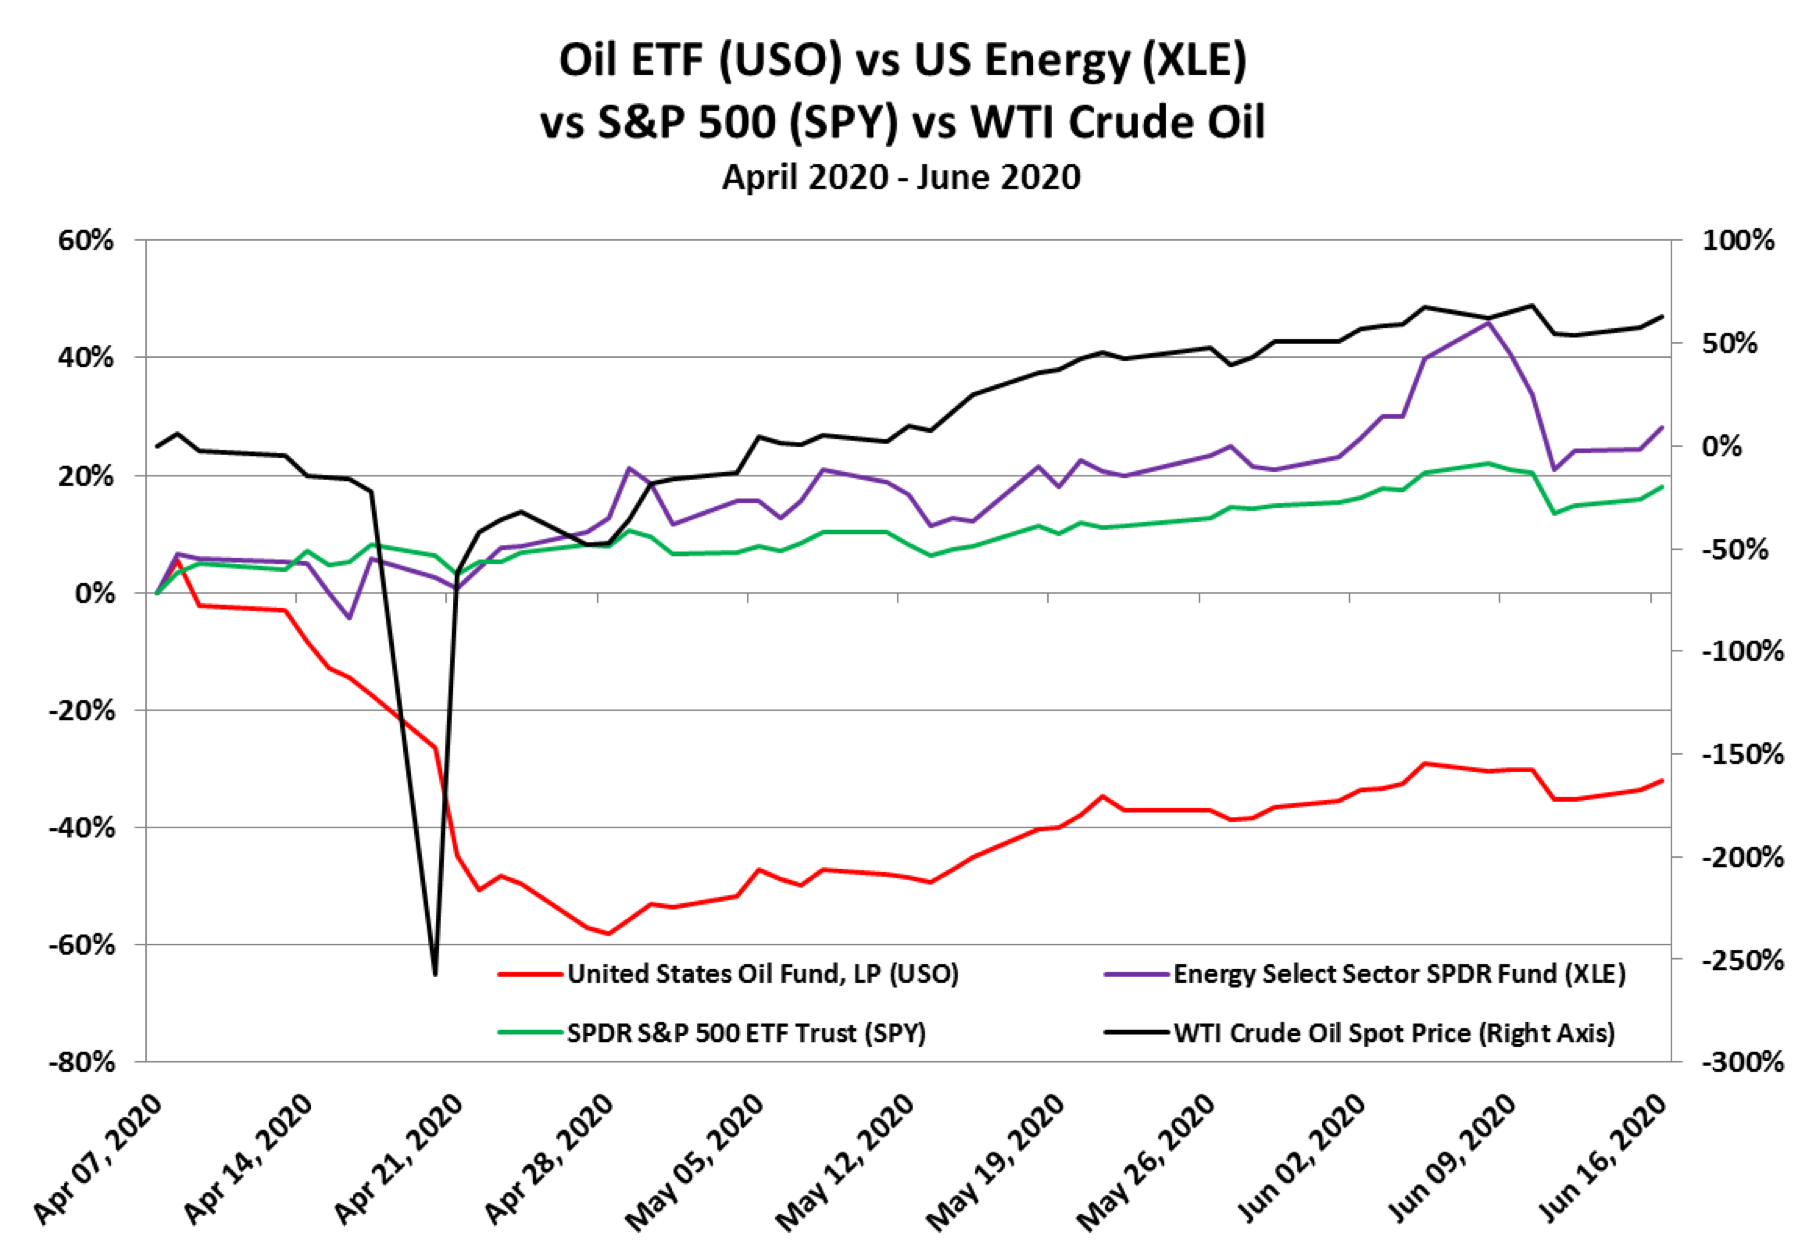
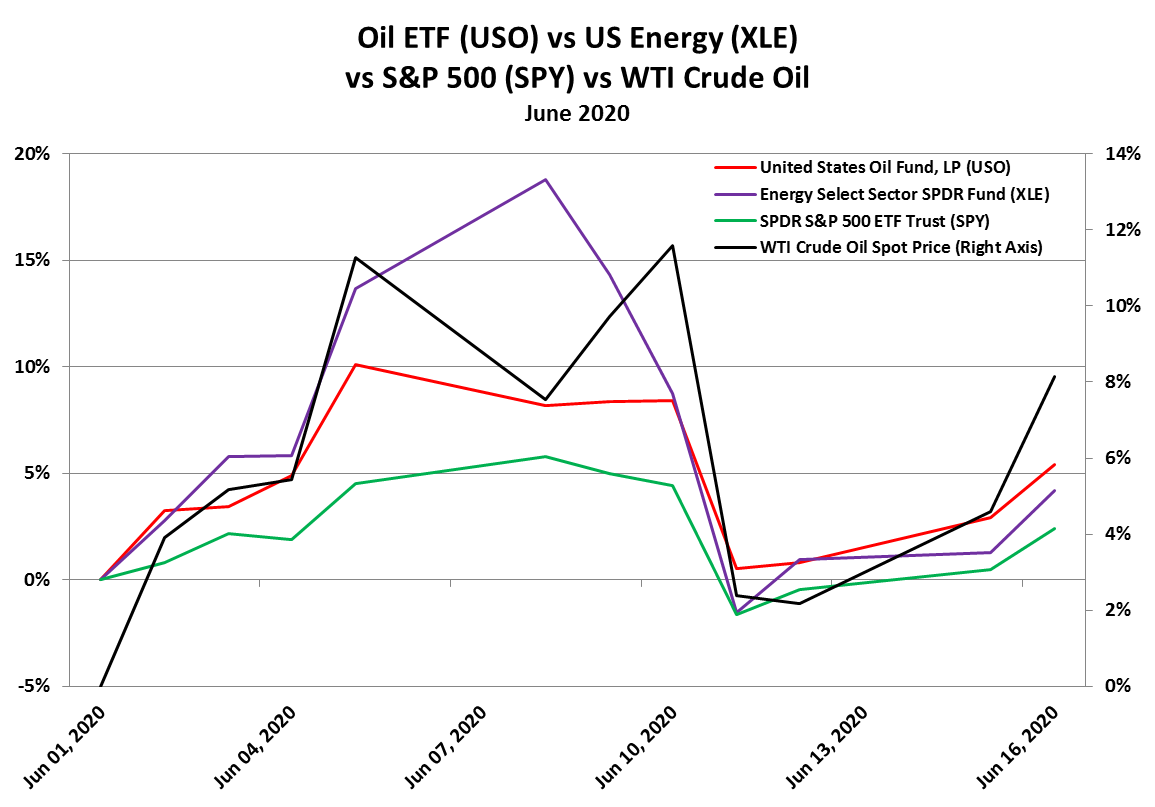
MRP added LONG Crude Oil & U.S. Energy to our list of themes on April 7, 2020. We will continue to track these themes with the United States Oil Fund, LP (USO) and Energy Select Sector SPDR Fund (XLE). Since we launched the themes, the USO is has unsurprisingly declined a steep 32% in the aftermath of the April meltdown in the futures market. However, the XLE has actually garnered a 28% return over the same period, outperforming the S&P 500’s 18% gain.

oilgrowth1

oilgrowth2

 McAlinden Research Partners

McAlinden Research Partners (MRP) provides independent investment strategy research to investors worldwide. The firm’s mission is to identify alpha-generating investment themes early in their unfolding and bring them to its clients’ attention. MRP’s research process reflects founder Joe McAlinden’s 50 years of experience on Wall Street. The methodologies he developed as chief investment officer of Morgan Stanley Investment Management, where he oversaw more than $400 billion in assets, provide the foundation for the strategy research MRP now brings to hedge funds, pension funds, sovereign wealth funds and other asset managers around the globe.


Sign up for our FREE newsletter at: www.streetwisereports.com/get-news

Disclosure:
1) McAlinden Research Partners disclosures are below.
2) The following companies mentioned in this article are billboard sponsors of Streetwise Reports: None. Click here for important disclosures about sponsor fees. The information provided above is for informational purposes only and is not a recommendation to buy or sell any security.
3) Statements and opinions expressed are the opinions of the author and not of Streetwise Reports or its officers. The author is wholly responsible for the validity of the statements. The author was not paid by Streetwise Reports for this article. Streetwise Reports was not paid by the author to publish or syndicate this article. Streetwise Reports requires contributing authors to disclose any shareholdings in, or economic relationships with, companies that they write about. Streetwise Reports relies upon the authors to accurately provide this information and Streetwise Reports has no means of verifying its accuracy.
4) This article does not constitute investment advice. Each reader is encouraged to consult with his or her individual financial professional and any action a reader takes as a result of information presented here is his or her own responsibility. By opening this page, each reader accepts and agrees to Streetwise Reports’ terms of use and full legal disclaimer. This article is not a solicitation for investment. Streetwise Reports does not render general or specific investment advice and the information on Streetwise Reports should not be considered a recommendation to buy or sell any security. Streetwise Reports does not endorse or recommend the business, products, services or securities of any company mentioned on Streetwise Reports.
5) From time to time, Streetwise Reports and its directors, officers, employees or members of their families, as well as persons interviewed for articles and interviews on the site, may have a long or short position in securities mentioned. Directors, officers, employees or members of their immediate families are prohibited from making purchases and/or sales of those securities in the open market or otherwise from the time of the interview or the decision to write an article until three business days after the publication of the interview or article. The foregoing prohibition does not apply to articles that in substance only restate previously published company releases.

McAlinden Research Partners:
This report has been prepared solely for informational purposes and is not an offer to buy/sell/endorse or a solicitation of an offer to buy/sell/endorse Interests or any other security or instrument or to participate in any trading or investment strategy. No representation or warranty (express or implied) is made or can be given with respect to the sequence, accuracy, completeness, or timeliness of the information in this Report. Unless otherwise noted, all information is sourced from public data.

McAlinden Research Partners is a division of Catalpa Capital Advisors, LLC (CCA), a Registered Investment Advisor. References to specific securities, asset classes and financial markets discussed herein are for illustrative purposes only and should not be interpreted as recommendations to purchase or sell such securities. CCA, MRP, employees and direct affiliates of the firm may or may not own any of the securities mentioned in the report at the time of publication.

GBP Falling Amidst Second Wave Fears

By Orbex

Johnson Vows No Austerity

UK PM Boris Johnson unveiled plans over the weekend to help support the economy in the ongoing post-lockdown recovery.

Further easing of the lockdown restrictions is due to be announced over the coming days. Ahead of the July 4th date for the next review of conditions, the PM reassured the UK that it will “not go back to the austerity of 10 years ago”.

Infrastructure Spending to Increase

Speaking with UK journalists over the weekend, Johnson said:

“We’re going to make sure that we have plans to help people whose old jobs are not there anymore to get the opportunities they need.”

Johnsons went on to say that his government will be “doubling down on leveling up” its infrastructure spending in a bid to “build our way back to health”.

Pubs & Restaurants to Return July 4th

Johnson’s comments come at a crucial time as the nation, and the market, watches with bated breath as the UK lockdown eases further.

There have been fresh fears over the potential for a second outbreak of the virus. These concerns have come about due to the gradual reopening taking place across parts of the economy.

With pubs and restaurants opening next weekend, there are fears that the mild uptick in recent new infections will lead to a reintroduction of lockdown measures.

Leicester Facing Lockdown?

Reports over the weekend suggest that the government is considering reintroducing the city of Leicester to lockdown, on a localized basis.

This comes following a fresh outbreak in infections there, with 600 new cases reported over the last two weeks.

Fears of a second wave are intensifying mainly due to scenes of illegal raves and street parties taking places across the UK over the last week. In addition, the ongoing Black Lives Matter protests which have taken place across the UK are also raising concerns of increased infections.

BOE Warns Over Uncertainty

Such concerns will no doubt be troubling the Bank of England.

This is especially true given the record fall seen in GDP in April, which tanked 20.4% over the month.

The BOE has warned over a great deal of uncertainty in its outlook. And, despite projections of a gradual recovery from this point in line with the lifting of lockdown measures, governor Bailey has warned of the downside risks linked to the potential for a second wave of the virus.

The big question would be how the government chooses to respond to such circumstances. Will it simply reinstates a nationwide lockdown? Or will it perhaps look to use localized lockdowns instead, which might help cushion the blow and allow more of the economy to remain open?

This will depend greatly on how a second wave of the virus plays out and whether a spike is seen nationwide, or just in certain regions or cities.

GBPUSD Reversal Picking Up Pace

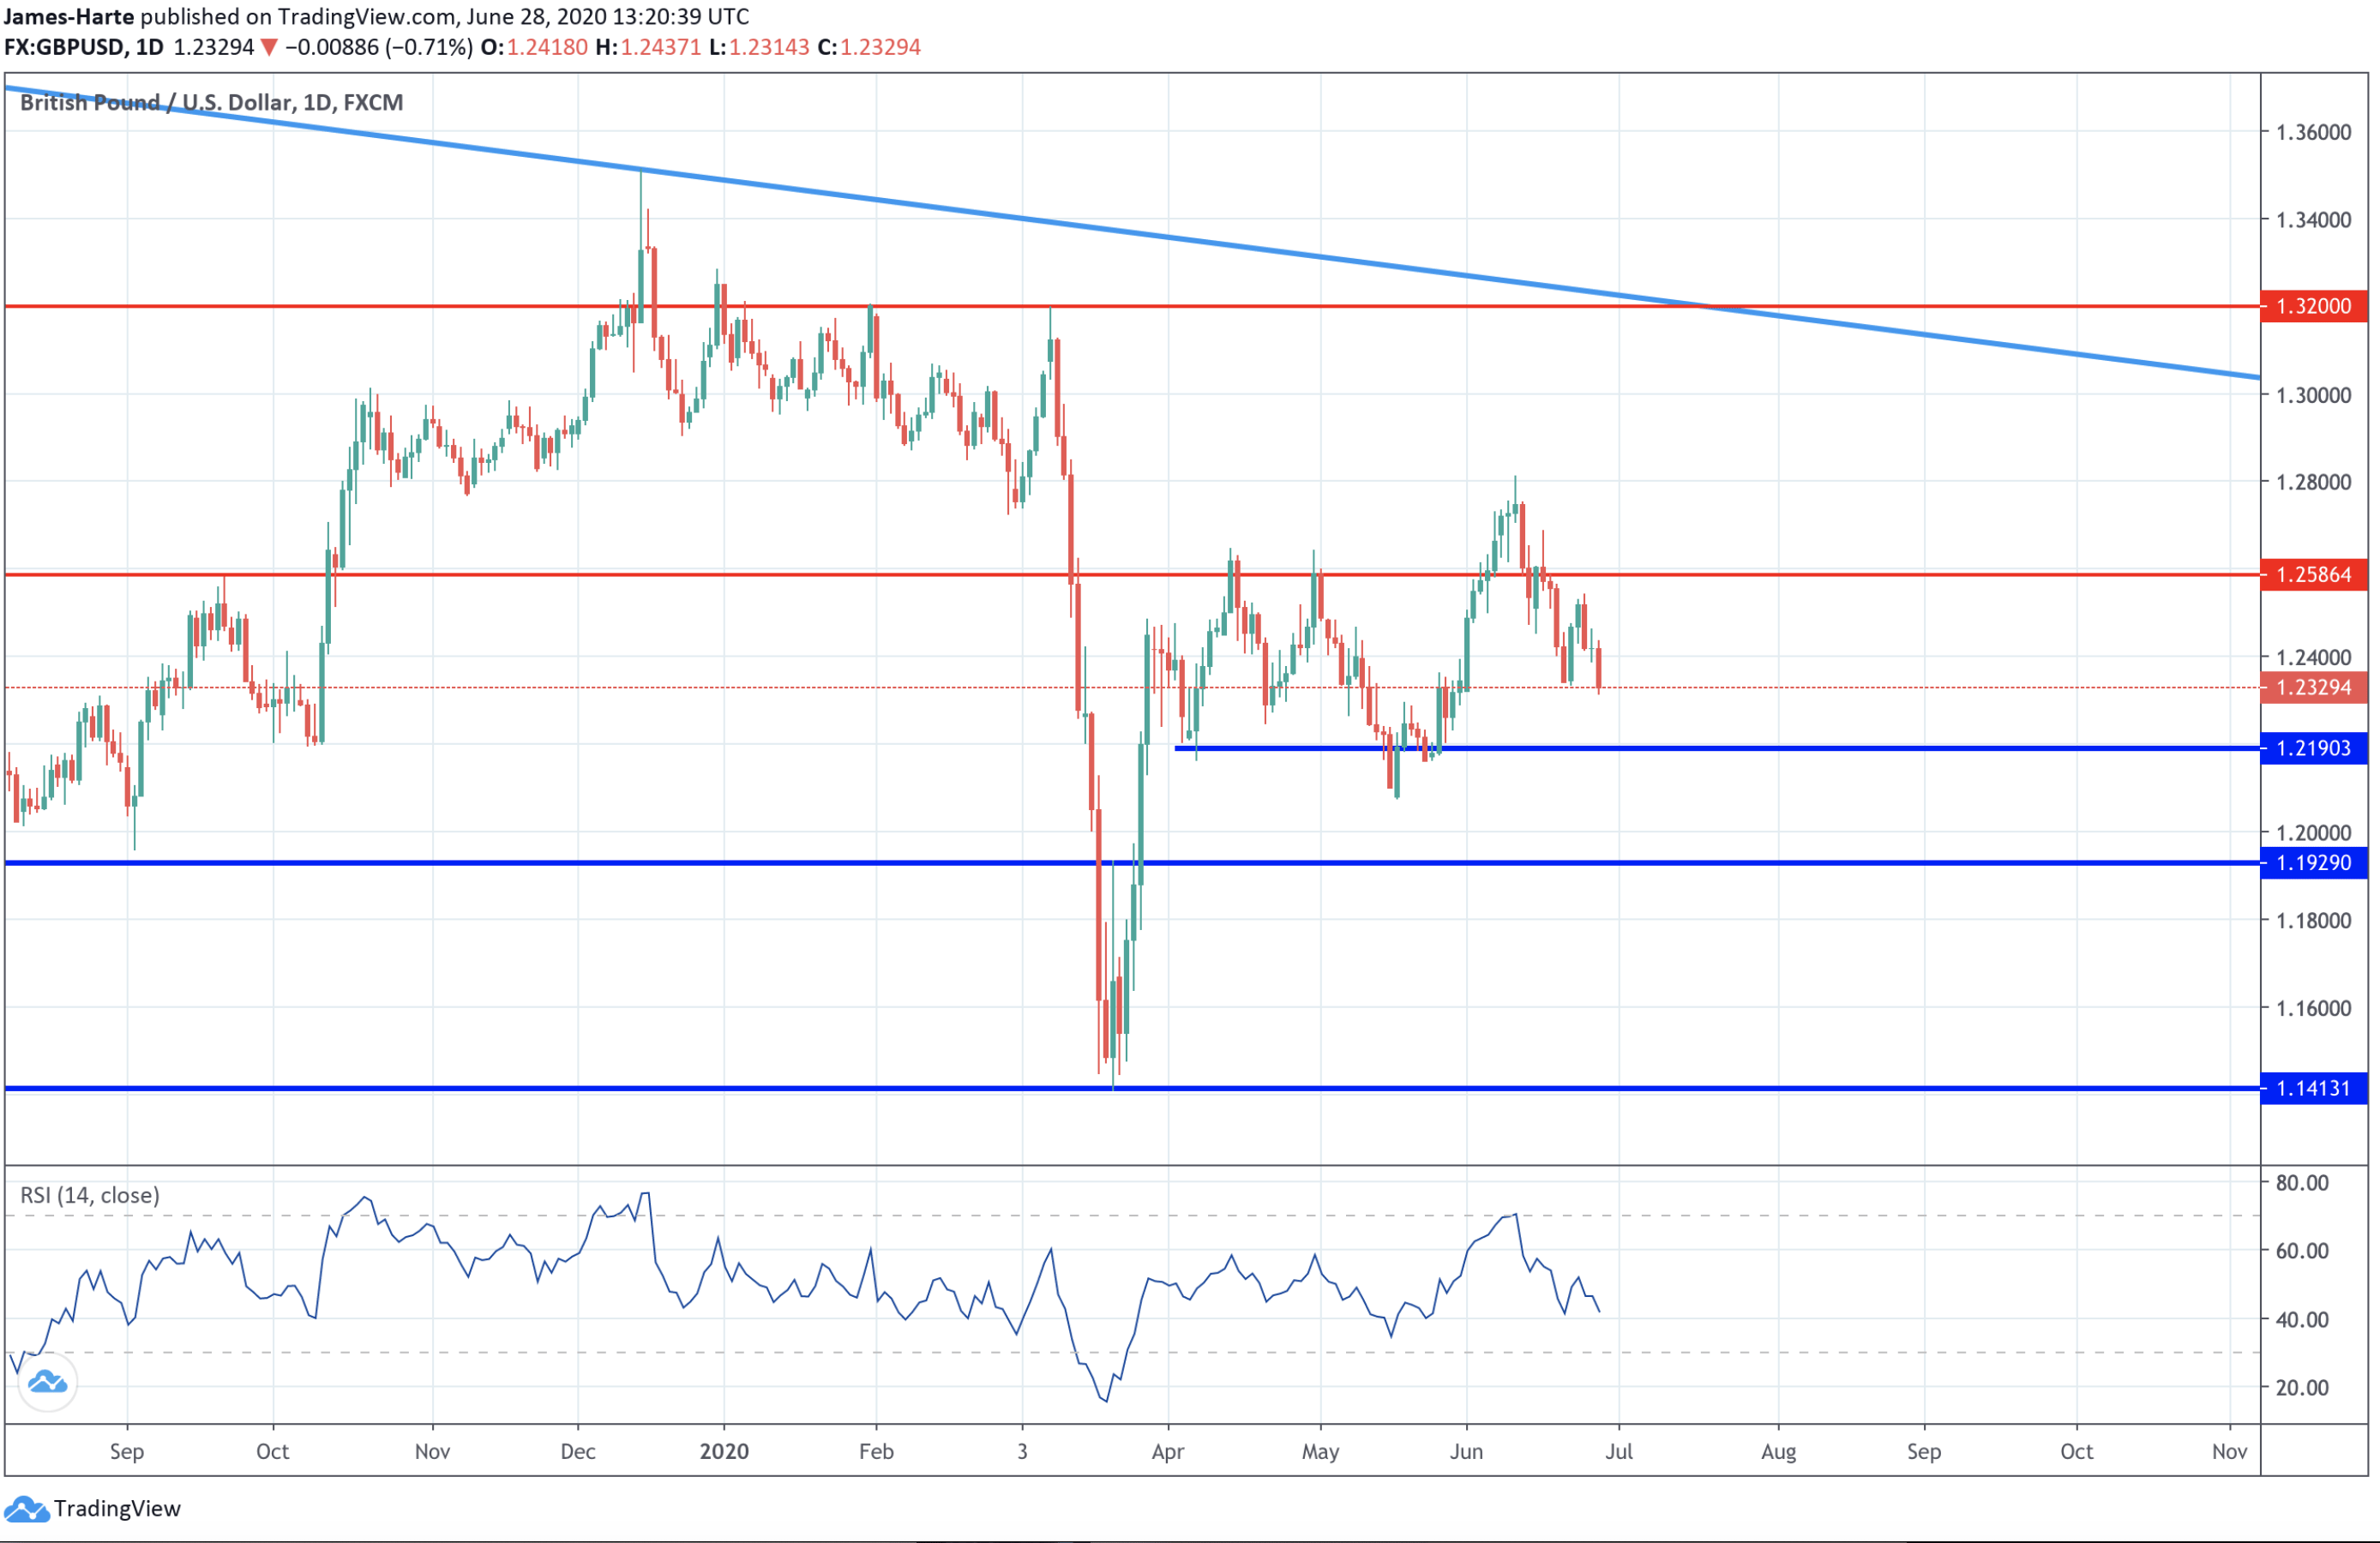
Price action in GBPUSD over recent months has proved frustrating with the 1.2190 – 1.2586 range seeing false breaks in both directions. Following the recent failure above the 1.2586 level, which has seen price reversing back below the level now, focus is turning to the 1.2190 level once again. If price sees a proper break of this level, the 1.1929 level support will then become the next downside zone to watch.

By Orbex

Fibonacci Retracements Analysis 29.06.2020 (GOLD, USDCHF)

Article By RoboForex.com

XAUUSD, “Gold vs US Dollar”

As we can see in the H4 chart, after breaking the high at 1764.86, XAUUSD is trying to fix above it. In the future, the price is expected to continue growing towards the post-correctional extension area between 138.2% and 161.8% fibo at 1800.60 and 1822.70 respectively. The support is at 1670.60.

GOLD_H4
Risk Warning: the result of previous trading operations do not guarantee the same results in the future

As we can see in the H1 chart, there was a divergence on MACD after the pair reached and broke the high at 1764.86, which made the price start a new correction to the downside. The first correctional impulse has already reached 23.6% fibo and may continue towards 38.2% and 50.0% fibo at 1737.75 and 1724.85 respectively. To complete the correction, XAUUSD must break the high at 1779.25.

GOLD_H1
Risk Warning: the result of previous trading operations do not guarantee the same results in the future

USDCHF, “US Dollar vs Swiss Franc”

As we can see in the H4 chart, after breaking the local correctional Triangle pattern to the downside, USDCHF is expected to break the low at 0.9376 and continue trading downwards. At the same time, the previous rising impulse may hint at further growth towards 38.2%, 50.0%, and 61.8% fibo at 0.9577, 0.9639, and 0.9700 respectively.

USDCHF_H4
Risk Warning: the result of previous trading operations do not guarantee the same results in the future

The H1 chart shows a more detailed structure of the current correction after the ascending impulse. The descending wave tested 76.0% fibo at 0.9419. The rising impulse that followed almost returned the price to 23.6% fibo and may later continue to reach the local high at 0.9553.

USDCHF_H1

Article By RoboForex.com

Attention!
Forecasts presented in this section only reflect the author’s private opinion and should not be considered as guidance for trading. RoboForex LP bears no responsibility for trading results based on trading recommendations described in these analytical reviews.

Weekly Fundamental Bulletin: Investors Eye US Payrolls Data

By Orbex

Last Week’s Highlights

US home sales fell by 9.7% in May

The monthly home sales report from the United States saw a 9.7% decline in May. This came despite interest rates staying at record lows.

Existing home sales fell by 3.91 million on a seasonally adjusted annual basis, according to data from the National Association of Realtors. The declines continue after home sales hit a 13-year high in February this year.

However, economists are confident that home sales in the coming months will start to rise again as lockdown restrictions ease in the US.

Germany’s business confidence improves

Business sentiment in Germany saw a strong improvement for the month of June. This is backed up by business expectations amid easing lockdown restrictions.

Data from the Ifo institute showed that Germany’s business climate index rose for the fourth month in a row. In June, the index touched 86.2 points, rising from 79.7 in May. This was slightly revised higher from 79.5 as reported earlier.

Economists forecast an increase to 85.0. The data for June was the second strongest jump recorded in a month, according to the Ifo institute.

RBNZ stays the course as interest rates & QE unchanged

The Reserve bank of New Zealand held its monetary policy meeting last week. The central bank left interest rates unchanged at a record low of 0.25%. It also did not tweak its QE purchases, maintaining the status quo.

The Reserve bank of New Zealand maintains its asset purchases at $60 billion NZD. Central bank officials said that they were ready to provide additional stimulus if needed, as well as expanding the size of its asset purchases.

The RBNZ gave a fairly balanced view of its policy, but economists have ruled out negative interest rates.

US Q1 GDP stays unchanged at -5.0%

The second revised estimates to the first quarter GDP saw no major revisions. As a result, the US economy contracted 5.0% in the first three months of the year. This comes after the US economy grew at a pace of 2.3% in 2019 and marked a 10th consecutive year of growth.

The market reaction was rather muted. This is because economists forecast that the second-quarter GDP decline will be much bigger than the first-quarter figures.

Upcoming Economic Events

China manufacturing PMI may ease for 3rd consecutive month

The new week starts off with China releasing its manufacturing and non-manufacturing PMI figures. On the manufacturing front, expectations are for PMIs to show a decline for the third consecutive month. This comes after manufacturing activity rebounded sharply in March to 52.0 from 35.7 in February.

However, since April, manufacturing activity is steadily on the decline. Forecasts for June indicate that manufacturing activity in China will fall to 50.4. Non-manufacturing services, on the other hand, are posting a steady increase. Forecasts show a soft print of 53.3.

Japan’s Tankan surveys set for a historic fall

The latest manufacturing and non-manufacturing Tankan surveys from the BoJ will be coming up this week. Economists predict that the Tankan large manufacturing index will fall from -8 in the second quarter to -30 in the third quarter.

The non-manufacturing index is also set to fall from +8 to -20. This would be the biggest decline in the index since 2009 but it reflects the current global economic state as well.

ISM manufacturing PMI to improve in June

Expectations are for manufacturing activity in the US, as measured by the Institute for Supply Management, to rise to 49.0 in June. While this is still below the 50-level on the index, it is nonetheless an improvement from 43.1 in May.

Regional indicators paint a mixed picture, however. This casts some doubts on the ISM print. Still, some parts of the US have been in a recovery phase, but this is offset by other regions that have extended the lockdown.

As a result, it might impact the ISM manufacturing activity during the month.

US unemployment rate to show gradual improvement

After the US unemployment rate surged to 14.7% in April, the trend has been lower. For June, the latest estimates show that the unemployment rate will continue to fall.

Forecasts show a decline from 13.3% in May to 12.5% in June, marking the second month of declines. We can expect payrolls to show a headline print of three million jobs being added back to the economy during the month. However, wages are set to fall 0.5% on the month, extending on the one percent fall a month ago.

By Orbex

Forex Technical Analysis & Forecast 29.06.2020

Article By RoboForex.com

EURUSD, “Euro vs US Dollar”

After completing the descending structure at 1.1200, EURUSD is expected to continue the correction and grow to reach 1.1250, at least. Later, the market may form a new descending structure with the target at 1.1150.

EURUSD
Risk Warning: the result of previous trading operations do not guarantee the same results in the future

GBPUSD, “Great Britain Pound vs US Dollar”

After reaching its downside target at 1.2315, GBPUSD is correction to reach 1.2387, at least, or even 1.2425. After that, the instrument may resume falling with the target at 1.2275.

GBPUSD
Risk Warning: the result of previous trading operations do not guarantee the same results in the future

USDRUB, “US Dollar vs Russian Ruble”

USDRUB is moving upwards to break 69.70 and may continue the correction towards 70.34. After that, the instrument may start a new decline to return to 69.70 and then form one more ascending structure with the short-term target at 70.84.

USDRUB
Risk Warning: the result of previous trading operations do not guarantee the same results in the future

USDJPY, “US Dollar vs Japanese Yen”

USDJPY is consolidating below 107.36. Possibly, today the pair may fall towards 106.76 and then form one more ascending structure to break 107.36. Later, the market may continue trading upwards with the short-term target at 107.85.

USDJPY
Risk Warning: the result of previous trading operations do not guarantee the same results in the future

USDCHF, “US Dollar vs Swiss Franc”

USDCHF is consolidating around 0.9474. Today, the pair may fall towards 0.9452 and then grow to return to 0.9474. Later, the market may start a new descending correction with the target at 0.9444.

USDCHF
Risk Warning: the result of previous trading operations do not guarantee the same results in the future

AUDUSD, “Australian Dollar vs US Dollar”

After reaching the short-term downside target at 0.6840, AUDUSD is expected to correct towards 0.6900. After that, the instrument may start a new decline to break 0.6830 and then continue trading downwards with the target at 0.6785.

AUDUSD
Risk Warning: the result of previous trading operations do not guarantee the same results in the future

BRENT

Brent is falling to reach 39.64. After that, the instrument may start consolidating. If later the price breaks this range to the downside, the market may resume trading downwards with the short-term predicted target at 37.60.

BRENT
Risk Warning: the result of previous trading operations do not guarantee the same results in the future

XAUUSD, “Gold vs US Dollar”

Gold is forming a narrow consolidation range around 1769.85. Possibly, the pair may continue growing towards 1780.50 and then start a new correction to reach 1769.50. Later, the market may form one more ascending structure with the short-term target at 1791.85.

GOLD
Risk Warning: the result of previous trading operations do not guarantee the same results in the future

BTCUSD, “Bitcoin vs US Dollar”

After completing the descending wave at 8800.00, BTCUSD is expected to correct towards 9200.00 and test it from below. Later, the market may resume trading downwards to reach 8700.00 and then form a new consolidation range around it.

BITCOIN
Risk Warning: the result of previous trading operations do not guarantee the same results in the future

S&P 500

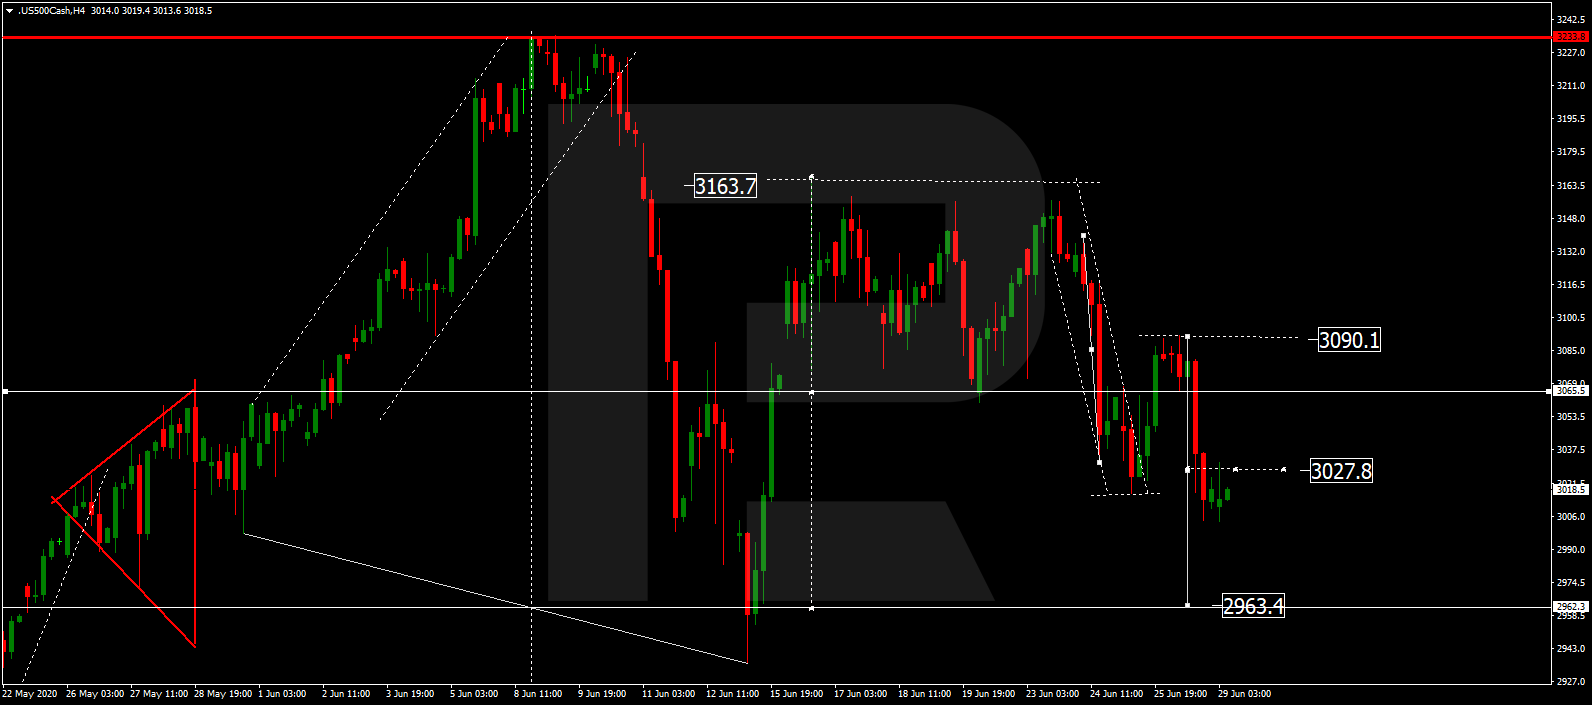
The Index is still falling towards 2963.4. After that, the instrument may form a new consolidation range. If later the price breaks this range to the downside, the market may resume trading inside the downtrend with the short-term predicted target at 2750.5.

S&P 500

Article By RoboForex.com

Attention!
Forecasts presented in this section only reflect the author’s private opinion and should not be considered as guidance for trading. RoboForex LP bears no responsibility for trading results based on trading recommendations described in these analytical reviews.

Oil Looking Down Again

By Dmitriy Gurkovskiy, Chief Analyst at RoboForex

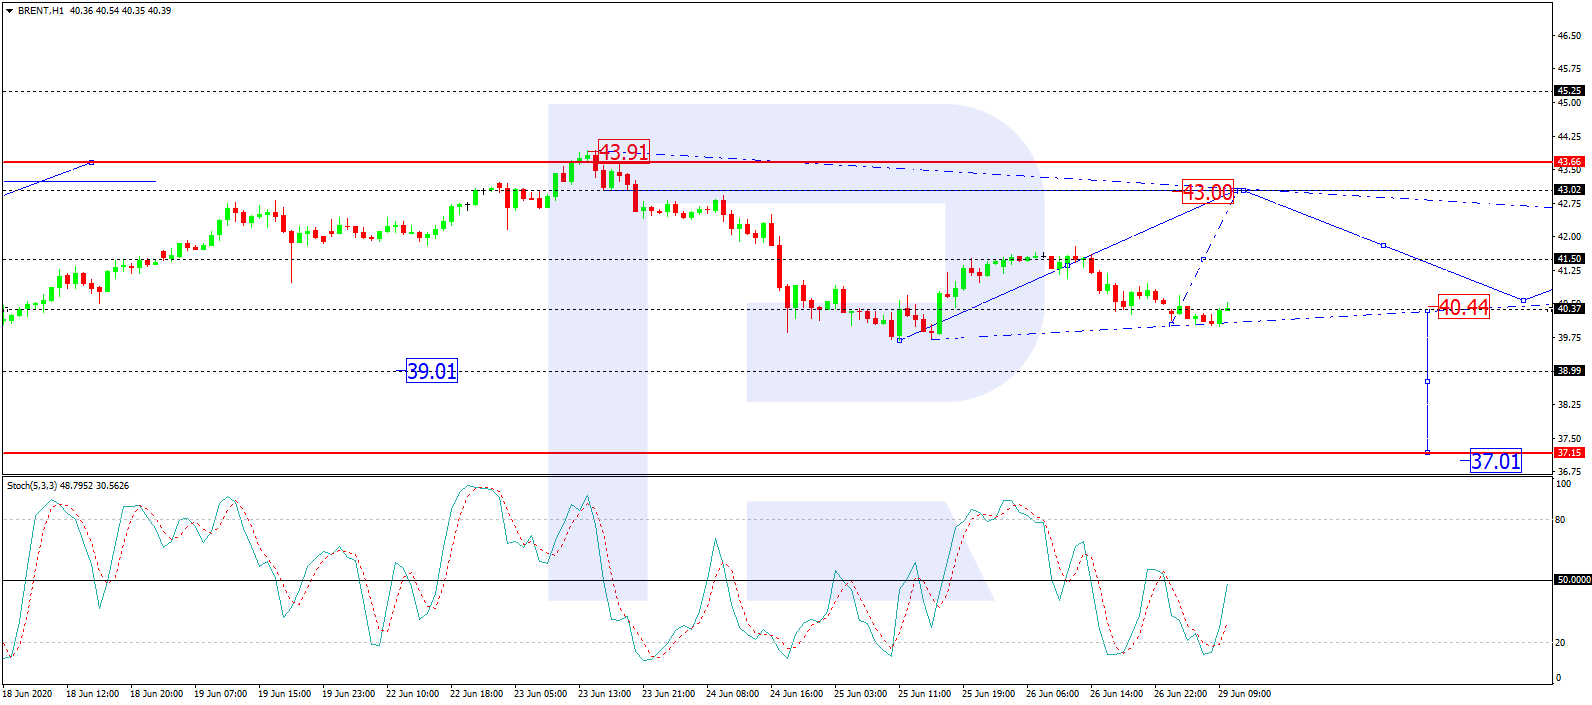
On the last Monday of June, oil is moving downwards quite fast. Brent is under significant pressure and trading at $40.39.

Investors are pretty nervous because of monitoring the number of new COVID-19 cases. First of all, we’re talking about the USA, and it is reviving fears and concerns about the second wave of the coronavirus pandemic. Market players are really afraid of new outbreaks because a possible new wave of the disease may transform into something much more serious and make all the efforts put into stabilizing the global economy useless. If the world is flooded with the second wave, the demand for energies may go down and, as a result, commodity prices may plunge as well.

In the USA, potentially dangerous places right now are Texas, Florida, and Los Angeles.

The latest data from Baker Hughes showed another decline in the number of rigs in the USA. For example, since the beginning of the year, the number of oil rigs has dropped by 70%. Over the last week, the total number of rigs (bot oil and gas) lost 1 unit and now equals 265. It’s the lowest number since May 2009.

In the H4 chart, after finishing the descending impulse at 40.00 and the correction towards 41.74, Brent is expected to consolidate between these two levels. Possibly, the pair may form a Triangle pattern. If later the price breaks this range to the downside, the market may resume moving within the downtrend to reach 39.00 or even deeper, 37.00; if to the upside – form one more ascending structure towards 43.00 or even 45.20. From the technical point of view, this scenario is confirmed by MACD Oscillator: its signal line is moving below 0, thus implying a further decline of the price chart towards 39.00. However, if the line rises and breaks 0, the price chart may start rising to reach 43.00.

As we can see in the H1 chart, after breaking 40.00 to the downside, Brent is expected to fall with the short-term target at 39.00 and then start a new correction to test 39.50 from below. After that, the instrument may start a new decline to reach 37.00. However, this scenario may no longer be valid if the market grows towards 41.90. In this case, the asset may continue trading upwards to reach 43.00. From the technical point of view, this idea is confirmed by Stochastic Oscillator: its signal line is rising directly towards 50. If the line breaks this level, it may continue its ascending movement towards 80.

Disclaimer

Any predictions contained herein are based on the author’s particular opinion. This analysis shall not be treated as trading advice. RoboForex shall not be held liable for the results of the trades arising from relying upon trading recommendations and reviews contained herein.