Bloom Energy Shares Charge Higher on Partnership with Samsung for Clean Powered Ships

The Energy Report

Source: Streetwise Reports   06/30/2020

Shares of clean fuel cell technology company Bloom Energy traded 30% higher after the firm reported it is advancing plans for clean power ships in a joint development agreement with Samsung Heavy Industries.

Solid oxide fuel cell technology company Bloom Energy Corp. (BE:NYSE) and Samsung Heavy Industries Co. Ltd. (010140:KRX) (SHI), a part of Samsung Group, announced that they “have signed a joint development agreement (JDA) to design and develop fuel cell-powered ships.” The two companies reported that they are partnering to work together toward achieving clean power for ships and creating a more sustainable vessels for the marine shipping industry.

Samsung Heavy Industries’ VP of shipbuilding and drilling sales engineering Haeki Jang commented, “By signing this joint development agreement, SHI has a plan to develop eco-friendly ships that will lead the future of the industry…Our goal is to replace all existing main engines and generator engines with these highly efficient solid oxide fuel cells to align with the International Maritime Organization’s 2030 and 2050 environmental targets.”

The company indicated that SHI will be actively involved in the joint development from start to completion in order to achieve the task of building highly efficient fuel cell-powered ships. In turn, Bloom Energy will deploy its cross-functional engineering team to adapt its servers to the specific requirements relative to the marine environment.

The firm mentioned in the report that the companies are now proceeding with the next milestone in their joint development efforts and hope to be ready to present the design to potential customers in 2022. The company advised that “following commercialization, the two companies anticipate that the market for Bloom Energy Servers on SHI ships could grow to 300 megawatts annually.”

The company noted that this joint project fits well with the International Maritime Organization’s mandatory emissions reduction goals set for 2050.

KR Sridhar, founder, chairman and CEO of Bloom Energy, remarked, “The marine shipping industry has the ability to make a substantial impact on emissions and air quality at ports and across our planet…We see a collaboration with one of the world’s largest shipbuilders, SHI, as a moment to make measurable strides in reducing emissions and extending our mission for clean, reliable energy to the seas.”

Bloom Energy, which is headquartered in San Jose, Calif., stated that “its mission is to make clean, reliable energy affordable for everyone in the world.” The firm stated its clients include several Fortune 100 companies and leaders in data centers, healthcare, higher education, manufacturing, retail, public utilities and other industries. The company explained that that “its product, the Bloom Energy Server, delivers highly reliable and resilient, always-on electric power that is clean, cost-effective, and ideal for microgrid applications.”

Bloom Energy began the day with a market capitalization of around $1.0 billion with approximately 125.2 million shares outstanding. BE shares opened greater than 10% higher today at $9.08 (+$0.86, +10.46%) over yesterday’s $8.22 closing price. The stock has traded today between $9.05 to $10.94 per share and is currently trading at $10.96 (+$2.74, +33.33%).

Sign up for our FREE newsletter at: www.streetwisereports.com/get-news

Disclosure:
1) Stephen Hytha compiled this article for Streetwise Reports LLC and provides services to Streetwise Reports as an independent contractor. He or members of his household own securities of the following companies mentioned in the article: None. He or members of his household are paid by the following companies mentioned in this article: None.
2) The following companies mentioned in this article are billboard sponsors of Streetwise Reports: None. Click here for important disclosures about sponsor fees.
3) Comments and opinions expressed are those of the specific experts and not of Streetwise Reports or its officers. The information provided above is for informational purposes only and is not a recommendation to buy or sell any security.
4) The article does not constitute investment advice. Each reader is encouraged to consult with his or her individual financial professional and any action a reader takes as a result of information presented here is his or her own responsibility. By opening this page, each reader accepts and agrees to Streetwise Reports’ terms of use and full legal disclaimer. This article is not a solicitation for investment. Streetwise Reports does not render general or specific investment advice and the information on Streetwise Reports should not be considered a recommendation to buy or sell any security. Streetwise Reports does not endorse or recommend the business, products, services or securities of any company mentioned on Streetwise Reports.
5) From time to time, Streetwise Reports LLC and its directors, officers, employees or members of their families, as well as persons interviewed for articles and interviews on the site, may have a long or short position in securities mentioned. Directors, officers, employees or members of their immediate families are prohibited from making purchases and/or sales of those securities in the open market or otherwise from the time of the interview or the decision to write an article until three business days after the publication of the interview or article. The foregoing prohibition does not apply to articles that in substance only restate previously published company releases.

( Companies Mentioned: BE:NYSE,
)

Analyst: New Discoveries Could Point to Regional Scale of Gold Mineralization at Quebec Project

By The Gold Report

Source: Streetwise Reports   06/30/2020

Recent drill results and project model changes, leading to an increased target price on Troilus Gold, are outlined in a Canaccord Genuity report.

In an April 24 research note, analyst Tom Gallo reported that after updating its gold price forecast, Canaccord Genuity increased its target price on Troilus Gold Corp. (TLG:TSX; CHXMF:OTCQB) to CA$1.70 per share from CA$1.20. Troilus stock is now priced at CA$1.03 per share.

Canaccord increased its projected gold price to US$1,716 per ounce from US$1,631. Given this environment, Gallo also reported, new discoveries at the Troilus gold project in Quebec are “shining light on better potential project economics.” Canaccord’s estimated net asset value of the Troilus gold project increased to CA$594 million from CA$242 million, excluding the CA$72 million in value of the non-priority underground resource there.

Gallo reviewed Troilus Gold’s recent new discovery in the Troilus project’s Southwest zone, and noted that based on drill results from that, Canaccord added to its Troilus model 353,000 ounces at 1.1 grams per ton (1.1 g/t) gold in additional conceptual resources.

In Southwest, the drill bit encountered grades above 2 g/t gold at significant widths, which “support the potential regional scale of this mineralized system,” highlighted Gallo. TLG-ZSW20-189, one of several highlight holes, demonstrated high-grade intercepts at Southwest. It returned 1.56 g/t gold equivalent (Au eq) over 73 meters (37m), including 2.05 g/t Au eq over 48m; 1.23 g/t Au eq over 6m from surface; 0.98 g/t Au eq over 13m including 1.9 g/t Au eq over 3m and 2.17 g/t Au eq over 2.2m.

Gallo pointed out that the strike length at Troilus, currently extending 4.5 kilometers from the J zones to the Southwest zone, is noteworthy. He wrote that it “could have positive implications for a potential future large operation, especially in a high gold price environment” despite the property’s overall lower grade.

Canaccord Genuity has a Speculative Buy rating on Troilus Gold.

Sign up for our FREE newsletter at: www.streetwisereports.com/get-news

Disclosure:
1) Doresa Banning compiled this article for Streetwise Reports LLC and provides services to Streetwise Reports as an independent contractor. She or members of her household own securities of the following companies mentioned in the article: None. She or members of her household are paid by the following companies mentioned in this article: None.
2) The following companies mentioned in this article are billboard sponsors of Streetwise Reports: Troilus Gold. Click here for important disclosures about sponsor fees.
3) Comments and opinions expressed are those of the specific experts and not of Streetwise Reports or its officers. The information provided above is for informational purposes only and is not a recommendation to buy or sell any security.
4) The article does not constitute investment advice. Each reader is encouraged to consult with his or her individual financial professional and any action a reader takes as a result of information presented here is his or her own responsibility. By opening this page, each reader accepts and agrees to Streetwise Reports’ terms of use and full legal disclaimer. This article is not a solicitation for investment. Streetwise Reports does not render general or specific investment advice and the information on Streetwise Reports should not be considered a recommendation to buy or sell any security. Streetwise Reports does not endorse or recommend the business, products, services or securities of any company mentioned on Streetwise Reports.
5) From time to time, Streetwise Reports LLC and its directors, officers, employees or members of their families, as well as persons interviewed for articles and interviews on the site, may have a long or short position in securities mentioned. Directors, officers, employees or members of their immediate families are prohibited from making purchases and/or sales of those securities in the open market or otherwise from the time of the interview or the decision to write an article until three business days after the publication of the interview or article. The foregoing prohibition does not apply to articles that in substance only restate previously published company releases.

Disclosures from Canaccord Genuity, Troilus Gold Corp., Raising Target Price, April 24, 2020

Analyst Certification: Each authoring analyst of Canaccord Genuity whose name appears on the front page of this research hereby certifies that (i) the recommendations and opinions expressed in this research accurately reflect the authoring analyst’s personal, independent and
objective views about any and all of the designated investments or relevant issuers discussed herein that are within such authoring
analyst’s coverage universe and (ii) no part of the authoring analyst’s compensation was, is, or will be, directly or indirectly, related
to the specific recommendations or views expressed by the authoring analyst in the research, and (iii) to the best of the authoring
analyst’s knowledge, she/he is not in receipt of material non-public information about the issuer.

Analysts employed outside the US are not registered as research analysts with FINRA. These analysts may not be associated
persons of Canaccord Genuity LLC and therefore may not be subject to the FINRA Rule 2241 and NYSE Rule 472 restrictions on communications with a subject company, public appearances and trading securities held by a research analyst account.

Required Company-Specific Disclosures (as of date of this publication)

Troilus Gold Corp. currently is, or in the past 12 months was, a client of Canaccord Genuity or its affiliated companies. During this period, Canaccord Genuity or its affiliated companies provided investment banking services to Troilus Gold Corp.
In the past 12 months, Canaccord Genuity or its affiliated companies have received compensation for Investment Banking services from Troilus Gold Corp.
In the past 12 months, Canaccord Genuity or any of its affiliated companies have been lead manager, co-lead manager or comanager of a public offering of securities of Troilus Gold Corp. or any publicly disclosed offer of securities of Troilus Gold Corp. or in any related derivatives.
Canaccord Genuity or one or more of its affiliated companies intend to seek or expect to receive compensation for Investment Banking services from Troilus Gold Corp. in the next three months.
An analyst has visited the material operations of Troilus Gold Corp. Partial payment was received for the related travel costs.

( Companies Mentioned: TLG:TSX; CHXMF:OTCQB,
)

Why companies as diverse as eBay, IKEA and Mars are increasingly supporting US clean energy policies

By Zdravka Tzankova, Vanderbilt University

The Research Brief is a short take about interesting academic work.

The big idea

My new analysis of companies that seek to buy renewable electricity finds that business is becoming a powerful new ally in the U.S. political battle to stop climate change. Driven by pressure from environmental groups and by the increasingly competitive prices of wind and solar, many companies have pledged to power their operations with clean energy. But the legal and technical complexity of U.S. electricity markets has stalled corporate progress on their clean power goals. This has prompted companies as diverse as eBay, Mars, IKEA and Walmart to push for public policies that expand the generation of renewable energy in the U.S. and make it more accessible through mandates, incentives and other regulations.

Why it matters

Politically powerful fossil fuel interests have long steered U.S. policy toward carbon-intensive energy and economy. Increased business lobbying for clean energy policies by the likes of Nestle, Salesforce, Unilever and other large companies has the potential to tip the political scale in favor of a carbon-free
economy and help the U.S. reach or exceed Paris Agreement emissions targets.

What still isn’t known

It is still unclear if clean energy efforts by corporate energy buyers will be enough to outweigh the massive political influence of the fossil fuel industry in time to avert the worst effects of climate change. There’s little evidence of a slowdown in lobbying by fossil fuel interests, so the question is whether corporate lobbying for clean energy will ramp up fast enough to change the course of U.S. climate and energy policy.

What’s next

For my next project, I plan to compile a database of companies and industries that are struggling to meet pledges for greening various corporate operations and supply chains. Using this database, I aim to identify cases in which stronger public environmental policies can help businesses meet a range of environmental commitments. I further aim to identify ways to mobilize business advocacy in favor of stronger environmental policies.

About the Author:

Zdravka Tzankova, Associate Professor of Sociology, Vanderbilt University

This article is republished from The Conversation under a Creative Commons license. Read the original article.


Saudi Arabia Eyes Total Dominance In Oil And Gas

By OilPrice.com

– Saudi Arabia’s Energy Minister Prince Abdulaziz claimed last week that the Kingdom will be the world’s biggest hydrocarbon producer “even” in 2050.

“I can assure that Saudi Arabia will not only be the last producer, but Saudi Arabia will produce every molecule of hydrocarbon and it will put it to good use … It will be done in the most environmentally sound and safe way and the most sustainable way,” Abdulaziz said when asked about the oil market outlook in 2050 during a virtual conference convened by Saudi Arabia’s Future Investment Initiative Institute (FII-I).

Abdulaziz added that Saudi Arabia “will be the last and biggest producer of hydrocarbon even then,” referring to 2050.

But is Saudi Arabia’s the world’s leading hydrocarbon producer now? And what is its legitimate prospect for being the largest hydrocarbon producer in 2050?

‘Hydrocarbon’ Explained

To unpack what the prince is claiming, we first must understand the hydrocarbon classification. A hydrocarbon is an organic compound that contains only carbon and hydrogen. This encompasses petroleum, natural gas, and condensates.

Is Saudi Arabia the world’s largest hydrocarbon producer?

Saudi Arabia’s oil production in 2019, which includes crude oil, all other petroleum liquids, and biofuels–this would include natural gas plant liquids and condensate–was an average of 11.81 million bpd, according to the Energy Information Administration (EIA). At 12% of the world’s total, it’s no wonder why Saudi Arabia holds so much market sway, especially when in cahoots with the rest of the OPEC members.

Russia, too, is right up there, producing an average of 11.49 million bpd, or 11% of the world’s total. This is also no wonder, then, that when you put Russia and Saudi Arabia together to “stabilize” the world’s oil supply to balance it with demand, it creates a crude oil production powerhouse that is unmatched.

But individually speaking, Saudi Arabia is not king of the oil production hill, for its nemesis–the country that sought to undo every production quota OPEC could come up with, is the United States. On its own, the United States produced 19.51 million barrels of oil (and other petroleum liquids) per day, besting both Saudi Arabia and Russia, and controlling 19% of the world’s oil supplies.

The rest of the countries on their own are significantly further down the list, with not one of them producing more than half of third-place Russia. Still, Canada and China–#4 and #5 respectively–are still worth mentioning.


But Saudi Arabia expects to be the largest hydrocarbon producer “still” in 2050. If they are not so now, what are the chances they will be so thirty years from now?

Perhaps out of step with Saudi Arabia’s grand Vision 2030 plan, The Kingdom is still hoping to be top dog for petroleum production decades from now.

The EIA, in its Annual Energy Outlook 2020, has forecast that global production of crude oil and lease condensate, natural gas plant liquids, dry natural gas, and coal in the United States will reach 90.29 quadrillion Btus in its reference case. For crude oil and lease condensate, the EIA expects that the United States will be on par with where it is today, in its reference case. For natural gas plant liquids production, the EIA anticipates an increase by 2050.

Source: EIA Annual Energy Outlook 2020

The reason for the EIA assuming oil production will level off in 2022 and holding fairly steady through 2045 is the anticipated decline in well productivity, forcing tight oil producers to hunt for oil is less prolific areas.

For Saudi Arabia, its 30-year hydrocarbon plan or abilities are more of an unknown. It has the world’s second-largest crude oil reserves, and it does have plans to add natural gas production in the coming years as it looks to step away from its near-total reliance on crude oil.

For natural gas, Saudi Arabia announced earlier this year that it may actually bring forward its plans to export natural gas by 2030. It did not, however, provide details about this plan, or how it would be implemented.

But its detail less plans may run into some trouble. For starters, while Saudi Arabia has an excess of low-cost associated gas reserves that it could tap, the production of said gas would be limited to the amount of crude it can produce. And crude oil production is periodically–and profoundly so right now–capped by OPEC agreements that keep the Kingdom’s fossil fuel ambitions in check.

But the EIA sees the OPEC countries besting non-OPEC countries on the production front by 2050

By 2050, the EIA sees the production of crude oil, lease condensate, natural gas plant liquids (NGPLs) and other liquid fuels from 2018 to 2050 reaching 121.5 million barrels per day (b/d) in 2050, or about 21% more than 2018 levels.

For crude oil and lease condensate, the EIA sees OPEC members increasing production by 9.5 million bpd, and non-OPEC countries increasing their crude oil and lease condensate production by 8 million bpd. This translates into a 27% increase for OPEC countries and a 17% increase for non-OPEC countries, according to the EIA’s International Annual Energy Outlook.

Overall, the EIA expects the OPEC countries to produce 56% of total global production in 2050.

Most of that production increase that OPEC nations (27%) will see will come from the Middle East, which is expected to increase by 35% to 2050.


Meanwhile, production in Russia (14%) and Canada (123%) are expected to increase at a quicker rate than the United States (8%) and Brazil (50%).

Using historical production figures courtesy of BP and forecasts published by peakoilbarrel, the top four oil producers remain in their positions through 2050.

Toeing the Saudi Line

Prince Abdulaziz’s chest-puffing seems to be in line with Saudi Arabia’s previous assertions that oil will be alive and well in 2050 despite attempts to spur the world along an energy transition. Even as far back as 2007, Aramco said it could boost reserves to as many as 1 trillion barrels by 2027, adding that it would be 2050 or later before production peaks.

But some of Saudi Arabia’s forecasts of fossil fuel’s future were more sober-minded, even seeing a phasing out of fossil fuels by the middle of this century, Ali al-Naimi, Saudi Arabia’s oil minister at the time said in 2015.

“In Saudi Arabia, we recognize that eventually, one of these days, we are not going to need fossil fuels. I don’t know when, in 2040, 2050 or thereafter,” al-Naimi said, adding that Saudi Arabia was therefore planning on becoming a “global power in solar and wind energy.”

Link to original article: https://oilprice.com/Energy/Crude-Oil/Saudi-Arabia-Eyes-Total-Dominance-In-Oil-And-Gas.html

By Julianne Geiger for Oilprice.com


China, Covid, Trump and Brexit: Investors’ top concerns for the second half of 2020

By George Prior

– The China-rest of the world relations, the trajectory of the Covid-19 pandemic, the U.S. election and Brexit are the top concerns for investors for the last six months of 2020.

The observations from Nigel Green, CEO and founder of deVere Group, one of the world’s largest independent financial advisory and fintech organizations, come as the world readjusts after arguably the most turbulent six months in more than 70 years.

Mr Green says: “On the very first day of this new decade, the media reported for the first time on an outbreak of viral pneumonia in the Chinese city of Wuhan.

“Six months on and Covid-19 has changed the world forever.

“We’re in a new era and this will, of course, have potential repercussions on investment decision-making as we move into the second half of this most unusual of years.

“As investors, we should brace ourselves for more headwinds, which are likely to drag on growth and returns, than tailwinds, which enhance growth and help fuel positive returns.”

The deVere CEO says that he believes there are, currently, four key headwinds that investors need to monitor carefully in H2 2020.

“First, relationship developments between China –  the world’s second largest economy and major driver of global economic growth – and the rest of the world.

The major areas of concern are the simmering trade tensions with the U.S. – the world’s largest economic power; the fallout from allegations from some Western leaders regarding China’s culpability in the coronavirus pandemic; the impact of international condemnation regarding Beijing’s crackdown on Hong Kong’s independence; and accusations of ‘state-sponsored’ cyber attacks.”

He continues: “Second, how easing coronavirus lockdowns and reopening of society and economies could cause new accelerations in infections which would dampen hopes of a quick and sustainable economic recovery.

“Third, the uncertainty that can be expected to be triggered by this year’s U.S. presidential election.

“The 2020 U.S. presidential election is seen by many as particularly important as not only will whoever wins be the CEO of the world’s largest economy, they will be in that role as the world economically readjusts following the global fallout of coronavirus.”

“And fourth, the risk of a no-deal Brexit for the UK, EU and global economies remains a key headwind.  The UK government has so far not withdrawn from its threat to walk away without a trade agreement in place, despite the mass financial disruption caused by the pandemic.”

All in all, there’s more uncertainty to come that could affect global investors. However, there are three major tailwinds, says Nigel Green.

“First, governments across the globe are willing to provide considerable, often historic, levels of stimulus to support economic recovery.

“Second, central banks around the world have said that they do not believe that they are yet out of significant ammunition.

“And third, the rise of fintech has lead to more and more individuals across the world successfully saving and investing for their future at reduced costs.”

In this vein, after the U.S. Federal Reserve’s last expansion to its already record-beating stimulus programme on June 16, the deVere CEO said: “This extra stimulus acts as a ‘backstop’ or ‘floor’ for equities.

“The additional Fed support was widely expected by the markets and therefore, investors who have been paying attention have been topping-up their investment portfolios recently as entry points will inevitably continue to go higher as we move forward.”

Mr Green concludes: “There are challenges as well as major opportunities ahead for the second half of 2020.

“Investors should remain invested because history teaches us that markets go up over the long term.

“In addition, investment portfolios must be adequately diversified across asset classes, sectors, regions and currencies. This is the investor’s best weapon to capitalize on the opportunities and sidestep risks.”

About:

deVere Group is one of the world’s largest independent advisors of specialist global financial solutions to international, local mass affluent, and high-net-worth clients.  It has a network of more than 70 offices across the world, over 80,000 clients and $12bn under advisement.


Japanese Candlesticks Analysis 02.07.2020 (GOLD, NZDUSD, GBPUSD)

Article By RoboForex.com

XAUUSD, “Gold vs US Dollar”

As we can see in the H4 chart, the ascending tendency continues. After finishing the pullback and testing the support level, XAUUSD has formed a Hammer pattern. At the moment, the price may start reversing to continue the uptrend. In this case, the upside target is at 1791.00. At the same time, one shouldn’t exclude an alternative scenario, according to which the market may fall and return to 1755.00.

XAUUSD
Risk Warning: the result of previous trading operations do not guarantee the same results in the future

NZDUSD, “New Zealand vs. US Dollar”

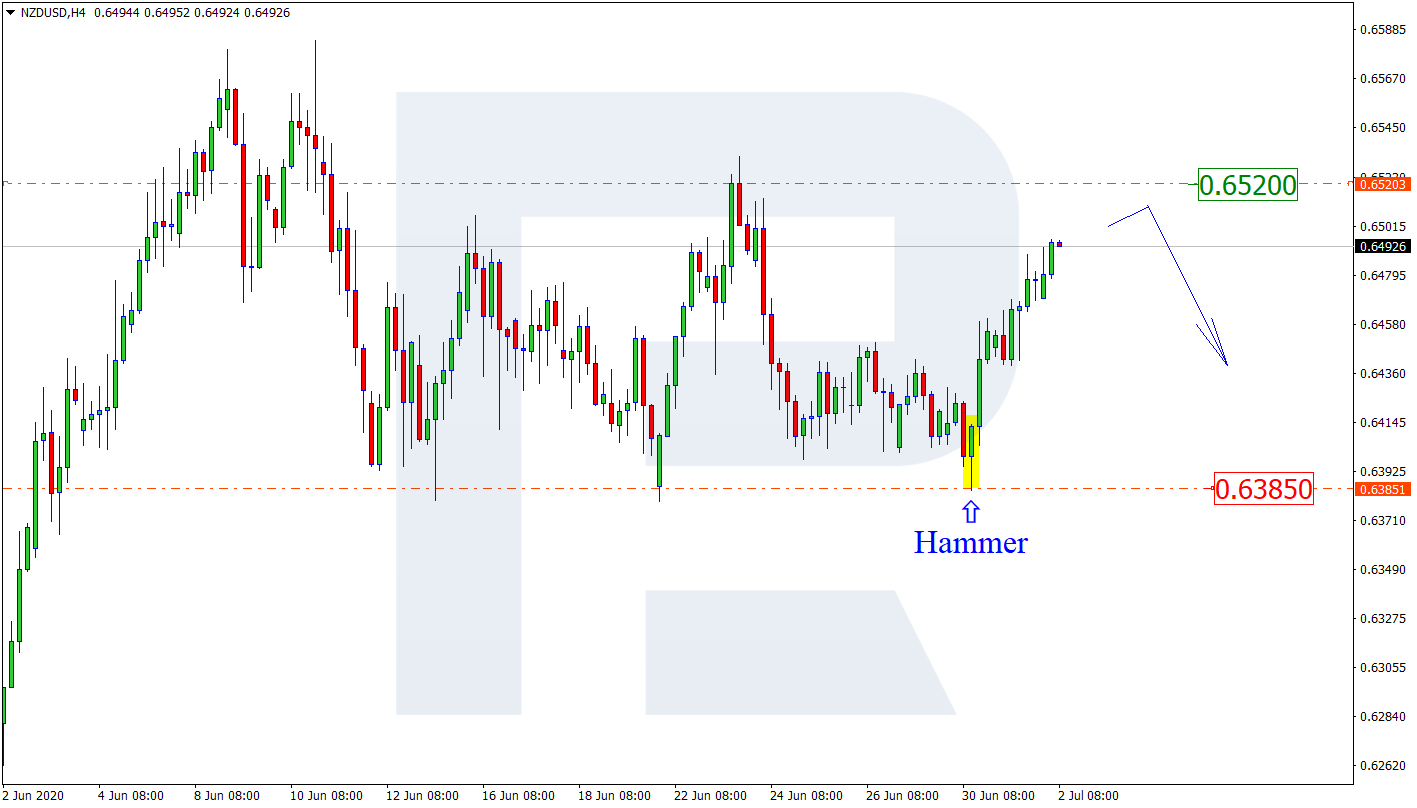
As we can see in the H4 chart, the sideways tendency continues. After forming several reversal patterns, such as Hammer, not far from the support level, NZDUSD is reversing. Possibly, the pair may reverse and start a new growth to reach the resistance area at 0.6520. After testing this area, the instrument may resume falling towards 0.6385.

NZDUSD
Risk Warning: the result of previous trading operations do not guarantee the same results in the future

GBPUSD, “Great Britain Pound vs US Dollar”

As we can see in the H4 chart, after forming a Doji pattern while testing the resistance level, GBPUSD has started reversing. At the moment, the pair is expected to continue the descending tendency. In this case, the downside target is at 1.2272. Still, there is another scenario, which suggests that the instrument may continue the trading upwards to reach 1.2530 without reversing and forming any significant corrections.

GBPUSD

Article By RoboForex.com

Attention!
Forecasts presented in this section only reflect the author’s private opinion and should not be considered as guidance for trading. RoboForex LP bears no responsibility for trading results based on trading recommendations described in these analytical reviews.

Investor risk sentiment rises on better economic data

By Orbex

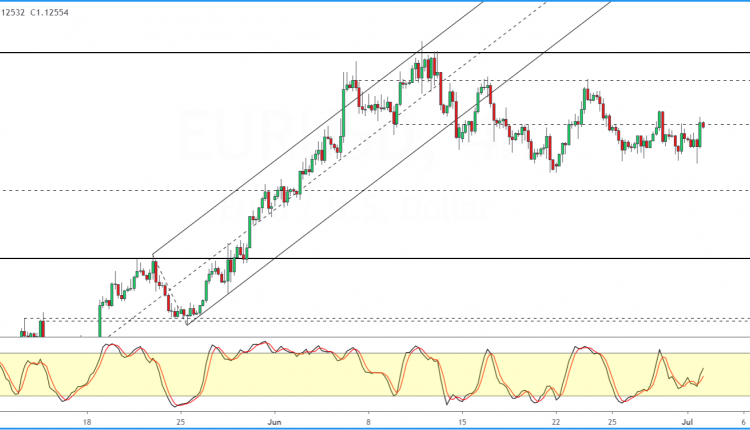
EURUSD Trades Flat As It Fails To Clear 1.1261

The euro currency is holding on to a sideways pattern. Price action once again attempted to breakout above 1.1261 level of resistance.

But failing to breakout higher is keeping the currency pair subdued. A smaller range is forming with the lower end at 1.1205.

Following this consolidation, we expect the euro currency to potentially breakout. The bias is mixed for the moment, given the consistent lower highs that are forming.

As a result, this opens the downside in EURUSD towards the 1.1132 level of support.

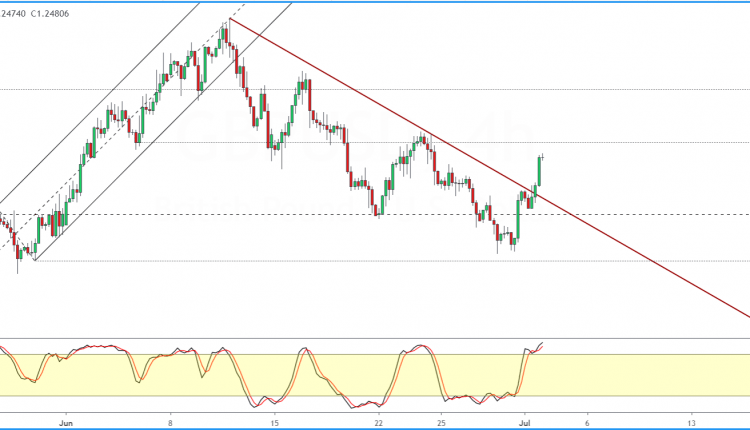
GBPUSD Breaks The Trend Line And Turns Bullish

The pound sterling is posting strong gains for the second consecutive day, with prices rising to a one week high.

The gains come following a successful breakout of the falling trend line. This opens up the upside toward the 1.2516 level where resistance could keep a lid on the gains.

We also suspect a pullback to the breakout level of the trend line. This will potentially cement the upside in GBPUSD for now.

However, further gains might be in store if the cable manages to clear the 1.2516 level of resistance.

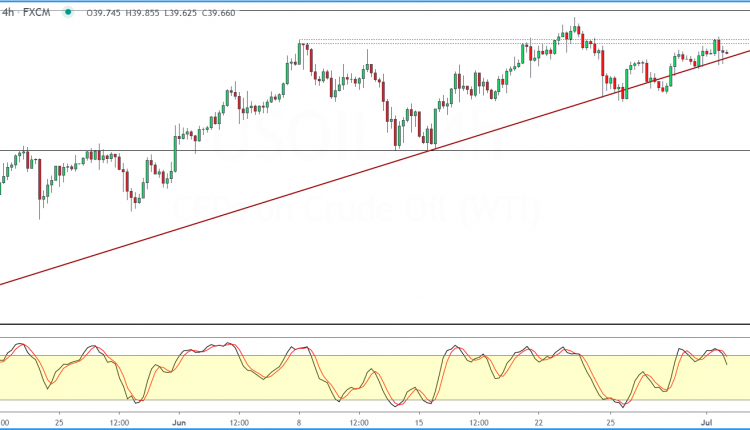
Oil Prices Once Again Retreat From The Resistance Level

WTI Crude oil prices made an attempt to test the technical resistance level around the 40.18 – 40.42 region.

However, prices were pushed lower immediately. For the moment, the consolidation is showing a squeeze in the price between the trend line and the horizontal resistance level.

Therefore, we could expect a breakout in the near term. The bias is mixed for the moment.

If oil prices break the trend line, we expect a move lower to the 34.41 level of support.

Alternately, an upside breakout might see prices finally clearing the way for a move toward the 50.00 level.

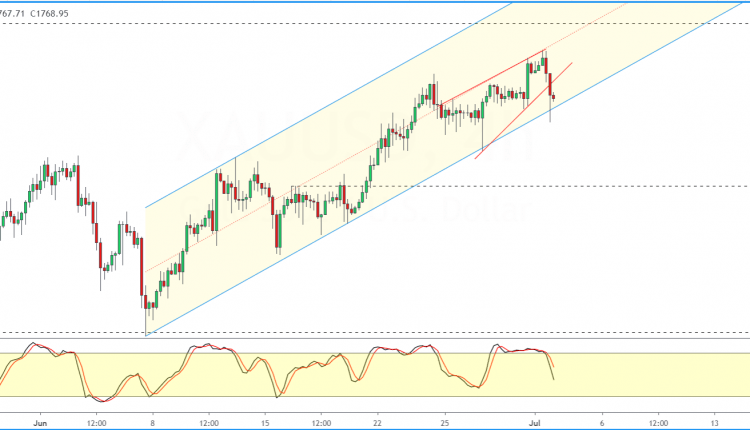
Gold Slips Off The Rising Wedge Pattern

The precious metal failed to make any major gains after prices rose to highs near 1788.

The rising wedge pattern signaled earlier results in prices making a short term correction.

However, gold is still trading within the larger bullish price channel. As a result, the upside bias is still intact.

But this could change if gold breaks out from the rising price channel. It will potentially set the stage for gold to correct lower to the 1732 level.

By Orbex


Ichimoku Cloud Analysis 02.07.2020 (GBPUSD, LTCUSD, USDCAD)

Article By RoboForex.com

GBPUSD, “Great Britain Pound vs US Dollar”

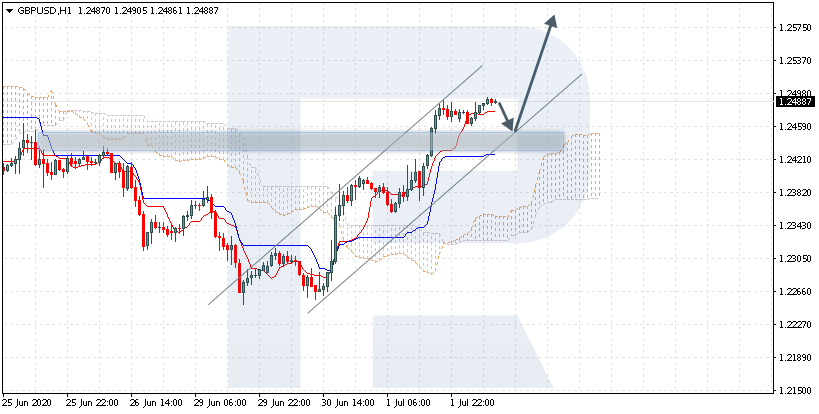
GBPUSD is trading at 1.2488; the instrument is moving above Ichimoku Cloud, thus indicating an ascending tendency. The markets could indicate that the price may test Tenkan-Sen and Kijun-Sen at 1.2455 and then resume moving upwards to reach 1.2575. Another signal in favor of further uptrend will be a rebound from the rising channel’s downside border. However, the bullish scenario may no longer be valid if the price breaks the cloud’s downside border and fixes below 1.2305. In this case, the pair may continue falling towards 1.2215.

GBPUSD
Risk Warning: the result of previous trading operations do not guarantee the same results in the future

LTCUSD, “Litecoin vs US Dollar”

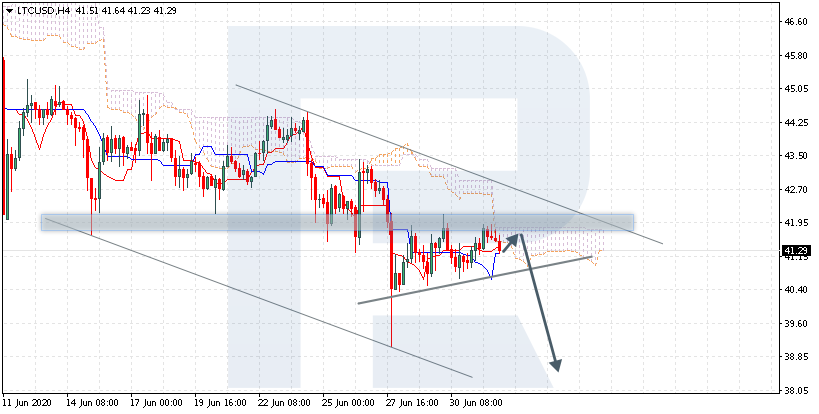
LTCUSD is trading at 41.29; the instrument is moving below Ichimoku Cloud, thus indicating a descending tendency. The markets could indicate that the price may test the cloud’s downside border at 41.55 and then resume moving downwards to reach 38.65. Another signal in favor of further downtrend will be a rebound from the descending channel’s upside border. However, the bearish scenario may no longer be valid if the price breaks the cloud’s upside border and fixes above 42.45. In this case, the pair may continue growing towards 44.05. To confirm further decline, the asset must break the neckline of a Head & Shoulders reversal pattern and fix below 40.35.

LTCUSD
Risk Warning: the result of previous trading operations do not guarantee the same results in the future

USDCAD, “US Dollar vs Canadian Dollar”

USDCAD is trading at 1.3608; the instrument is moving inside Ichimoku Cloud, thus indicating a sideways tendency. The markets could indicate that the price may test the cloud’s upside border at 1.3625 and then resume moving downwards to reach 1.3510. Another signal in favor of further downtrend will be a rebound from the descending channel’s upside border. However, the bearish scenario may no longer be valid if the price breaks the cloud’s upside border and fixes above 1.3645. In this case, the pair may continue growing towards 1.3735. To confirm further decline, the asset must break the downside border of a Wedge pattern and fix below 1.3575.

USDCAD

Article By RoboForex.com

Attention!
Forecasts presented in this section only reflect the author’s private opinion and should not be considered as guidance for trading. RoboForex LP bears no responsibility for trading results based on trading recommendations described in these analytical reviews.

First Crude Inventories Drop In A Month

By Orbex

Huge Inventories Drop

Oil markets managed to retain a positive tone this week as the latest data from the Energy Information Administration offered some support.

The EIA reported that in the week ending June 26th, US crude inventories declined by 7.2 million barrels.

This downward adjustment to inventory levels far exceeded analyst expectations for a 710k barrel drop. It also brings inventory levels down from previous record highs of 540.7 million barrels.

However, despite the move, inventories remain 15% above the five-year seasonal average. This is on the back of the massive drop in demand noted during the worst of the COVID-19 lockdown period.

Imports Reduce

Net US imports were greatly reduced over the week, falling by 506k barrels per day.

Prior to this reading, imports had been one of the key drivers of the rise in inventory levels. This is due to the receipt of shipments booked during the price crash suffered in the Saudi – Russia price war earlier in the year.

Shipments from Saudi Arabia have now fallen back to just 826k barrels per day, their lowest level in six weeks.

Gasoline Demand Low

However, the report was not totally bullish for oil.

Interestingly, gasoline stocks were higher over the week by 1.2 million barrels. This increase came in stark contrast to the 1.6 million barrel drop forecast. This once again reflects a surprising lack of demand given the ongoing reduction in lockdown measures across the US.

Distillate stockpiles, meanwhile, were lower over the week, falling by 593k barrels to 174.1 million barrels.

Elsewhere, the data showed that US refinery crude runs were higher by 193k barrels per day. Refinery utilization rates rose by 0.9%, taking them back up to 75.5% of capacity, the highest they’ve been in months.

Second Wave Fears Threatening Demand

While the headline rise in crude oil inventories is clearly bullish for oil traders, the disappointment at still-weak gasoline demand has offset the positive impact from this report. This created midweek volatility in oil prices.

Alongside this, rising fears of a second outbreak of COVID-19 and the risk that lockdown measures might be reintroduced, have created some headwinds to risk sentiment which are blocking oil’s path to the topside.

With the US seeing a spike in infection numbers, there is a high level of uncertainty in the markets. This could threaten oil’s chances of extending the current recovery in the near term.

Oil Still Capped by 61.8 Retracement

Oil prices have remained below last week’s highs over the course of this week’s trading with price still held up by the 61.8% retracement from the 2020 highs.

RSI divergence is flagging the risks of a reversal unless bulls can quickly see price above the 42.43 level.

If we do see a downside move from here, 33.17 is the first level to watch with the 25.65 level the deeper support zone to note.

By Orbex

The Analytical Overview of the Main Currency Pairs on 2020.07.02

by JustForex

The EUR/USD currency pair

Technical indicators of the currency pair:
  • Prev Open: 1.12337
  • Open: 1.12505
  • % chg. over the last day: +0.17
  • Day’s range: 1.12472 – 1.12981
  • 52 wk range: 1.0777 – 1.1494

The greenback is losing ground against major competitors before the US labor market report for June. These statistics may have a significant impact on the dynamics of currency majors. We recommend paying attention to the difference between the actual and forecasted values of the indicators. Investors are still concerned about the rapid increase in the number of infected with COVID-19, which may cause even greater damage to the global economy. The total number of infected has reached a mark of 10.5 million. Currently, the local levels of support and resistance on the EUR/USD currency pair are 1.1265 and 1.1300, respectively. Positions should be opened from key levels.

The Economic News Feed for 2020.07.02:
  • At 15:30 (GMT+3:00), a report on the US labor market will be published.
EUR/USD

Indicators signal the power of buyers: the price has fixed above 100 MA.

The MACD histogram is in the positive zone, indicating the bullish sentiment.

Stochastic Oscillator is in the overbought zone, the %K line has crossed the %D line. There are no signals at the moment.

Trading recommendations
  • Support levels: 1.1265, 1.1245, 1.1215
  • Resistance levels: 1.1300, 1.1325, 1.1345

If the price fixes above 1.1300, further growth of EUR/USD quotes is expected. The movement is tending to 1.1325-1.1350.

An alternative could be a decrease in the EUR/USD currency pair to 1.1245-1.1220.

The GBP/USD currency pair

Technical indicators of the currency pair:
  • Prev Open: 1.23965
  • Open: 1.24652
  • % chg. over the last day: +0.59
  • Day’s range: 1.24607 – 1.25237
  • 52 wk range: 1.1466 – 1.3516

There are aggressive purchases on the GBP/USD currency pair. Since the beginning of this week, the British pound has added almost 200 points. The trading instrument has reached key extremes. The British pound is currently consolidating in the range of 1.2490-1.2540. Further growth of GBP/USD quotes is possible. Today, US labor statistics are in the spotlight. Positions should be opened from key levels.

GBP/USD

Indicators signal the power of buyers: the price has fixed above 100 MA.

The MACD histogram is in the positive zone, which gives a signal to buy GBP/USD.

Stochastic Oscillator is near the overbought zone, the %K line has crossed the %D line. There are no signals at the moment.

Trading recommendations
  • Support levels: 1.2490, 1.2460, 1.2430
  • Resistance levels: 1.2540, 1.2600

If the price fixes above 1.2540, further growth of GBP/USD quotes is expected. The movement is tending to 1.2580-1.2620.

An alternative could be a decrease in the GBP/USD currency pair to 1.2460-1.2430.

The USD/CAD currency pair

Technical indicators of the currency pair:
  • Prev Open: 1.35753
  • Open: 1.35825
  • % chg. over the last day: +0.08
  • Day’s range: 1.35755 – 1.36112
  • 52 wk range: 1.2949 – 1.4668

There is an ambiguous technical pattern on the USD/CAD currency pair. The loonie is consolidating. Financial market participants expect data on the US labor market. At the moment, the local support and resistance levels are 1.3575 and 1.3615, respectively. We also recommend paying attention to the dynamics of “black gold” prices. Positions should be opened from key levels.

The news feed on Canada’s economy is calm enough.

USD/CAD

Indicators do not give accurate signals: 50 MA has crossed 100 MA.

The MACD histogram is near the 0 mark.

Stochastic Oscillator is in the neutral zone, the %K line is below the %D line, which indicates the bearish sentiment.

Trading recommendations
  • Support levels: 1.3575, 1.3550, 1.3525
  • Resistance levels: 1.3615, 1.3650, 1.3670

If the price fixes below 1.3575, USD/CAD quotes are expected to fall. The movement is tending to 1.3530-1.3500.

An alternative could be the growth of the USD/CAD currency pair to 1.3640-1.3670.

The USD/JPY currency pair

Technical indicators of the currency pair:
  • Prev Open: 107.920
  • Open: 107.420
  • % chg. over the last day: -0.43
  • Day’s range: 107.333 – 107.556
  • 52 wk range: 101.19 – 112.41

The USD/JPY currency pair has become stable. The trading instrument is currently consolidating. USD/JPY quotes are testing local support and resistance levels: 107.30 and 107.60, respectively. The technical pattern signals a possible correction after a prolonged rally. We recommend paying attention to the news feed on the US economy. Positions should be opened from key levels.

The publication of important economic reports from Japan is not planned.

USD/JPY

Indicators do not give accurate signals: the price has fixed between 50 MA and 100 MA.

The MACD histogram is in the negative zone, which indicates the development of bearish sentiment.

Stochastic Oscillator is in the neutral zone, the %K line is below the %D line, which gives a signal to sell USD/JPY.

Trading recommendations
  • Support levels: 107.30, 107.05, 106.80
  • Resistance levels: 107.60, 107.85, 108.10

If the price fixes below 107.30, a further drop in USD/JPY quotes is expected. The movement is tending to 107.00-106.70.

An alternative could be the growth of the USD/JPY currency pair to 107.85-108.10.

by JustForex