Trump Turns Up The Heat In 4th Of July Speech

By Orbex

In the president’s 4th of July speech on the White House lawn on Saturday, there was an agitated tone to his delivery.

This is a speech that many presidents use to deliver messages of unity, hope, and praise to American people. However, this year, Trump opted to hammer home his vow to defeat what he is now calling the “radical left”.

In his Independence Day address, Trump stated that his administration would continue to “fight” to “preserve the American way of life”, saying:

“We are now in the process of defeating the radical left, the anarchists, the agitators, the looters, and the people who, in many instances, have absolutely no clue what they are doing.”

Columbus Statue Torn Down by Protestors

Trump’s speech came just hours ahead of racial-equality protestors in Baltimore tearing down a statue of Christopher Columbus. The statue had been erected in 1985 by the mayor at the time, William Donald Schaefer.

Statues of historical figures accused of racism have become targets as part of the protests still sweeping across America. This continues to happen despite Trump’s threats of ten-year jail sentences for anyone caught vandalizing or removing statues.

During his speech, Trump sought to defend the statues which have come under attack, saying:

“We will never allow an angry mob to tear down our statues, erase our history, indoctrinate our children. Their goal is demolition. The patriots who built our country were not villains. They were heroes.”

Trump has been accused by many, including his opponent Joe Biden, of fuelling racial tensions throughout the protests which have gripped the nation for a month now.

Trump’s rhetoric in speeches and Tweets have lacked sensitivity and empathy. And, at times, they have been outwardly hostile and aggressive. This has led to a significant drop in support for the president over recent weeks.

COVID-19 Efforts Praised

Despite the fresh surge in COVID-19 cases in the US, Trump barely mentioned the virus. This comes at a time when there were reports of 52,000 new cases in a day, last week.

In the brief comments he did make regarding the crisis, he praised the “progress” made. Trump said that despite the recent higher numbers of infections “99% of the cases were “totally harmless”  – a stat which many have disputed following his speech.

US Jobs Rebound, But Outlook Deteriorates

Trump’s speech comes just days after the US jobs report for June rose to record levels.

The NFP figure for the month came in at 4.8 million vs the 3.037 million expected. The result marks a further rise from the prior month’s 2.7 million increase, which was revised higher from the 2.5 million.

Despite the encouraging data, however, parts of the US have seen the reintroduction of restrictions over recent weeks.

Now, there are concerns that such restrictions might return if the spread intensifies further, clouding the outlook for recovery.

USDCAD Maintains Bearish Channel

Following the recovery off the 1.3346 level support, USDCAD has since found resistance at the upper line of the bearish channel running from 2020 highs. While the channel top remains intact, focus remains on further downside in the near term and another test of the 1.3346 level support. To the topside, a break of the channel would bring the 1.3847 level resistance back into focus.

By Orbex

Forex Technical Analysis & Forecast 06.07.2020

Article By RoboForex.com

EURUSD, “Euro vs US Dollar”

EURUSD is moving upwards. Possibly, the pair may reach 1.1290 and then start a new correction towards 1.1262. After that, the instrument may form one more ascending structure with the target at 1.1305 and then start another correction to return to 1.1262.

EURUSD
Risk Warning: the result of previous trading operations do not guarantee the same results in the future

GBPUSD, “Great Britain Pound vs US Dollar”

GBPUSD is trading upwards to break 1.2485 and may later continue growing towards 1.2512. Later, the market may correct to return to 1.2485 and then start another growth to reach 1.2533. After that, the instrument may resume falling inside the downtrend with the target at 1.2424.

GBPUSD
Risk Warning: the result of previous trading operations do not guarantee the same results in the future

USDRUB, “US Dollar vs Russian Ruble”

After completing another ascending structure towards 71.66, which may be considered as the third wave to the upside, USDRUB is expected to correct to reach 70.00, at least. After that, the instrument may resume growing with the target at 72.12.

USDRUB
Risk Warning: the result of previous trading operations do not guarantee the same results in the future

USDJPY, “US Dollar vs Japanese Yen”

USDJPY is consolidating around 107.57. Today, the pair may grow to reach 107.81 and then start a new decline to return to 107.57. If later the price breaks this range to the upside the market may form one more ascending structure with the target at 108.01 or even 108.22.

USDJPY
Risk Warning: the result of previous trading operations do not guarantee the same results in the future

USDCHF, “US Dollar vs Swiss Franc”

USDCHF is moving close to the downside border of the range. Possibly, today the pair may form another ascending wave towards 0.9450. After that, the instrument may fall to break 0.9430 and then continue trading downwards with the target at 0.9387.

USDCHF
Risk Warning: the result of previous trading operations do not guarantee the same results in the future

AUDUSD, “Australian Dollar vs US Dollar”

AUDUSD is moving upwards; it has already broken 0.6945 to the upside. Possibly, the pair may test this level from above and then form another ascending structure with the target at 0.6988 or even 0.7000.

AUDUSD
Risk Warning: the result of previous trading operations do not guarantee the same results in the future

BRENT

Brent is trading upwards and may reach 43.80. Later, the market may correct to reach 42.44 and then start another growth towards 45.20 to complete this ascending wave. After that, the instrument may start another correction with the first target at 41.50.

BRENT
Risk Warning: the result of previous trading operations do not guarantee the same results in the future

XAUUSD, “Gold vs US Dollar”

Gold is still consolidating around 1777.00. Today, the pair may test 1768.15 from above and then resume trading upwards with the short-term target at 1786.00 or even 1798.00.

GOLD
Risk Warning: the result of previous trading operations do not guarantee the same results in the future

BTCUSD, “Bitcoin vs US Dollar”

After finishing the descending impulse at 8900.00, BTCUSD is still consolidating and growing towards 9100.00. If later the price breaks this range to the upside, the market may form one more ascending structure with the target at 9550.00; if to the downside at 0.9490 – resume trading inside the downtrend to reach 8700.00.

BITCOIN
Risk Warning: the result of previous trading operations do not guarantee the same results in the future

S&P 500

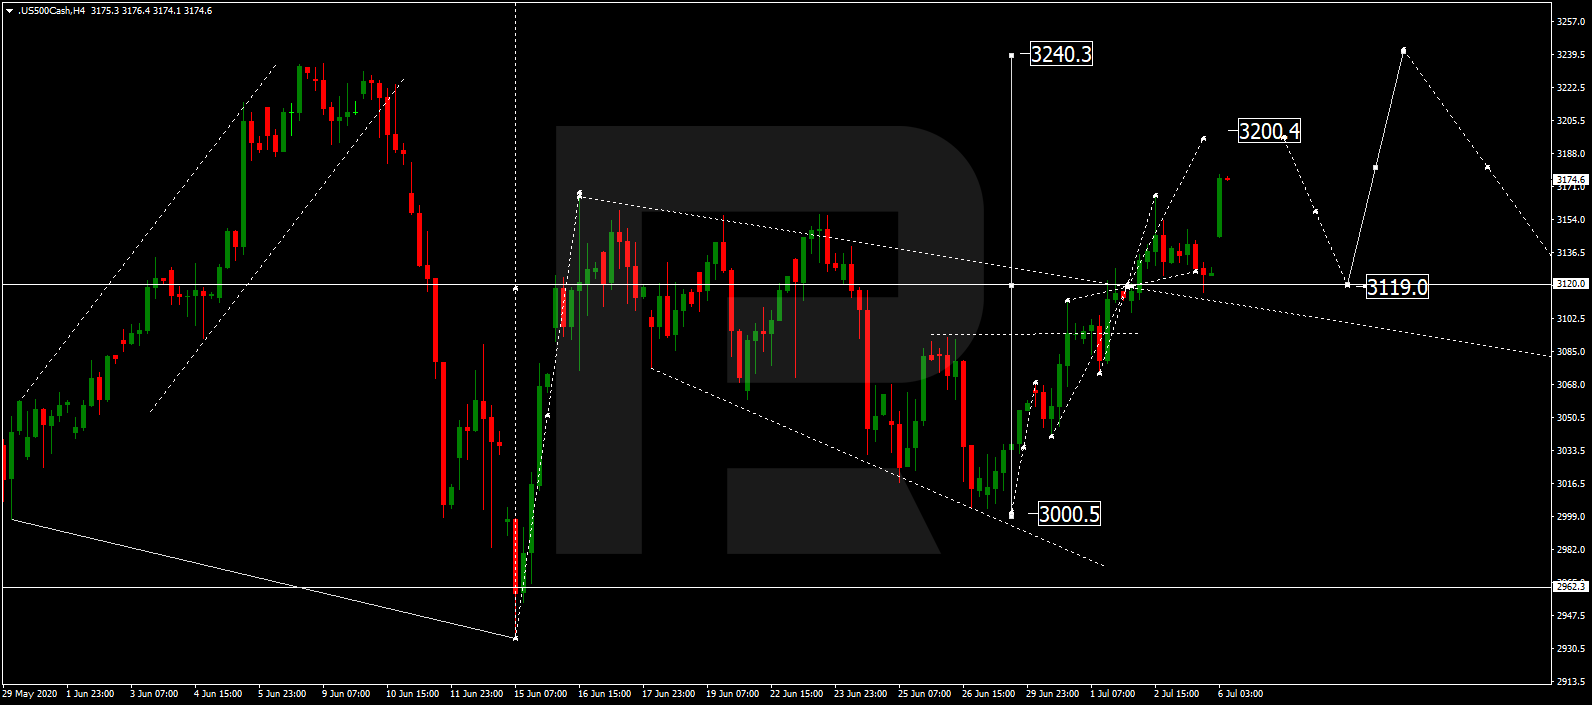
The Index is moving upwards. Possibly, the asset may reach 3200.4 and then correct towards 3119.0. After that, the instrument may resume trading upwards with the short-term target at 3240.3.

S&P 500

Article By RoboForex.com

Attention!
Forecasts presented in this section only reflect the author’s private opinion and should not be considered as guidance for trading. RoboForex LP bears no responsibility for trading results based on trading recommendations described in these analytical reviews.

Currency Majors Are Consolidating. Investors Expect US Economic Releases

by JustForex

Greenback shows multidirectional dynamics relative to a basket of world currencies. The dollar index (#DX) is consolidating in the range of 96.85-97.30. Financial market participants are increasingly concerned about new outbreaks of coronavirus cases. The number of infected around the world has reached 11.5 million.

The head of the European Council, Charles Michel, said that it would take several years for the EU to return to the pre-crisis level after the COVID-19 epidemic. Today, investors will be focused on the ISM Non-Manufacturing Purchasing Managers Index for the US from June. It is expected that the indicator will accelerate from 45.4 to 50.1.

Purchases prevail in the black gold market. Currently, the WTI crude oil futures are testing the $40.85 per barrel mark.

Market indicators

On Friday, US stock markets were closed due to the holiday.

The 10-year US government bonds yield has shifted to growth. At the moment, the indicator is at the level of 0.68-0.69%.

The news feed on 2020.07.06:
  • – The index of business activity in the UK construction sector at 11:30 (GMT+3:00);
  • – ISM Non-Manufacturing PMI of the USA at 17:00 (GMT+3:00).

by JustForex

The Analytical Overview of the Main Currency Pairs on 2020.07.06

by JustForex

The EUR/USD currency pair

Technical indicators of the currency pair:
  • Prev Open: 1.12347
  • Open: 1.12432
  • % chg. over the last day: +0.08
  • Day’s range: 1.12386 – 1.13027
  • 52 wk range: 1.0777 – 1.1494

The EUR/USD quotes have been growing. The trading instrument has reached local highs. At the moment, the euro is testing the round level of 1.1300. The 1.1270 mark is immediate support. The technical pattern signals the further growth of the trading instrument. Investors are worried about new outbreaks of coronavirus in the United States. Today, the focus is on economic releases from the United States. We recommend opening positions from key support and resistance levels.

News feed for 2020.07.06:
  • At 17:00 (GMT+3:00), the ISM US Purchasing Managers Index will be published.
EUR/USD

Indicators signal the power of buyers: the price has fixed above 50 MA and 100 MA.

The MACD histogram is in the positive zone, indicating bullish sentiment.

Stochastic Oscillator has started to go out of the overbought zone, the %K line is below the %D line, which gives a signal to sell EUR/USD.

Trading recommendations
  • Support levels: 1.1270, 1.1245, 1.1220
  • Resistance levels: 1.1300, 1.1325

If the price fixes above 1.1300, further growth of EUR/USD quotes is expected. The movement is tending to 1.1325-1.1350.

An alternative could be a decrease in the EUR/USD currency pair to 1.1245-1.1220.

The GBP/USD currency pair

Technical indicators of the currency pair:
  • Prev Open: 1.24640
  • Open: 1.24618
  • % chg. over the last day: -0.02
  • Day’s range: 1.24547 – 1.25097
  • 52 wk range: 1.1466 – 1.3516

The GBP/USD currency pair is in a flat. Unidirectional trends are not observed. Participants in financial markets expect additional drivers. At the moment, the local support and resistance levels are 1.2460 and 1.2510, respectively. The pound sterling is tending to recover. We are expecting statistics from the USA. Positions must be opened from key levels.

In June, the index of business activity in the UK construction sector was 55.3, which is significantly higher than market expectations of 47.0.

GBP/USD

Indicators do not send accurate signals: the price is consolidating near 50 MA.

The MACD histogram is in the positive zone, indicating bullish sentiment.

Stochastic Oscillator is in the neutral zone, the %K line is below the %D line, which gives a signal to sell GBP/USD.

Trading recommendations
  • Support levels: 1.2460, 1.2435, 1.2400
  • Resistance levels: 1.2510, 1.2540

If the price fixes above 1.2510, GBP/USD is expected to rise. The movement is tending to 1.2540-1.2570.

An alternative could be a decrease of the GBP/USD currency pair to 1.2430-1.2400.

The USD/CAD currency pair

Technical indicators of the currency pair:
  • Prev Open: 1.35671
  • Open: 1.35601
  • % chg. over the last day: -0.13
  • Day’s range: 1.35196 – 1.35626
  • 52 wk range: 1.2949 – 1.4668

The USD/CAD has moved down. The trading instrument has updated local lows. Loonie is currently consolidating in the range of 1.3520-1.3555. Positive dynamics in the black gold market supports the Canadian dollar. The USD/CAD currency pair is tending to further decline. We recommend paying attention to the news feed on the US economy. Positions must be opened from key levels.

The publication of important economic reports from Canada is not planned.

USD/CAD

Indicators point to the power of sellers: the price has fixed below 50 MA and 100 MA.

The MACD histogram is in the negative zone, indicating bearish sentiment.

Stochastic Oscillator is in the neutral zone, the %K line is above the %D line, which gives a signal to buy USD/CAD.

Trading recommendations
  • Support levels: 1.3520, 1.3490
  • Resistance levels: 1.3555, 1.3580, 1.3610

If the price fixes below 1.3520, a further drop in the USD/CAD quotes is expected. The movement is tending to 1.3490-1.3470.

An alternative could be the growth of the USD/CAD currency pair to 1.3580-1.3610.

The USD/JPY currency pair

Technical indicators of the currency pair:
  • Prev Open: 107.482
  • Open: 107.460
  • % chg. over the last day: -0.01
  • Day’s range: 107.439 – 107.773
  • 52 wk range: 101.19 – 112.41

The USD/JPY currency pair is still in a prolonged flat. Unidirectional trends are not observed. Investors expect additional drivers. The key support and resistance levels are 107.35 and 107.75, respectively. Today, the focus is on statistics on the US economy. We also recommend paying attention to the dynamics of yield on US government bonds. Positions must be opened from key levels.

The publication of important economic reports from Japan is not planned.

USD/JPY

Indicators do not send accurate signals: the price has crossed 50 MA.

The MACD histogram is near the 0 mark.

Stochastic Oscillator is located near the oversold zone, the %K line has crossed the %D line. There are no signals at the moment.

Trading recommendations
  • Support levels: 107.35, 107.05, 106.80
  • Resistance levels: 107.75, 108.10

If the price fixes below 107.35, USD/JPY is expected to fall. The movement is tending to 107.00-106.70.

An alternative could be the growth of the USD/JPY currency pair to 108.00-108.30.

by JustForex

Gold Got Inside Flat

By Dmitriy Gurkovskiy, Chief Analyst at RoboForex

Gold is looking quite stable during the second week of July – the asset is trading at $1785.40 USD after updating its last week’s highs at $1807.70.

Here and now, market players are finally paying enough attention to the macroeconomic: expectations from China are quite positive as the country’s economy is anticipated to recover faster and stronger than other countries. This, in its turn, slows down investors’ interest in “safe haven” assets, including Gold.

However, it’s clearly seen that strategically investors are in no hurry to ditch their long-term positions in Gold, and it’s understandably why. The COVID-19 hasn’t been defeated yet, and that’s a risk. Global economies are still experiencing the crisis, and that’s a risk too. The American Dollar may remain under pressure for a long time, and that’s good for Gold.

All this taken together creates strategic support for the price of Gold, that’s why there are no rapid decisions to sell the instrument.

As we can see in the H4 chart, XAU/USD is trading to break 1778.86 to the upside and may later continue growing towards 1800.00. Later, the market may start a new correction to return to 1778.00 and then form one more ascending structure with the target at 1818.20. From the technical point of view, this scenario is confirmed by MACD Oscillator: its signal line is moving above 0, thus indicating further uptrend on the price chart.

In the H1 chart, XAU/USD is growing towards 1778.80. After reaching this level, the pair may form a new consolidation range and then break it to the upside. In this case, the pair may continue growing with the short-term target of another ascending wave at 1786.50. From the technical point of view, this scenario is confirmed by Stochastic Oscillator: its signal line is moving directly upwards, thus confirming further uptrend until the line breaks 80. After that, there might be a correction on the price chart, while the line is expected to fall towards 50.

Disclaimer

Any predictions contained herein are based on the author’s particular opinion. This analysis shall not be treated as trading advice. RoboForex shall not be held liable for the results of the trades arising from relying upon trading recommendations and reviews contained herein.

Global equities advance ahead of US markets reopening

By IFCMarkets

Top daily news

Global markets are rising currently after mixed trading last Friday as US markets were closed for the Independence Day holiday. Investors’ risk appetite appears to have recovered after stronger than expected US jobs report for June despite rising coronavirus cases globally.

Forex news

Currency PairChange
EUR USD-0.49%
GBP USD+1.79%
USD JPY+0.08%
The Dollar weakening has accelerated currently. The live dollar index data show the ICE US Dollar index, a measure of the dollar’s strength against a basket of six rival currencies, slipped 0.1% Friday. Both GBP/USD and EUR/USD reversed their sliding Friday as the final reading of euro-zone services PMI showed the contraction eased sharply last month. Both pairs are up currently. USD/JPY halted its climbing on Friday while AUD/USD accelerated rising with both pairs higher currently.

Stock Market news

IndicesChange
Dow Jones Index+0.13%
GB 100 Index+3.12%
US equity markets are sharply higher today ahead of reopening following Independence Day celebrations on Friday. The three main US stock indexes recorded weekly gains ranging from 3.3% to 4.6% in holiday shortened last week. European stock indexes are rebounding currently after ending lower on Friday despite Markit’s report the contraction in euro-zone’s business activity eased sharply according to final services PMI reading. Asian indexes are mostly rising today led by Shanghai Composite.

Commodity Market news

CommoditiesChange
Brent Crude Oil+1.18%
WTI Crude+1.49%
Brent is recovering today. Oil prices ended lower last session despite Baker Hughes report the number of operating US oil and natural gas rigs fell to an all-time low for a ninth week. The US oil benchmark West Texas Intermediate (WTI) futures are lower currently. August Brent crude slid 0.8% to $42.80 a barrel on Friday.

Gold Market News

MetalsChange
Gold+0.03%
Gold prices are gaining today. Spot gold slipped 0.01% to $1774.66 an ounce on Friday.

Market Analysis provided by IFCMarkets

Note:
This overview has an informative and tutorial character and is published for free. All the data, included in the overview, are received from public sources, recognized as more or less reliable. Moreover, there is no guarantee that the indicated information is full and precise. Overviews are not updated. The whole information in each overview, including opinion, indicators, charts and anything else, is provided only for familiarization purposes and is not financial advice or а recommendation. The whole text and its any part, as well as the charts cannot be considered as an offer to make a deal with any asset. IFC Markets and its employees under any circumstances are not liable for any action taken by someone else during or after reading the overview.

DAX30 bulls in control of the action again – 13,000 here we come?

By Admiral Markets

Economic events calendar

Source: Economic Events July 6, 2020 – Admiral Markets’ Forex Calendar

After the DAX30 consolidated between 11,950 and 12,370/400 points over the last week of trading and bears failed right on Monday with their attempt to push the German index out of the range on the downside, bulls captured control.

Last Thursday, bulls succeeded in their attempt to break higher, driven and supported by the news that Pfizer and Biontech announced positive results in regards to the search for a Covid-19 vaccine (announced on Wednesday) and solid US labour market data.

Non-Farm Payrolls came in at 4.8 million for June against 3.23 million expected, May data being revised higher from 2.509 million to 2.699 million and the unemployment rate dropping to 11.1% from previously 13.3%.

While the BLS admitted another “survey error” after March, April and May which resulted in an artificially lower unemployment rate, markets seem to completely ignore the obviously manipulated and politically driven environment.

Technically, for the start of the week, further gains in the DAX30 are to be favoured, a first target on the upside can be found around 12,750 points, above and in the days to come a next target can be found around 12,900 points.

A solid support and potential long trigger can be found around 12,370/400 points, last week’s breakout region:

DAX30 CFD hourly chart

Source: Admiral Markets MT5 with MT5-SE Add-on DAX30 CFD Hourly chart (between June 16, 2020, to July 3, 2020). Accessed: July 3, 2020, at 10:00pm GMT

DAX30 CFD daily chart

Source: Admiral Markets MT5 with MT5-SE Add-on DAX30 CFD Daily chart (between March 20, 2019, to July 3, 2020). Accessed: July 3, 2020, at 10:00pm GMT – Please note: Past performance is not a reliable indicator of future results, or future performance.

In 2015, the value of the DAX30 CFD increased by 9.56%, in 2016, it increased by 6.87%, in 2017, it increased by 12.51%, in 2018, it fell by 18.26%, in 2019, it increased by 26.44% meaning that after five years, it was up by 34.2%.

Check out Admiral Markets’ most competitive conditions on the DAX30 CFD and start trading on the DAX30 CFD with a low 0.8 point spread offering during the main Xetra trading hours!

Discover the world’s #1 multi-asset platform

Admiral Markets offers professional traders the ability to trade with a custom, upgraded version of MetaTrader 5, allowing you to experience trading at a significantly higher, more rewarding level. Experience benefits such as the addition of the Market Heat Map, so you can compare various currency pairs to see which ones might be lucrative investments, access real-time trading data, and so much more. Click the banner below to start your FREE download of MT5 Supreme Edition!

Download MetaTrader 5 and begin trading today!

Disclaimer: The given data provides additional information regarding all analysis, estimates, prognosis, forecasts or other similar assessments or information (hereinafter “Analysis”) published on the website of Admiral Markets. Before making any investment decisions please pay close attention to the following:

  1. This is a marketing communication. The analysis is published for informative purposes only and are in no way to be construed as investment advice or recommendation. It has not been prepared in accordance with legal requirements designed to promote the independence of investment research, and that it is not subject to any prohibition on dealing ahead of the dissemination of investment research.
  2. Any investment decision is made by each client alone whereas Admiral Markets shall not be responsible for any loss or damage arising from any such decision, whether or not based on the Analysis.
  3. Each of the Analysis is prepared by an independent analyst (Jens Klatt, Professional Trader and Analyst, hereinafter “Author”) based on the Author’s personal estimations.
  4. To ensure that the interests of the clients would be protected and objectivity of the Analysis would not be damaged Admiral Markets has established relevant internal procedures for prevention and management of conflicts of interest.
  5. Whilst every reasonable effort is taken to ensure that all sources of the Analysis are reliable and that all information is presented, as much as possible, in an understandable, timely, precise and complete manner, Admiral Markets does not guarantee the accuracy or completeness of any information contained within the Analysis. The presented figures refer that refer to any past performance is not a reliable indicator of future results.
  6. The contents of the Analysis should not be construed as an express or implied promise, guarantee or implication by Admiral Markets that the client shall profit from the strategies therein or that losses in connection therewith may or shall be limited.
  7. Any kind of previous or modeled performance of financial instruments indicated within the Publication should not be construed as an express or implied promise, guarantee or implication by Admiral Markets for any future performance. The value of the financial instrument may both increase and decrease and the preservation of the asset value is not guaranteed.
  8. The projections included in the Analysis may be subject to additional fees, taxes or other charges, depending on the subject of the Publication. The price list applicable to the services provided by Admiral Markets is publicly available from the website of Admiral Markets.

Leveraged products (including contracts for difference) are speculative in nature and may result in losses or profit. Before you start trading, you should make sure that you understand all the risks.

By Admiral Markets

Risk assets soar as coronavirus cases reach a new record

By Hussein Sayed, Chief Market Strategist (Gulf & MENA), ForexTime

Investors trying to find a negative correlation between stock market performance and Covid-19 infections are having a difficult time. There doesn’t seem to be one at the moment and that’s evident in today’s robust rally.

Sentiment remains bullish despite the many question marks around economic prospects over the medium and long term. We may have seen a positive rebound in several releases of economic data over the past couple of weeks, especially the surprising 4.8 million addition in US jobs, but the rise in Covid-19 cases has begun to force a number of US states and some other cities across the globe to either stop their openings or reintroduce new lockdowns. That will certainly threaten any shape of expected economic rebound.

Some may argue that despite the rise in infection cases, the death rate continues to decline and so does the hospitalisation of patients. While this may sound optimistic to some, the virus itself has not become less harmful but it is now infecting younger aged people and will lead to a disaster if the spread gets out of control, especially from those who are asymptomatic. Without a vaccine in place the upturn in economic activity will go through many twists and turns along the road to full recovery.

The stock market is behaving as if all these risks are behind us. China’s blue-chip stocks has jumped more than 5% at the time of writing and US futures are indicating a more than 1% gain at the open. Of course, there are factors contributing to the rally. With an unprecedented amount of cash in the system, equities and high yielding bonds are attracting a lot of interest from investors in the absence of acceptable yield from money markets and longer-term government bonds. That may continue to push risk assets higher, although valuations are approaching extreme levels. To keep this rally alive, we need more intervention from fiscal and monetary policymakers and for investors to believe that policies will be generous enough to provide further liquidity.

However, the more asset prices disconnect from their core fundamentals, the more likely we will see a sharp correction occurring in the future. The earnings season needs to provide some clarity after more than two thirds of companies failed to provide guidance in the first quarter. Without this, analysts’ expectations will diverge further leading to poor decision making from investors.  Almost five months into the pandemic, companies should have some projections for revenues and profits.  If investors have been forgiving in Q1, they will become more demanding going forward as they can’t remain blindfolded for much longer.

Disclaimer: The content in this article comprises personal opinions and should not be construed as containing personal and/or other investment advice and/or an offer of and/or solicitation for any transactions in financial instruments and/or a guarantee and/or prediction of future performance. ForexTime (FXTM), its affiliates, agents, directors, officers or employees do not guarantee the accuracy, validity, timeliness or completeness, of any information or data made available and assume no liability as to any loss arising from any investment based on the same.


Forex-Time-LogoArticle by ForexTime

ForexTime Ltd (FXTM) is an award winning international online forex broker regulated by CySEC 185/12 www.forextime.com

Asian stocks push higher, still within sideways trend

By Han Tan, Market Analyst, ForexTime

Asian stocks and US futures are climbing, even as the number of coronavirus cases worldwide nears 11.4 million. Over the weekend, the WHO reported a record one-day high in global infections, with 212,326 cases in a 24-hour period.

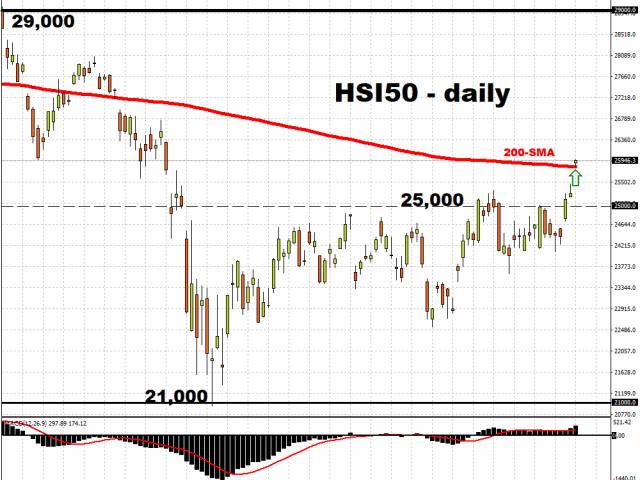
The Hang Seng index has broken above its 200-day moving average, notching a new 4-month high.


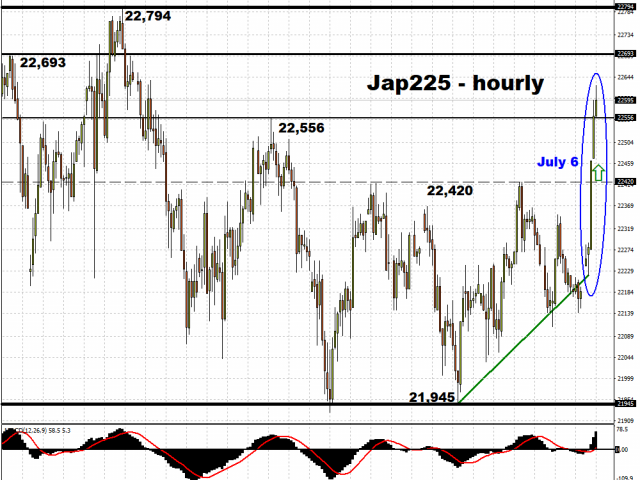
This morning, Japanese stocks roared past the 22,420 resistance level that has been in play since a week ago, confirming an uptrend on the hourly chart. Having posted higher lows so far this month with momentum now swinging into positive territory as well, the Jap225 candles could carve a path towards the 22,800 region, which is the upper bound of its sideway range since mid-June.


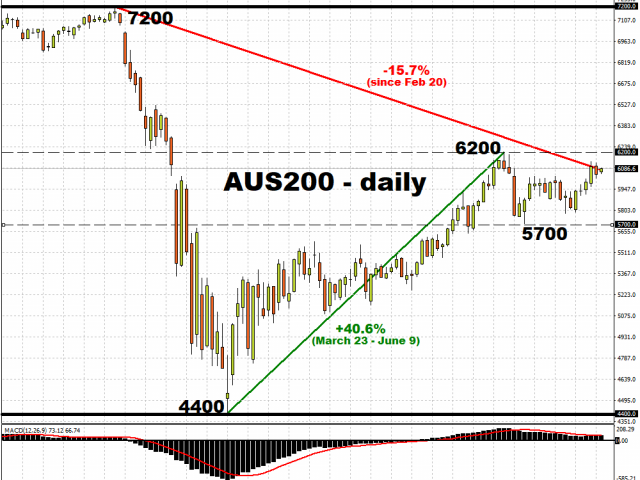
The S&P/ASX 200 is showing more muted gains compared to is regional peers. Australian stocks are still confined to that 6200 – 5700 range observed since the beginning of June, and still hanging on to much of the 40 percent advance since March.


Overall, global risk sentiment is set to mark time as it has been doing over recent weeks, unless jolted by a major catalyst. Investors are still searching for greater clarity, as concerns over a surge of coronavirus cases in major economies are dulling the green shoots of the global recovery.

Over the weekend, Bank of France Governor Francois Villeroy de Galhau said that the French economy is performing “better” than forecasted at the start of June. The June US non-farm payrolls data, released last Thursday, demonstrated the resilience of the jobs market in the world’s largest economy, aided by the government’s support measures.

However, the still-rising number of global cases implies that the threat of more disruptions to economic activity, potentially by way of reimposed lockdowns, remains a factor that warrants plenty of caution. Global investors will be poring over the economic data due to be released over the coming days, including Europe’s industrial production data, to assess whether risk assets are justified in climbing higher. If the market bears gather enough critical mass, they could determine that risk assets are ripe for retracement, and potentially unwind the gains seen in Q2.


Disclaimer: The content in this article comprises personal opinions and should not be construed as containing personal and/or other investment advice and/or an offer of and/or solicitation for any transactions in financial instruments and/or a guarantee and/or prediction of future performance. ForexTime (FXTM), its affiliates, agents, directors, officers or employees do not guarantee the accuracy, validity, timeliness or completeness, of any information or data made available and assume no liability as to any loss arising from any investment based on the same.


Forex-Time-LogoArticle by ForexTime

ForexTime Ltd (FXTM) is an award winning international online forex broker regulated by CySEC 185/12 www.forextime.com

Prepare for the global impact of US COVID-19 resurgence

By Dan Steinbock

– Recently, the US has suffered a series of COVID-19 surges. The escalation won’t stay in America. It is likely to cause collateral damage worldwide.  

In early June, U.S. states began to exit from the lockdown measures, even though the epidemic curve had not been adequately flattened. On July 4th, the White House sought for a “return to normal” with a celebration at Mount Rushmore, where President Trump, who has recently associated himself with far-right “white power” extremists, gave a bizarre speech warning about a “new far-left fascism.”

And once again, the Trump crowds were not required to wear face masks or practice social distancing, although the US has recently tallied its highest single-day totals of coronavirus infections. Currently confirmed virus cases in the US total 3 million, with almost 135,000 deaths, while new confirmed cases average over 50,000 daily.

Despite the Independence Day, traditional July 4th routines – beer, beach and BBQs – were severely adjusted. Florida, still another state that rushed a premature exit, set a national record with more than 10,000 new cases.

Not so long ago, younger people were hosting COVID-19 parties “like there was no tomorrow.” Many may now get what they wished for. When the White House began to mobilize against the pandemic two months ago, more than two of three patients were aged 50 or older. But today, almost 60% of cases are aged 18-49.

The COVID-19 surge across America is no surprise, however. It was only to be expected in light of the catastrophic mishandling of the pandemic by the White House, as I projected in The Tragedy of Missed Opportunities in April (click here). The following draws from that report; only data has been updated.

White House alerted on Jan 3, yet mobilized 2 months later

On January 3, when the virus gene sequencing was completed by China’s CDC and emergency monitoring initiated, Chinese officials notified WHO and relevant countries. That day, U.S. CDC director Dr. Robert R. Redfield called Alex M. Azar II, secretary of health, telling him that China had potentially discovered a new coronavirus. In turn, Azar informed the National Security Council (NSC), for a reason.

When Trump arrived in the White House three years before, his administration killed the global health unit that had been part of the NSC and that had been created to respond to potential global pandemics. Now a newly-created team began daily meetings in the basement of the West Wing. Yet, no mobilization occurred in the US. Instead, a long debate began within the Trump administration over “what to tell to the American public.”

Between the first recorded case in Wuhan (Dec 30, 2019), and the WHO’s announcement of the international emergency (Jan 30, 2020), the epicenter of the outbreak was in China. Yet, first cases were also recorded in 20 countries worldwide, including the US. But once again, the Trump White House chose not to mobilize.

On March 10, the WHO declared the virus a pandemic. By then, the epicenter had moved from Europe to the US. It was only on March 13 that the White House began to mobilize federal resources against the COVID-19 outbreak. By then, there were 1,264 confirmed cases in the U.S. and 277 deaths. The figures grossly under-estimated the spread of the virus since basic testing capacity and diagnoses were lagging into April.

Trump’s crisis mishandling had deferred the inevitable awakening but when it finally ensued, it would prove devastating, as I projected in April. Subdued by the trade wars and after growth of 2.3% in the 4th quarter, the U.S. GDP growth suffered a -5% contraction in the 1st quarter and is likely to cope with a historical -53% plunge in the 2nd quarter.

Playing the blame game  

As the Trump administration began national mobilization weeks belatedly, it struggled to reduce the economic damage by reopening the economy after mid-April. Trump gave governors a road map for recovering from the economic pain of the coronavirus pandemic. “You’re going to call your own shots,” Trump told the governors. “We’re going to be standing alongside of you.”

Here’s the Machiavellian translation: It’s my mistake, but your headache. It’s election year, you know.

Following the Trump administration’s loss of credibility, many states developed their own exit stances, including “Trump-proof” plans in the Tri-State area. Belated mobilization was devastating not just nursing homes, but prison systems and other dense closed facilities. As perceptive observers noted, this was the next information battle field in America: “Who gets counted in the coronavirus death toll .”

As I argued in The Tragedy of Missed Opportunities, the US mobilization against the pandemic failed, due to a series of factors, including

  • Complacency, belated mobilization, inadequate preparedness, poorly-enforced lockdowns, and failed crisis leadership by the Trump White House;
  • Ineffective monitoring of quarantines and self-quarantines;
  • faulty test kits and long delays in testing, plus deficient contact tracing;
  • huge shortages of personal protective equipment (PPE) that endangered the lives of frontline healthcare professionals;
  • trade war that caused additional, unwarranted PPE shortages;
  • failed responses to the outbreak, which have dramatically added to health risks;
  • misguided media coverage that has contributed to ‘infodemics’;
  • a “paranoid style of politics” to shift the blame on China and the WHO and its executives (and the disastrous decision to exit the US from the WHO)
  • premature exits from lockdowns;
  • and the list goes on.

These mistakes have been followed by Trump’s decision to exit the US from the WHO, which will compound public-health risks in the future, both in the US and worldwide.

But the long-term international implications may prove even worse.

US virus exports into Mexico – and beyond  

What happens in America will not stay in America. Due to months of fattening rather than flattening the curve and the associated resurgence of COVID-19 in the US, international exits from lockdowns and global economic recovery are virtually ensured to take a series of new hits when the US eventually returns back to business.

The recent travel ban by the EU against the United States is just a tip of the iceberg. Mexican border states have raised serious concerns about Americans’ pandemic inflows into the south.

Washington implemented strict inflow protocols against Mexicans in March. Yet, as the virus had its first peak in early spring and is now enjoying its second wave in the US, hundreds of thousands of Americans continue to cross the border into Mexico.

What happens in the US-Mexican border today is just a prelude to what will ensue internationally as US containment failures – followed by secondary virus waves – are likely to be exported around the world.

About the Author:

Dr. Dan Steinbock is an internationally recognized strategist of the multipolar world and the founder of Difference Group. He has served at the India, China and America Institute (USA), Shanghai Institutes for International Studies (China) and the EU Center (Singapore). For more, see https://www.differencegroup.net