Ichimoku Cloud Analysis 09.07.2020 (XAUUSD, EURUSD, AUDNZD)

Article By RoboForex.com

XAUUSD, “Gold vs US Dollar”

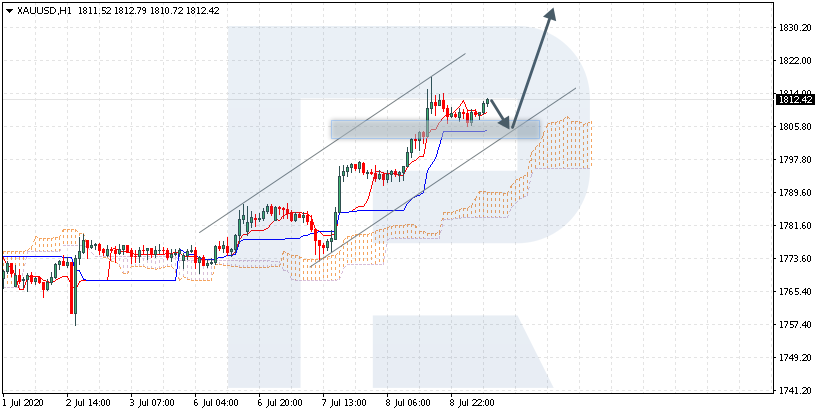
XAUUSD is trading at 1812.00; the instrument is moving above Ichimoku Cloud, thus indicating an ascending tendency. The markets could indicate that the price may test Tenkan-Sen and Kijun-Sen at 1805.00 and then resume moving upwards to reach 1845.00. Another signal in favor of further uptrend will be a rebound from the rising channel’s downside border. However, the bullish scenario may no longer be valid if the price breaks the cloud’s downside border and fixes below 1775.00. In this case, the pair may continue falling towards 1745.00.
XAUUSD
Risk Warning: the result of previous trading operations do not guarantee the same results in the future

EURUSD, “Euro vs US Dollar”

EURUSD is trading at 1.1358; the instrument is moving above Ichimoku Cloud, thus indicating an ascending tendency. The markets could indicate that the price may test Tenkan-Sen and Kijun-Sen at 1.1325 and then resume moving upwards to reach 1.1445. Another signal in favor of further uptrend will be a rebound from the rising channel’s downside border. However, the bullish scenario may be canceled if the price breaks the cloud’s downside border and fixes below 1.1265. In this case, the pair may continue falling towards 1.1195.

EURUSD
Risk Warning: the result of previous trading operations do not guarantee the same results in the future

AUDNZD, “Australian Dollar vs New Zealand Dollar”

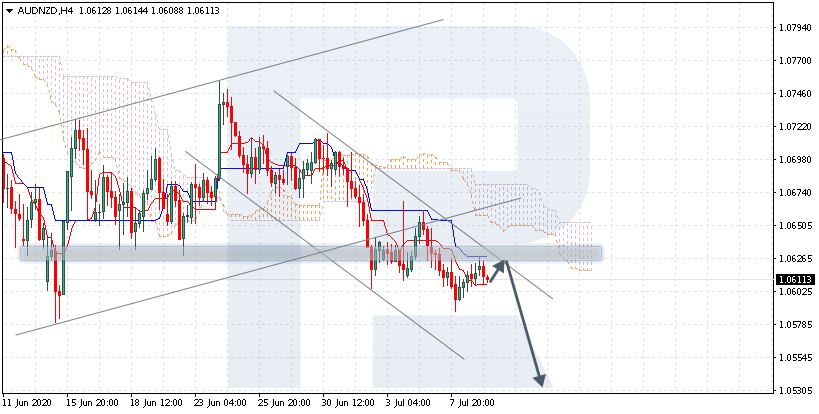
AUDNZD is trading at 1.0611; the instrument is moving below Ichimoku Cloud, thus indicating a descending tendency. The markets could indicate that the price may test Tenkan-Sen and Kijun-Sen at 1.0620 and then resume moving downwards to reach 1.0530. Another signal in favor of further downtrend will be a rebound from the descending channel’s upside border. However, the bearish scenario may no longer be valid if the price breaks the cloud’s upside border and fixes above 1.0695. In this case, the pair may continue growing towards 1.0755.
AUDNZD

Article By RoboForex.com

Attention!
Forecasts presented in this section only reflect the author’s private opinion and should not be considered as guidance for trading. RoboForex LP bears no responsibility for trading results based on trading recommendations described in these analytical reviews.

Japanese Candlesticks Analysis 09.07.2020 (EURUSD, USDJPY, EURGBP)

Article By RoboForex.com

EURUSD, “Euro vs. US Dollar”

As we can see in the H4 chart, the pair has started forming a new ascending channel. Right now, EURUSD is reversing after forming a Hammer pattern. Considering the current bullish dynamics, the price may finish the correction and then resume trading upwards to reach the resistance level at 1.1420. At the same time, an alternative scenario implies that the instrument may continue falling to return to 1.1330.

EURUSD
Risk Warning: the result of previous trading operations do not guarantee the same results in the future

USDJPY, “US Dollar vs. Japanese Yen”

As we can see in the H4 chart, after forming an Engulfing pattern not far from the resistance area, USDJPY has started reversing. At the moment, the pair is moving downwards. The current situation implies that after a slight correction the market may resume the descending tendency towards the support level at 106.67. Still, there is an opposite scenario, which says that the instrument may grow and return to 108.08.

USDJPY
Risk Warning: the result of previous trading operations do not guarantee the same results in the future

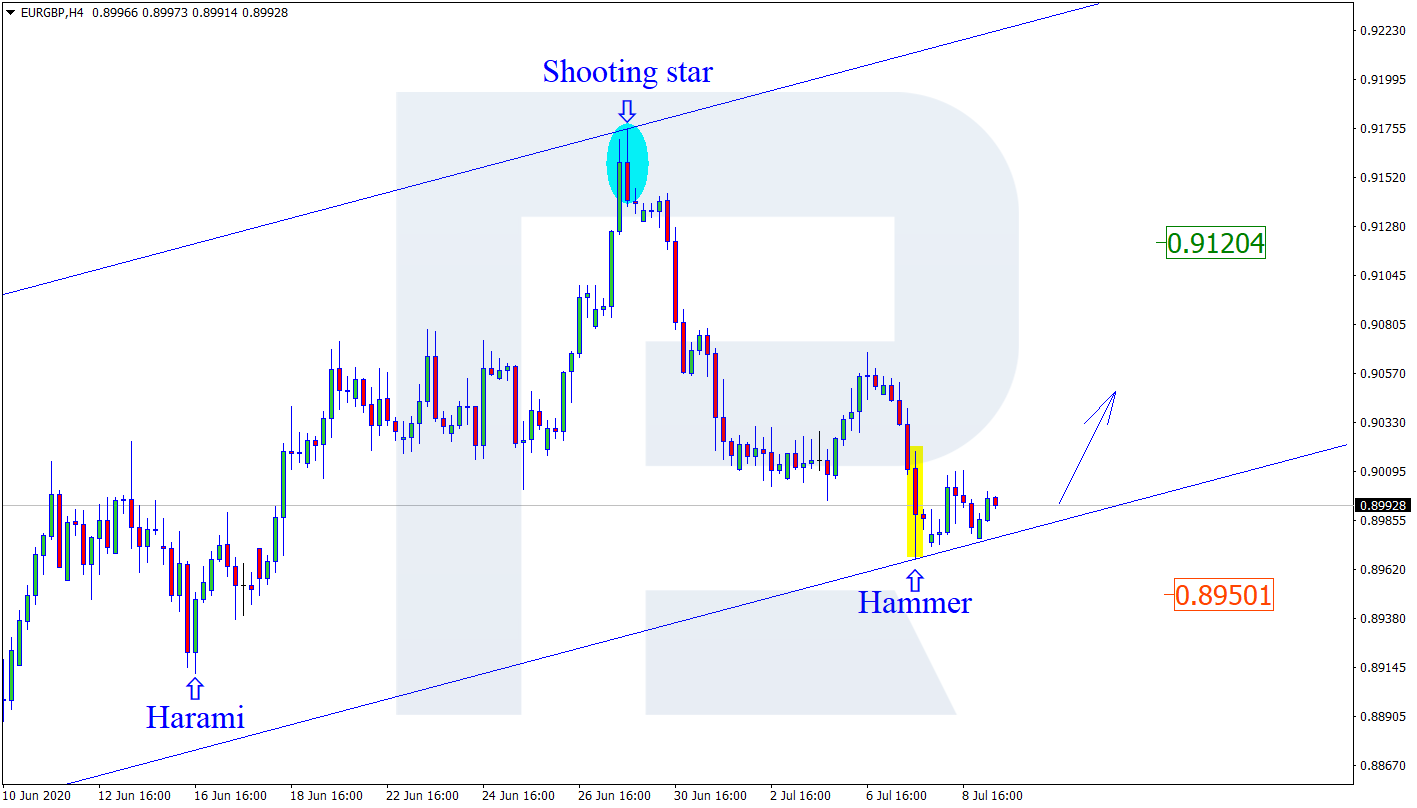
EURGBP, “Euro vs. Great Britain Pound”

As we can see in the H4 chart, after testing the rising channel’s downside border and forming a group of reversal candlestick patterns, including Hammer, EURGBP has started reversing. The upside target remains at 0.9120. In the future, the instrument may continue trading upwards to update the highs. However, there might be another scenario, according to which the asset may correct towards the support level at 0.8950.

EURGBP

Article By RoboForex.com

Attention!
Forecasts presented in this section only reflect the author’s private opinion and should not be considered as guidance for trading. RoboForex LP bears no responsibility for trading results based on trading recommendations described in these analytical reviews.
The Analytical Overview of the Main Currency Pairs on 2020.07.09

by JustForex

The EUR/USD currency pair

Technical indicators of the currency pair:
  • Prev Open: 1.12695
  • Open: 1.13270
  • % chg. over the last day: +0.51
  • Day’s range: 1.13270 – 1.13707
  • 52 wk range: 1.0777 – 1.1494

The EUR/USD quotes have moved to growth. During yesterday’s and today’s trading sessions, the single currency has added more than 90 points in price relative to the greenback. At the moment, the trading instrument is consolidating in the range 1.1330-1.1370. The United States recorded a new world record of COVID-19 infections. Investors are concerned about the introduction of new restrictive measures. Today, the focus is on data on jobless claims in the United States. Positions need to be opened from key support and resistance levels.

The news feed on 2020.07.09:
  • – The number of jobless claims in the United States at 15:30 (GMT+3:00).
EUR/USD

Indicators point to the power of buyers: the price has fixed above 50 MA and 100 MA.

The MACD histogram is in the positive zone, indicating the bullish sentiment.

Stochastic Oscillator is in the neutral zone, the %K line is below the %D line, which gives a signal to sell EUR/USD.

Trading recommendations
  • Support levels: 1.1330, 1.1300, 1.1285
  • Resistance levels: 1.1370, 1.1400

If the price fixes above 1.1370, EUR/USD is expected to rise. The movement is tending to 1.1400-1.1430.

An alternative could be a decrease in the EUR/USD currency pair to 1.1300-1.1280.

The GBP/USD currency pair

Technical indicators of the currency pair:
  • Prev Open: 1.25338
  • Open: 1.25959
  • % chg. over the last day: +0.55
  • Day’s range: 1.25947 – 1.26525
  • 52 wk range: 1.1466 – 1.3516

The GBP/USD currency pair continues to show a steady uptrend. Sterling has set new local highs. GBP/USD quotes have found resistance at 1.2650. The mark of 1.2585 is already a “mirror” support. The UK government has introduced a new plan to support the economy in times of crisis, which provides incentive measures totalling about 30 billion pounds. The trading instrument is tending to grow. Positions must be opened from key levels.

The news feed on the UK economy is calm.

GBP/USD

Indicators point to the power of buyers: the price has fixed above 50 MA and 100 MA.

The MACD histogram is in the positive zone, which gives a signal to buy GBP/USD.

Stochastic Oscillator is in the neutral zone, the %K line is below the %D line, which indicates a bearish sentiment.

Trading recommendations
  • Support levels: 1.2585, 1.2520, 1.2470
  • Resistance levels: 1.2650, 1.2700

If the price fixes above 1.2650, further growth of GBP/USD quotes is expected. The movement is tending to the round level of 1.2700.

An alternative could be a decrease in the GBP/USD currency pair to 1.2540-1.2500.

The USD/CAD currency pair

Technical indicators of the currency pair:
  • Prev Open: 1.35985
  • Open: 1.35107
  • % chg. over the last day: -0.68
  • Day’s range: 1.34941 – 1.35251
  • 52 wk range: 1.2949 – 1.4668

The bearish sentiment is prevailing in the USD/CAD currency pair. The trading instrument has overcome and fixed below the key extremes. Loonie is currently consolidating in the range of 1.3490-1.3525. USD/CAD quotes are tending to decline. We recommend you to pay attention to the dynamics of prices of “black gold”. Positions must be opened from key levels.

At 15:30 (GMT+3:00) statistics on the real estate market in Canada will be published.

USD/CAD

Indicators point to the power of sellers: the price has fixed below 50 MA and 100 MA.

The MACD histogram is in the negative zone, which gives a signal to sell USD/CAD.

Stochastic Oscillator is located near the oversold zone, the %K line has crossed the %D line. There are no signals at the moment.

Trading recommendations
  • Support levels: 1.3490, 1.3450
  • Resistance levels: 1.3525, 1.3555, 1.3580

If the price fixes below 1.3490, a further drop in the USD/CAD quotes is expected. The movement is tending to 1.3460-1.3430.

An alternative could be the growth of the USD/CAD currency pair to 1.3550-1.3570.

The USD/JPY currency pair

Technical indicators of the currency pair:
  • Prev Open: 107.544
  • Open: 107.262
  • % chg. over the last day: -0.24
  • Day’s range: 107.181 – 107.364
  • 52 wk range: 101.19 – 112.41

The USD/JPY currency pair is still in a flat. The technical pattern is ambiguous. At the moment, the trading instrument is consolidating in a rather narrow range of 107.20-107.35. Participants in financial markets expect additional drivers. We recommend you to pay attention to the dynamics of yield on US government bonds. Positions must be opened from key levels.

The news feed on the Japanese economy is quite calm.

USD/JPY

Indicators point to the power of sellers: the price has fixed below 50 MA and 100 MA.

The MACD histogram is in the negative zone, indicating a bearish sentiment.

Stochastic Oscillator is in the neutral zone, the %K line is above the %D line, which gives a signal to buy USD/JPY.

Trading recommendations
  • Support levels: 107.20, 107.05, 106.80
  • Resistance levels: 107.35, 107.60, 107.75

If the price fixes below 107.20, USD/JPY is expected to fall. The movement is tending to 106.90-106.70.

An alternative could be the growth of the USD/JPY currency pair to 107.50-107.80.

by JustForex

A Rebound In Canadian June Employment Figures?

By Orbex

Of late, the CAD hasn’t benefited as much when the market has taken on an appetite for risk.

Other commodity currencies have outperformed it, but this might not be so much Canada’s “fault”.

The spread of coronavirus is theorized to be dependent, in part, on weather, and Canada didn’t see a significant increase in cases until later in their spring. Because Canada’s case numbers increased later, their reopening and recovery will also come later.

On top of that is Canada’s dependence on its southern neighbor, which saw a record of new cases as recently as last week. The concern is the potential reinstatement of lockdown measures. Because this would cut gasoline consumption in Canada’s largest market.

On the other hand, Canada’s cases did spike up at the end of June (as did many countries in the world) but have since settled down. However, the increase might have been enough to affect employment during the month.

What We Are Looking For

The key number the markets are likely to focus on is the Net Change in Employment figure. This is because the unemployment rate is likely to be distorted a bit from people temporarily not participating in the market.

There isn’t all that firm of a consensus Net Change in Employment. The range of projections is between 400K to 700K jobs created during June. There seems to be an increasing agreement that the result will be at the top of that range. Of course, this would be a record amount in any case.

Since the beginning of the pandemic, Canada lost just a little over 3.0M jobs and has recovered just under 290K. Evidently, we are far from recovery.

But, if we reach the high end of the range, that would imply over a third of the job market losses had been recovered before the middle of the year.

The Market Reaction

Since there isn’t as firm of a consensus, we expect to see the CAD strengthen should the result come in near or, better yet, above the range of expectations.

Analyst expectations have been significantly underestimating Canada’s economic resilience, which might be the case once again. After Tuesday’s Ivey PMI survey showing companies are quite optimistic about the medium term, hiring might be picking up significantly.

Should the bulls take over after the data, the CAD has some catching up to do. Compared to the USD, the CAD is around 3% behind NZD and AUD for trading over the last week.

Other Data

Expectations are for the unemployment rate to come in at 12.0%, a substantial reduction from 13.7% in May. But, it’s important to parse this data through the participation rate, which in April dropped to the lowest rate in years as people stayed out of the labor market.

It staged a bit of a recovery in May to 61.4%. And we can expect it to increase to 63.3% for June. Prior to COVID, the participation rate was pretty consistently between 65-66%.

It’s perfectly possible to have a knock-out jobs number, but a relatively modest decrease in the unemployment rate, as more people return to the workforce.

By Orbex

Soon-to-be Scrooge Sunak’s Summer Statement will spook higher earners

By George Prior

The UK finance minister Rishi Sunak’s Summer Statement can be expected to spook many higher earners into considering the available international financial planning options, affirms the CEO of one of the world’s largest independent financial advisory and fintech organizations.

The comments from Nigel Green, chief executive and founder of deVere Group, follows the UK Chancellor’s so-called ‘mini Budget’ in which he announced a raft of measures to help the UK economy recover from the worst effects of coronavirus.

Mr Green notes: “The Chancellor Rishi Sunak has set out a series of extra measures to help kick-start the UK economy, whilst revealing that the Treasury has allocated £188bn of economy-bolstering measures since the start of the Covid-19 pandemic.

“He has galvanised his position as Santa Sunak and has, rightly, been praised for his handling of the economy; he has done an impressive job.

“But what happens when, in the Budget in November, he is forced into becoming Scrooge Sunak to pay for his record-beating level of support measures.”

He continues: “Many higher earners and investors will now be looking forward and thinking that the result of Sunak’s largesse, inevitably, means higher taxes to help plug the enormous £300bn blackhole in government coffers.

“Taxes on income contribute the highest proportion of the government’s tax-take, meaning even a small change would have a disproportionately positive impact for the Treasury.

“But they will not want to be hitting household incomes too much at this stage, as it will move to raise taxes in the medium to longer-term in order to indicate to financial markets that they are intent on controlling the deficit.

“There is also the potential of the oft-mooted one-off or continual tax on personal wealth.”

Mr Green goes on to add: “This can all be expected to spook higher earners into considering the available international financial planning options.”

Back in May, the deVere boss said: “It is almost inevitable that pension tax relief will be a target as the government looks to plug gaps in November’s Budget.

“As it’s likely the pension contribution relief for those on higher incomes will be reduced, an increasing number of people are now mulling making a larger one-off contribution before the Budget, in order to benefit from the higher tax relief whilst they still can.”

Nigel Green concludes: “We’re in highly unusual times economically and taxes will need to be raised to fund the gap. Those who will be likely expected to carry the burden can be expected to be exploring all the legitimate financial planning options, including international ones, to safeguard their wealth.”

About:

deVere Group is one of the world’s largest independent advisors of specialist global financial solutions to international, local mass affluent, and high-net-worth clients.  It has a network of more than 70 offices across the world, over 80,000 clients and $12bn under advisement.

Global rally lifts all markets

By IFCMarkets

Top daily news

Equity markets are trading in risk on mode currently ahead of US data expected to show over million Americans lost jobs last week while the declining trend for new unemployment benefits applications persisted. Stock markets traded higher on Wednesday despite Federal Reserve officials recent doubts about the durability of the rebound.

Forex news

Currency PairChange
EUR USD+0.06%
GBP USD+1.57%
USD JPY-0.07%
The Dollar weakening is intact today ahead of US Labor Department report expected to show 1.375 million Americans likely sought unemployment benefits over the last week. The live dollar index data show the ICE US Dollar index, a measure of the dollar’s strength against a basket of six rival currencies, lost 0.5% Wednesday as Federal Reserve reported consumer credit dropped 5.3% on an annual basis in May, after plunging 20% in April. EUR/USD joined GBP/USD’s continued climbing yesterday with both pairs higher currently. USD/JPY reversed its rising yesterday while AUD/USD reversed its sliding with the dynamics intact for both pairs currently.

Stock Market news

IndicesChange
Dow Jones Index+0.24%
GB 100 Index-0.29%
Nikkei Index+0.4%
Futures on three main US stock indexes are mixed currently after a bullish session on Wednesday. Stock indexes in US ended higher: the three main US stock indexes recorded gains ranging from 0.6% to 1.4% led by technology shares. European stock indexes are mixed currently after a pullback Wednesday led by banks and energy shares. Asian indexes are higher today led by Shanghai Composite as the decline of China’s factory gate prices slowed in June.

Commodity Market news

CommoditiesChange
Brent Crude Oil+0.31%
WTI Crude-0.4%
Brent is edging lower today. Prices advanced Wednesday despite the US Energy Information Administration report that US crude oil inventories rose 5.7 million barrels last week, after a fall of 7.2 million barrels the week before. The US oil benchmark West Texas Intermediate (WTI) futures gained: August WTI added 0.7% but is down currently. August Brent crude closed 0.5% higher at $43.29 a barrel on Wednesday.

Gold Market News

MetalsChange
Gold+0.27%
Gold prices are extending gains today. August gold rose 0.6% to $1820.60 an ounce on Wednesday.

Market Analysis provided by IFCMarkets

Note:
This overview has an informative and tutorial character and is published for free. All the data, included in the overview, are received from public sources, recognized as more or less reliable. Moreover, there is no guarantee that the indicated information is full and precise. Overviews are not updated. The whole information in each overview, including opinion, indicators, charts and anything else, is provided only for familiarization purposes and is not financial advice or а recommendation. The whole text and its any part, as well as the charts cannot be considered as an offer to make a deal with any asset. IFC Markets and its employees under any circumstances are not liable for any action taken by someone else during or after reading the overview.

Record US Covid-19 cases can’t halt the equity rally

By Hussein Sayed, Chief Market Strategist (Gulf & MENA), ForexTime

Equity markets have pushed higher in Asia following an impressive last hour rally on Wall Street yesterday. The record daily increase in US COVID-19 infections and the sharp rise in deaths has proved no barrier to the bulls. Rises in Apple and Amazon stocks sent the Nasdaq Composite to a new record high of 10,492, while the S&P 500 and Dow Jones Industrial Average advanced 0.78% and 0.68% respectively.

The current environment has led to the closure of the $2.8 billion Lansdowne Partners’ flagship equity long/short hedge fund. The lack of short winning strategies may even force more hedge funds to follow Lansdowne’s footsteps. The stimulus-driven market has made life for long/short strategies extremely difficult as relying on traditional valuation metrics to find short opportunities have failed throughout the latest bull market, and even throughout much of the previous 12 years since the Great Financial Crisis.

Fundamentals and valuations appear to be of limited influence on investor’s decision making. The fear of missing out, or “FOMO”, monetary and fiscal policy actions, low yields, lower interest rates for longer, are some of the factors that have led to this structural change in markets. If the Fed can keep zombie companies alive by keeping the lending taps open, why wouldn’t investors profit from these actions? However, the Fed cannot keep running these measures forever, and for many corporates relying on debt to stay afloat, sooner or later they will fail if they can’t return to profitability.

As always there is the good and the bad news. Depending on where investors put more weight is what drives asset prices and that is what leads to extreme highs and lows. Looking at where US stocks stand at the moment, it seems lots of the good news is already priced in. So even if bulls decide to keep pushing higher, the upside is likely to be limited from current levels unless we learn that an effective vaccine will hit the markets before year end and will be available for most of the population. If investors truly believed that the economy was returning to pre-pandemic levels soon, Gold wouldn’t be standing today at 9-year high, so it’s evident that investors who are participating in this risk-on rally are also hedging their positions by adding safe havens for their safety net.

Disclaimer: The content in this article comprises personal opinions and should not be construed as containing personal and/or other investment advice and/or an offer of and/or solicitation for any transactions in financial instruments and/or a guarantee and/or prediction of future performance. ForexTime (FXTM), its affiliates, agents, directors, officers or employees do not guarantee the accuracy, validity, timeliness or completeness, of any information or data made available and assume no liability as to any loss arising from any investment based on the same.


Forex-Time-LogoArticle by ForexTime

ForexTime Ltd (FXTM) is an award winning international online forex broker regulated by CySEC 185/12 www.forextime.com

WHEAT Analysis: Lower what supply estimate bullish for #C-WHEAT

By IFCMarkets

Lower what supply estimate bullish for #C-WHEAT

2020/21 soft wheat shipments from France outside the European Union would fall 43% from 2019/20 to 7.75 million tons, the lowest in four years, according to farm office FranceAgriMer forecast. At the same time the Rosario Grain Exchange lowered its 2020/21 harvest estimate in Argentine to a range of 18-19 million tons from 21-22 million previously. Lower supply estimates are bullish for wheat price. On the other hand a higher than expected estimate for the US harvest in the Department of Agriculture monthly report due on Friday is a downside risk for Wheat.

IndicatorVALUESignal
RSINeutral
MACDBuy
MA(50)Buy
FractalsBuy
Parabolic SARBuy
Donchian ChannelBuy


Summary of technical analysis

OrderBuy
Buy stopAbove 524.7
Stop lossBelow 470

Market Analysis provided by IFCMarkets

All eyes on US jobless claims

By Han Tan, Market Analyst, ForexTime

The US jobless claims data release is set to hog the limelight later today, as investors assess whether the recovery in the jobs market has sufficient momentum to trigger further gains in risk assets.

Markets are currently forecasting a print of 1.375 million for the initial jobless claims, while the continuing claims are expected to come in at 18.75 million. Although the initial jobless claims is now far below the 6.8 million peak registered in March, it remains stubbornly high compared to the pre-pandemic average of around 200,000. As for continuing claims, the idea of having over 18 million Americans who are still claiming unemployment benefits, weeks after the US economy began reopening, is denting expectations of a V-shaped recovery.

In short, these high-frequency data points are set to show that the drop in US unemployment is plateauing.

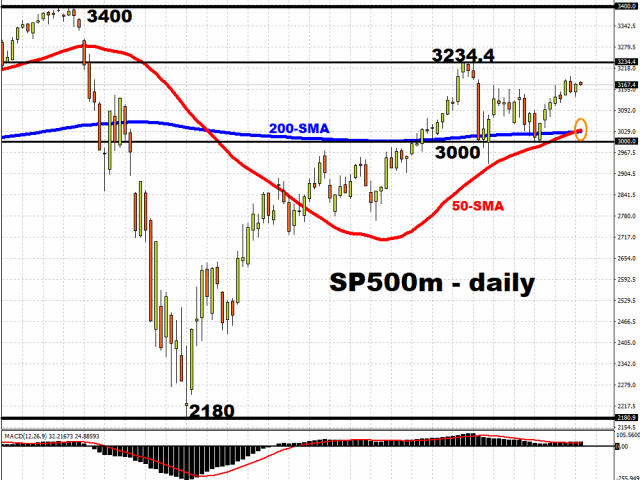
A positive surprise in either data sets could give US stocks another reason to break to the upside of its sideways trend. With a golden cross already forming on the daily chart for S&P 500 minis, it is poised to clear the early-June high of 3234.4; it’s just awaiting its next catalyst.


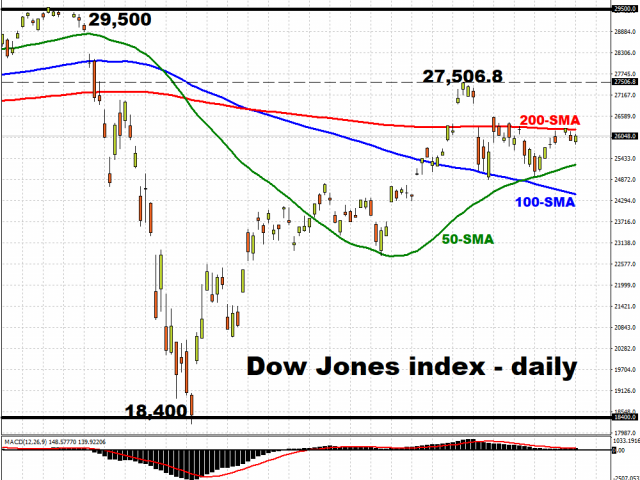
The Dow Jones index is also in clear need of renewed impetus, as it struggles to break above its 200-day simple moving average. Risk assets are marking time as they await greater clarity in the US economic outlook, as optimism fuelled by unprecedented stimulus measures is dampened by the prospects of a slower pace in the US economic recovery, considering the soaring number of daily cases in the US.

These weekly jobless figures will frame expectations for the July US non-farm payrolls, which is due to be released on the first Friday of August. With two months of positive shockers already under its belt, the upward momentum may all but evaporate over the coming months, if the US does not get a stranglehold on the coronavirus’s spread. Should the still-fragile recovery in the world’s largest economy be shattered, that may prompt the unwinding of the stunning gains seen in US stocks since March.

Disclaimer: The content in this article comprises personal opinions and should not be construed as containing personal and/or other investment advice and/or an offer of and/or solicitation for any transactions in financial instruments and/or a guarantee and/or prediction of future performance. ForexTime (FXTM), its affiliates, agents, directors, officers or employees do not guarantee the accuracy, validity, timeliness or completeness, of any information or data made available and assume no liability as to any loss arising from any investment based on the same.


Forex-Time-LogoArticle by ForexTime

ForexTime Ltd (FXTM) is an award winning international online forex broker regulated by CySEC 185/12 www.forextime.com

Seeking Certainty in Uncertain Times? Draw a Trendline — Learn How

By Elliott Wave International

– Elliott Wave International’s online trading course teaches traders how to identify, draw, and use trendlines to seize high-confidence set-ups in any market, on any time frame — Now FREE through July 14!


Today, the lines between what life looked like before the global pandemic of 2020 — and what it’ll look like after — seem forever blurred. Will we have the same job? Will our formerly college-bound children ever leave the house? Will we even live in the same state, or the same country?

Being a trader in times like these, even if only as a fallback option, is not a bad idea.

If that thought has crossed your mind, how would you like to learn a simple technique to identify new trading opportunities?

That technique is drawing trendlines. Elliott Wave International’s trading instructor Jeffrey Kennedy says:

“Trendlines are the simplest and most effective analytical tool traders can apply, be it to a stock, currency, or commodity.”

“They’re more effective than people realize.”

“And so simple, a kid with a ruler can use them.”

Hey, just think! You can add trendline drawing to your child’s at-home school curriculum…

But seriously, folks! There is a reason why Elliott Wave International is bringing back Jeffrey Kennedy’s popular online course “How to Use Trendlines to Spot Reversals and Ride Trends” now.

Today, millions of people around the world are turning to trading at home for the first time. The search for guidance is at an all-time high. If you’re one of them, or even if you’re an experienced trader, this course is for you … and you can take it today 100% free. (More on that below.)

But first — trendlines are simple straight lines connecting two price extremes on a chart. When you draw more than one, you create a so-called trend channel and see both the future trend and trend reversals.

Simple? Yes. And the results can be impressive.

Here’s a real-life example from Elliott Wave International’s Trader’s Classroom, which Jeffrey Kennedy edits: Tesla Motors, Inc. (TSLA).

Tesla’s shareholders are used to the fact that the company’s CEO Elon Musk can be a loose cannon, prone to unpredictable behavior like performing a striptease at a new model launch in China.

But in his November 21, 2019 Trader’s Classroombefore TSLA zoomed above $1000 — Jeffrey showed how simple trendline analysis made the coming rally quite predictable:

“We’ve gotten above the upper boundary line of the developing base channel.”

“I think we’re going to see a run on say 475-500″ by the end of 2019.”

“This is a ‘very confident buy-side opportunity.'”

From there, TSLA rocketed 60% in December and January to new all-time highs:

Today, as you know, TSLA is an investor darling, with prices hovering well above $1000.

But what got the rally started — before most people would look twice at the stock — was a simple bullish trendline break.

“How to Use Trendlines to Spot Reversals and Ride Trends” gives you 90+ minutes of trading lessons that teach you how to effectively use this tool.

You’ll learn how to:

  • Quickly identify a trend — up, down or sideways
  • See if investor psychology is supporting the trend
  • Define critical support and resistance levels for tight risk management
  • See when a correction is over and the trend is resuming

Most importantly, you’ll learn to recognize when a new opportunity is REAL or “fake.”

AND HERE’S THE BEST PART … THIS COURSE IS FREE!

Through July 14, you can take Jeffrey Kennedy’s online trading course, “How to Use Trendlines to Spot Reversals and Ride Trends,” 100% free as a member of Elliott Wave International’s Club EWI.

Club EWI really is free — there is no fee or credit card required to join its 350,000+ online members.

All you need is 30 seconds to get a free Club EWI password — and you can take the trendlines course instantly.

By the way, at Elliott Wave International’s online Store, this course sells for $79. So, don’t miss this free opportunity to learn a useful skill. Take this online course now, FREE.