The Analytical Overview of the Main Currency Pairs on 2020.07.14

by JustForex

The EUR/USD currency pair

Technical indicators of the currency pair:
  • Prev Open: 1.13023
  • Open: 1.13416
  • % chg. over the last day: +0.29
  • Day’s range: 1.13253 – 1.13503
  • 52 wk range: 1.0777  – 1.1494

The technical pattern is still ambiguous on the EUR/USD currency pair. A trading instrument is consolidating. Investors expect additional drivers. The second wave of the COVID-19 epidemic remains in the spotlight. Governor of California, Gavin Newsom, imposed new statewide restrictions due to a sharp increase in the number of people infected with coronavirus. At the moment, the key range is 1.1325-1.1370. We expect important economic releases from Germany and the US. Positions should be opened from key levels.

The news feed on 2020.07.14:
  • – German ZEW economic sentiment index at 12:00 (GMT+3:00);
  • – US inflation report at 15:30 (GMT+3:00).
EUR/USD

Indicators do not give accurate signals: the price is testing 50 MA.

The MACD histogram is in the positive zone, but below the signal line, which gives a weak signal to buy EUR/USD.

Stochastic Oscillator is in the neutral zone, the %K line has crossed the %D line. There are no signals at the moment.

Trading recommendations
  • Support levels: 1.1325, 1.1300, 1.1260
  • Resistance levels: 1.1370, 1.1400

If the price fixes below 1.1325, EUR/USD quotes are expected to fall. The movement is tending to 1.1300-1.1270.

An alternative could be the growth of the EUR/USD currency pair to 1.1400-1.1420.

The GBP/USD currency pair

Technical indicators of the currency pair:
  • Prev Open: 1.26203
  • Open: 1.25539
  • % chg. over the last day: -0.57
  • Day’s range: 1.25063 – 1.25609
  • 52 wk range: 1.1466  – 1.3516

GBP/USD quotes have been declining. During yesterday’s and today’s trading sessions, the British pound has lost more than 100 points against the greenback. At the moment, the GBP/USD currency pair is testing the support level of 1.2510. The 1.2555 mark is the nearest resistance. A trading instrument has the potential for further decline. Great Britain published a weak report on the country’s GDP. Positions should be opened from key levels.

We recommend paying attention to economic releases from the US.

GBP/USD

Indicators signal the power of sellers: the price has fixed below 100 MA.

The MACD histogram is in the negative zone, indicating the bearish sentiment.

Stochastic Oscillator is in the neutral zone, the %K line has started crossing the %D line. There are no signals at the moment.

Trading recommendations
  • Support levels: 1.2510, 1.2470, 1.2440
  • Resistance levels: 1.2555, 1.2580, 1.2620

If the price fixes below 1.2510, a further fall in GBP/USD quotes is expected. The movement is tending to 1.2470-1.2440.

An alternative could be the growth of the GBP/USD currency pair to 1.2580-1.2620.

The USD/CAD currency pair

Technical indicators of the currency pair:
  • Prev Open: 1.35851
  • Open: 1.36079
  • % chg. over the last day: +0.08
  • Day’s range: 1.35931 – 1.36463
  • 52 wk range: 1.2949  – 1.4668

Purchases prevail on the USD/CAD currency pair. The trading instrument has updated local highs. USD/CAD quotes found resistance at 1.3645. The 1.3610 mark is already a “mirror” support. The continuation of the upward trend is possible. We recommend paying attention to the dynamics of “black gold” prices. Positions should be opened from key levels.

The news feed on Canada’s economy is calm.

USD/CAD

Indicators signal the power of buyers: the price has fixed above 50 MA and 100 MA.

The MACD histogram is in the positive zone, indicating the bullish sentiment.

Stochastic Oscillator is in the neutral zone, the %K line has crossed the %D line. There are no signals at the moment.

Trading recommendations
  • Support levels: 1.3610, 1.3580, 1.3545
  • Resistance levels: 1.3645, 1.3700

If the price fixes above 1.3645, further growth of the USD/CAD quotes is expected. The movement is tending to the round level of 1.3700.

An alternative could be a decrease in the USD/CAD currency pair to 1.3585-1.3560.

The USD/JPY currency pair

Technical indicators of the currency pair:
  • Prev Open: 106.884
  • Open: 107.238
  • % chg. over the last day: +0.34
  • Day’s range: 107.116 – 107.366
  • 52 wk range: 101.19  – 112.41

USD/JPY quotes have been growing. The trading instrument has updated local highs. At the moment, the USD/JPY currency pair is testing the following support and resistance levels: 107.10 and 107.35, respectively. The technical pattern signals a further increase in USD/JPY quotes. We recommend payштп attention to the dynamics of US government bonds yield. Positions should be opened from key levels.

The news feed on Japan’s economy is calm.

USD/JPY

Indicators do not give accurate signals: the price has crossed 100 MA.

The MACD histogram is in the positive zone, indicating the bullish sentiment.

Stochastic Oscillator is in the overbought zone, the %K line has crossed the %D line. There are no signals at the moment.

Trading recommendations
  • Support levels: 107.10, 106.95, 106.80
  • Resistance levels: 107.35, 107.60, 107.75

If the price fixes above 107.35, further growth of the USD/JPY quotes is expected. The movement is tending to 107.60-107.80.

An alternative could be a decrease in the USD/JPY currency pair to 106.90-106.70.

by JustForex

No love for Pound as UK growth disappoints

By Lukman Otunuga, Research Analyst, ForexTime

Sterling weakened against the Dollar and most G10 currencies on Tuesday morning after UK economic growth figures massively undershot expectations by increasing a tepid 1.8% in May versus the 5% forecast.


This disappointing rebound from the painful -20.4% contraction witnessed in April reveals that the UK economy is recovering much slower than expected, despite the reopening of construction and manufacturing sectors. Any talks of a V-shaped recovery may be swept under the carpet for the time being, especially if data continues to miss market expectations.

On the bright side, there is a sense of optimism around growth in June and July experiencing a sharper rebound due to the re-opening of non-essential shops, leisure and hospitality sector. Regardless, the cost of coronavirus in the UK has been painfully expensive with the economy contracting 25% during March and April. Any signs of rising coronavirus cases in the United Kingdom could trigger fears of renewed lockdowns, ultimately hitting sentiment and threatening growth.

Appetite towards the British Pound is likely to fall further in the near term, as disappointing growth adds to the negative list of negative themes haunting investor attraction.
Looking at the technical picture, the GBPUSD is under pressure on the daily charts with prices trading below 1.2550 as of writing. Sustained weakness below this level may open a path towards 1.2400 and 1.2250.

GBPJPY approaches 134.00.

Expect the GBPJPY to trend lower in the short to medium term, especially after UK economic growth disappointed in May.
The currency pair is under pressure on the daily charts with prices approaching the 50 SMA. A solid breakdown below 134.00 may trigger a decline towards the 131.60 support. If prices can break back above 135.00, the GBPJPY has the potential to test 137.00.

EURGBP approaches 0.9100.

Prices seem to be  pushing towards the 0.9100 resistance level. A clean break above this point could trigger a move higher towards 0.9100 in the short term.

Disclaimer: The content in this article comprises personal opinions and should not be construed as containing personal and/or other investment advice and/or an offer of and/or solicitation for any transactions in financial instruments and/or a guarantee and/or prediction of future performance. ForexTime (FXTM), its affiliates, agents, directors, officers or employees do not guarantee the accuracy, validity, timeliness or completeness, of any information or data made available and assume no liability as to any loss arising from any investment based on the same.


Forex-Time-LogoArticle by ForexTime

ForexTime Ltd (FXTM) is an award winning international online forex broker regulated by CySEC 185/12 www.forextime.com

EURCHF Analysis: Getting ready for an ECB meeting and a speech by the head of SNB

By IFCMarkets

Getting ready for an ECB meeting and a speech by the head of SNB

The upward movement means the strengthening of the euro and the weakening of the Swiss franc. The speech of the head of the Swiss National Bank (SNB) Thomas Jordan is expected on July 14. Market participants believe that he will confirm his department’s commitment to a super-soft monetary policy. This may weaken the franc. Recall that the SNB rate is negative and has been -0.75% since the beginning of 2015. On Monday, two more companies (Pfizer and BioNTech) announced the creation of a Covid-19 vaccine. This is a negative factor for the “safe haven currencies” – the Swiss franc and yen. The EU leaders’ summit will be held on July 17-18. They will discuss the functioning of the anti-crisis fund. Before it begins, there may be some positive statements from the ECB, which will hold its regular meeting just the day before – July 16. The ECB’s rate of 0% ( since March 2016) is not expected to change.

IndicatorVALUESignal
RSIBuy
MACDBuy
MA(200)Neutral
FractalsBuy
Parabolic SARBuy
Bollinger BandsNeutral


Summary of technical analysis

OrderBuy
Buy stopAbove 1,07
Stop lossBelow 1,06

Market Analysis provided by IFCMarkets

JPMorgan to kick off US earnings season

By Han Tan, Market Analyst, ForexTime

The upcoming Q2 results from US-listed companies are set to be a horror show; probably the worst since the Global Financial Crisis. While the reported numbers from the first three months of 2020 only showed what a few weeks of the global pandemic could do to Wall Street’s earnings, these upcoming releases are set to reveal three months worth of damage.

Before the US markets open on Tuesday, JPMorgan Chase & Co. will be the first out of the blocks for the imminent reporting season, and markets are not entirely sure what to expect for America’s largest bank.

Perhaps the most pressing concern for shareholders is how much money are banks setting aside in anticipation of customers not being able to service their loans in the future. A bigger amount of money that’s set aside for what’s known as ‘loan-loss provisions’ could send a risk-off signal to the markets, indicating that banks are bracing for more financial hardship among its customers. The estimates for JPMorgan’s credit loss provisions range from US$2.4 billion to nearly US$10 billion for Q2.

With over 18 million Americans still jobless in June in the wake of the lockdown measures, that is likely to deal a major blow to credit card spending and the issuance of new loans. In other words, Q2 was likely a much harder time for banks to make money.

Amid such concerns, markets are also bracing for greater volatility for JPMorgan’s share prices, with an expected 5.6 percent move after the results are announced. If so, that would be about three times the 1.9 percent average post-earnings move in JPMorgan’s share prices over the past two years.

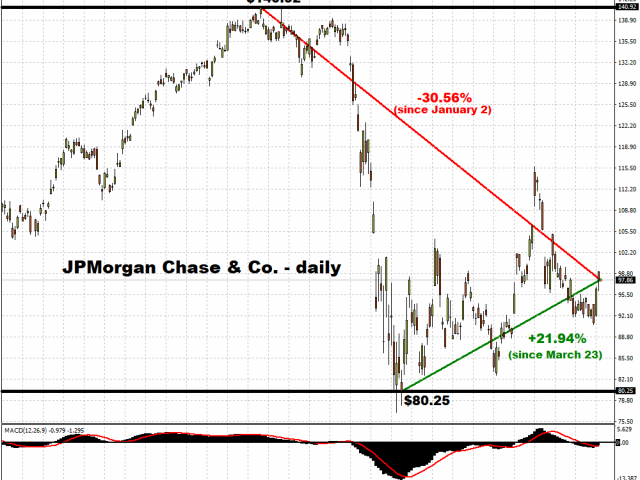
JPMorgan’s shares have clearly reflected the woes expected to befall the US banking sector, along with the persistent fears surrounding the US economic outlook. Its shares remain over 30 percent lower compared to its record high of $140.92 on January 2 this year. Even its almost-22 percent gain since March 23 pales in comparison to the S&P 500’s and the Dow’s 40-plus percent surge registered respectively during the same period.

Beyond the Q2 results, the rest-of-2020 outlook by JPMorgan is set to have the greater impact on the share’s immediate term performance. Should the largest US bank express the belief that the worst of the pandemic’s ill effects are over, that could push its stock price back above the $100 psychological level.

However, a heavier emphasis on explicit concerns surrounding the surge in US infections, which heightens the prospects of another nationwide shutdown that hurts the bank’s customer base, may make for a sluggish performance for JPMorgan’s shares until there is greater confidence in the US economic outlook.


Disclaimer: The content in this article comprises personal opinions and should not be construed as containing personal and/or other investment advice and/or an offer of and/or solicitation for any transactions in financial instruments and/or a guarantee and/or prediction of future performance. ForexTime (FXTM), its affiliates, agents, directors, officers or employees do not guarantee the accuracy, validity, timeliness or completeness, of any information or data made available and assume no liability as to any loss arising from any investment based on the same.


Forex-Time-LogoArticle by ForexTime

ForexTime Ltd (FXTM) is an award winning international online forex broker regulated by CySEC 185/12 www.forextime.com

Futures mixed as earnings season kicks off

By IFCMarkets

Top daily news

Global markets are mixed currently after the rally paused on Monday against the background of rising infection cases in US. US equities ended mostly lower Monday led by technology shares as the earnings season kicks off.

Forex news

Currency PairChange
EUR USD-0.02%
GBP USD+1.15%
USD JPY-0.01%
The Dollar weakening has halted today . The live dollar index data show the ICE US Dollar index, a measure of the dollar’s strength against a basket of six rival currencies, slid 0.1% Monday as the federal budget deficit more than doubled in June. GBP/USD reversed its climbing while EUR/USD continued rising Monday as German statistics office Destatis reported the index for prices wholesalers charge for goods rose in June. Both pairs are lower currently. USD/JPY reversed its sliding yesterday while AUD/USD continued its retreat with both pairs higher currently.

Stock Market news

IndicesChange
Dow Jones Index+0.18%
Nikkei Index-0.87%
Hang Seng Index-1.58%
Australian Stock Index-0.05%
Futures on three main US stock indexes are recovering currently. Several companies start reporting second quarter results today including JP Morgan, Citigroup and Delta Air Lines. Stock indexes in US ended mixed Monday: the three main US stock indexes posted returns ranging from -2.1% to +0.04% as Dallas Fed President Robert Kaplan said US economic growth is slowing after initial burst in May. European stock indexes are edging higher currently after a notching back to back gains on Monday led by cyclical shares. Asian indexes are falling today led by Hong Kong’s Hang Seng Index after the US on Monday rejected China’s disputed claims to offshore resources in most of the South China Sea, following President Trump’s comment Friday there was no scope for a phase-two agreement on trade between the two countries as Washington’s relationship with China had been “severely damaged.”

Commodity Market news

CommoditiesChange
Brent Crude Oil-0.1%
WTI Crude-0.18%
Brent is edging lower today. Oil prices ended lower on Monday after Wall Street Journal Saturday report that an alliance of major crude producers led by Saudi Arabia was urging the Organization of the Petroleum Exporting Countries and its allies, collectively known as OPEC+, to ease oil output curbs as planned beginning in August. The US oil benchmark West Texas Intermediate (WTI) for August fell 1.2% Monday and is down currently. September Brent crude slid 1.2% to $42.72 a barrel on Monday. OPEC’s Joint Technical Committee, which provides a review of the oil market and makes recommendations to OPEC+, meets today.

Gold Market News

MetalsChange
Silver-0.17%
Gold prices are retracing lower today. August gold gained 0.7% to $1814.10 an ounce on Monday.

Market Analysis provided by IFCMarkets

Note:
This overview has an informative and tutorial character and is published for free. All the data, included in the overview, are received from public sources, recognized as more or less reliable. Moreover, there is no guarantee that the indicated information is full and precise. Overviews are not updated. The whole information in each overview, including opinion, indicators, charts and anything else, is provided only for familiarization purposes and is not financial advice or а recommendation. The whole text and its any part, as well as the charts cannot be considered as an offer to make a deal with any asset. IFC Markets and its employees under any circumstances are not liable for any action taken by someone else during or after reading the overview.

Altimmune Shares Up 20% Upon Forming Partnership for Intranasal COVID-19 Vaccine

By The Life Science Report

Source: Streetwise Reports   07/09/2020

Altimmune shares reached a new 52-week high after the company reported it is collaborating with DynPort Vaccine on U.S. government funding efforts for AdCOVID™, its COVID-19 vaccine candidate.

Clinical-stage biopharmaceutical company Altimmune Inc. (ALT:NASDAQ), which focuses it efforts on developing treatments for liver disease, intranasal vaccines and immune modulating therapies, today announced that “it has entered into a teaming agreement with DynPort Vaccine Company (DVC), a General Dynamics Information Technology company, to coordinate U.S. Government funding efforts and, if successful, to provide program management, drug development activity integration, and regulatory support for AdCOVID, Altimmune’s single-dose intranasal COVID-19 vaccine candidate.”

The company noted that DVC has extensive experience in vaccine development and has supported vaccines and medical countermeasures for emerging diseases and bioterror threats under contracts with the Biomedical Advance Research and Development Authority, the Department of Defense and the National Institute of Allergy and Infectious Diseases.

The firm indicated that it is collaborating with the University of Alabama at Birmingham on preclinical AdCOVID studies and that the initial results from these studies are expected to be received shortly. Altimmune anticipates that it will be able to start manufacturing the vaccine candidate in Q3/20 and that it will commence a Phase 1 clinical trial during Q4/20.

The company explained that “AdCOVID is an intranasal COVID-19 vaccine candidate designed to guard the respiratory tract from viral invasion and to provide downstream protection against viral spread through stimulation of both mucosal and systemic antibodies (IgA and IgG) as well as cell-mediated immunity.” The firm stated that it believes that AdCOVID’s intranasal delivery method is much simpler than an injection and may possibly eliminate the requirement for the vaccine to be administration by trained medical staff.

Altimmune advised that it already has two existing programs that were supported by non-dilutive government funding. Those programs are NasoShieldTM, a single dose intranasal anthrax vaccine candidate, and T-COVIDTM, an intranasal therapeutic for early COVID-19.

DynPort Vaccine Co. is based in Frederick, Md., and was established in order to develop vaccines and therapeutics for U.S. Government customers. The company has been involved in developing medical countermeasures for biodefense, chemical warfare agents and emerging infectious diseases.

Altimmune is a clinical stage biopharmaceutical company headquartered in Gaithersburg, Md., that is engaged in the development of treatments for liver disease, immune modulating therapies and intranasal vaccines. The firm stated that “its diversified pipeline includes next generation peptide therapeutics for NASH (ALT-801) and chronic hepatitis B (HepTcell™), an intranasal immune modulating treatment for COVID-19 (T-COVID™) and intranasal vaccines (AdCOVID™, NasoShield™ and NasoVAX™).”

Altimmune started the day with a market capitalization of around $342.5 million with approximately 20.11 million shares outstanding and a short interest of about 13.1%. ALT shares opened slightly lower today at $16.73 (-$0.30, -1.76%) versus yesterday’s $17.03 closing price, but later reached a new 52-week high price this morning of $24.65.The stock has traded today between $16.11 and $24.65 per share and is currently trading at $20.62 (+$3.59, +21.08%).

Sign up for our FREE newsletter at: www.streetwisereports.com/get-news

Disclosure:
1) Stephen Hytha compiled this article for Streetwise Reports LLC and provides services to Streetwise Reports as an independent contractor. He or members of his household own securities of the following companies mentioned in the article: None. He or members of his household are paid by the following companies mentioned in this article: None.
2) The following companies mentioned in this article are billboard sponsors of Streetwise Reports: None. Click here for important disclosures about sponsor fees.
3) Comments and opinions expressed are those of the specific experts and not of Streetwise Reports or its officers. The information provided above is for informational purposes only and is not a recommendation to buy or sell any security.
4) The article does not constitute investment advice. Each reader is encouraged to consult with his or her individual financial professional and any action a reader takes as a result of information presented here is his or her own responsibility. By opening this page, each reader accepts and agrees to Streetwise Reports’ terms of use and full legal disclaimer. This article is not a solicitation for investment. Streetwise Reports does not render general or specific investment advice and the information on Streetwise Reports should not be considered a recommendation to buy or sell any security. Streetwise Reports does not endorse or recommend the business, products, services or securities of any company mentioned on Streetwise Reports.
5) From time to time, Streetwise Reports LLC and its directors, officers, employees or members of their families, as well as persons interviewed for articles and interviews on the site, may have a long or short position in securities mentioned. Directors, officers, employees or members of their immediate families are prohibited from making purchases and/or sales of those securities in the open market or otherwise from the time of the interview or the decision to write an article until three business days after the publication of the interview or article. The foregoing prohibition does not apply to articles that in substance only restate previously published company releases.
6) This article does not constitute medical advice. Officers, employees and contributors to Streetwise Reports are not licensed medical professionals. Readers should always contact their healthcare professionals for medical advice.

( Companies Mentioned: ALT:NASDAQ,
)

79North AKA 12 Exploration Sitting on a Lot of Gold

By The Gold Report

Source: Bob Moriarty for Streetwise Reports   07/09/2020

Bob Moriarty of 321gold profiles this company whose project is a short distance from Iamgold and Newmont’s operating mines.

This is easily going to be one of the more confusing articles I have ever written. There was a private company named 79North headed by Jon North. 79North (TWLV:CSE) did a reverse takeover with a public vehicle named 12 Exploration with a ticker symbol of TWLV-C.

But if you plug that into Stockwatch it takes you to the website of 79North. Which doesn’t exist as a company and won’t until mid-August after shareholders vote on the new/old name. Which they will because insiders hold a majority of the shares.

Clear?

As mud.

However the good news is that like TriStar Gold (TSG-V) 12 Exploration (TWLV) holds a greenstone gold system on top of a plateau in South America in a gold belt that extends from West Africa well into Venezuela. The garimpeiro miners in Surinam (used to be Dutch Guiana) have been mining placer gold from every stream and river coming off of the high ground for over a hundred years. The pork-knockers have taken millions of ounces of gold in that time. They are better miners than record keepers.

American investors will be a little frustrated since there is no OTCBB symbol just yet. The shares only came free trading three weeks ago. Prior to the reverse takeover 79North did a $4.5 million financing so it is well cashed up and ready to hit the ground running.

TWLV is the only junior operating in Surinam however both Iamgold and Newmont have operating mines a short distance from the Nassau Plateau property of 12 Exploration. The company owns 80% of the 210 square km project. It is on trend with Newmont’s Merian mine that produced 393,000 ounces of gold in 2019.

The company is both young and aggressive. Jon North makes it clear that he intends to pick up other projects. Initial work at the Nassau site will consist of a LiDAR survey and geophysical groundwork. Drilling is probably a year off.

With just over $4 million in the kitty, the company is well positioned to advance the project. They are still in the clumsy stage, the website is way behind the news flow but it’s a brand new venture.

79North/12 Exploration is an advertiser and I did participate in the private placement. Do your own due diligence.

12 Exploration Inc
TWLV-C $0.20 (Jul 09, 2020)
85.9 million shares
12 Exploration Inc website

Bob Moriarty
President: 321gold
Archives
321gold

Bob Moriarty founded 321gold.com, with his late wife, Barbara Moriarty, more than 16 years ago. They later added 321energy.com to cover oil, natural gas, gasoline, coal, solar, wind and nuclear energy. Both sites feature articles, editorial opinions, pricing figures and updates on current events affecting both sectors. Previously, Moriarty was a Marine F-4B and O-1 pilot with more than 832 missions in Vietnam. He holds 14 international aviation records.

Sign up for our FREE newsletter at: www.streetwisereports.com/get-news

Disclosure:
1) Bob Moriarty: I, or members of my immediate household or family, own shares of the following companies mentioned in this article: 79North/12 Exploration. 79North/12 Exploration is an advertiser on 321 Gold. I determined which companies would be included in this article based on my research and understanding of the sector.
2) The following companies mentioned are billboard sponsors of Streetwise Reports: None. Click here for important disclosures about sponsor fees.
3) Statements and opinions expressed are the opinions of the author and not of Streetwise Reports or its officers. The author is wholly responsible for the validity of the statements. The author was not paid by Streetwise Reports for this article. Streetwise Reports was not paid by the author to publish or syndicate this article. The information provided above is for informational purposes only and is not a recommendation to buy or sell any security. Streetwise Reports requires contributing authors to disclose any shareholdings in, or economic relationships with, companies that they write about. Streetwise Reports relies upon the authors to accurately provide this information and Streetwise Reports has no means of verifying its accuracy.
4) The article does not constitute investment advice. Each reader is encouraged to consult with his or her individual financial professional and any action a reader takes as a result of information presented here is his or her own responsibility. By opening this page, each reader accepts and agrees to Streetwise Reports’ terms of use and full legal disclaimer. This article is not a solicitation for investment. Streetwise Reports does not render general or specific investment advice and the information on Streetwise Reports should not be considered a recommendation to buy or sell any security. Streetwise Reports does not endorse or recommend the business, products, services or securities of any company mentioned on Streetwise Reports.
5) From time to time, Streetwise Reports LLC and its directors, officers, employees or members of their families, as well as persons interviewed for articles and interviews on the site, may have a long or short position in securities mentioned. Directors, officers, employees or members of their immediate families are prohibited from making purchases and/or sales of those securities in the open market or otherwise from the time of the interview or the decision to write an article until three business days after the publication of the interview or article. The foregoing prohibition does not apply to articles that in substance only restate previously published company releases. As of the date of this article, officers and/or employees of Streetwise Reports LLC (including members of their household) own securities of Newmont, a company mentioned in this article.

Mary K Gold Mine of Bond Resources Produced 2000 tons of 0.65 Oz Au

By The Gold Report

Source: Bob Moriarty for Streetwise Reports

  07/10/2020

Bob Moriarty of 321gold discusses a company that is reopening an Idaho gold mine that closed during World War 2.

In 1942 with the US involved in a massive war with Japan and Germany the government made the decision to close all non-essential gold mines under the auspices of the War Production Board. It was called the Limitation Order #208. Hundreds of mines closed down. Many never reopened after the war ended. They all were in operation and making money when the government shut them down in the fall of 1942.

The Mary K Gold Mine in Idaho was one. A new barely listed company named Bond Resources Inc. (BJB:CSE) did a deal on the project calling for a total payment for the 450 square acre property of $10 million. The way they structured the deal was that Bond Resources pays the remaining owed $9.5 million out of profits depending on the grade of the material actually processed.

Bond took a 500-pound sample from the vein system at surface that showed a 0.79-ounce per ton gold grade. Another 23-kilo sample was taken also from surface that they ran a split through a fire assay. It came back with 44.32 g/t Au and 16.7 g/t Ag. It’s a high-grade gold mine with reported production of 2,000 tons of 0.65 oz. per ton from 1908 until 1942 when the owner had a heart attack. There has been no drilling or modern exploration work done at the mine.

Historic reports suggest there was a high-grade gold shoot located 23 feet beneath the #4 level of between 11.02 and 59.12 ounces per ton gold but the owner died before he could mine it.

While there is great opportunity, there are warts. Because the shares just came free trading, there is no US symbol yet. Since the stock is so tightly held, you have to make an appointment three months in advance to buy shares in the open market.

While $10 million sounds like a lot of money to pay for a mine, it comes out of free cash flow, not in advance. The money the company raised recently will go to pay the down payment on the land and begin a drill program of 14 holes for 1,667 meters of core drilling. Drilling commenced in June and results should be released by August or so. The company is testing the glory hole recorded in the history and the results could be barn burning.

Because the company comes with no baggage it is free to move forward at lightning speed. Management is especially strong. The goal for production a year from now is 150 TPD. Work has commenced on rehabilitation of the main level.

I liked the story enough when I was told about the project to invest in the PP. If the shares came down a bit I would be prepared to invest more. I see this as an interesting speculation. Bond is an advertiser. Do your own due diligence.

Bond Resources
BJB-C $0.37 (Jul 09, 2020)
78.6 million shares
Bond Resources website

Bob Moriarty
President: 321gold
Archives
321gold

Bob Moriarty founded 321gold.com, with his late wife, Barbara Moriarty, more than 16 years ago. They later added 321energy.com to cover oil, natural gas, gasoline, coal, solar, wind and nuclear energy. Both sites feature articles, editorial opinions, pricing figures and updates on current events affecting both sectors. Previously, Moriarty was a Marine F-4B and O-1 pilot with more than 832 missions in Vietnam. He holds 14 international aviation records.

Sign up for our FREE newsletter at: www.streetwisereports.com/get-news

Disclosure:
1) Bob Moriarty: I, or members of my immediate household or family, own shares of the following companies mentioned in this article: Bond Resources. Bond Resources is an advertiser on 321 Gold. I determined which companies would be included in this article based on my research and understanding of the sector.
2) The following companies mentioned are billboard sponsors of Streetwise Reports: None. Click here for important disclosures about sponsor fees.
3) Statements and opinions expressed are the opinions of the author and not of Streetwise Reports or its officers. The author is wholly responsible for the validity of the statements. The author was not paid by Streetwise Reports for this article. Streetwise Reports was not paid by the author to publish or syndicate this article. The information provided above is for informational purposes only and is not a recommendation to buy or sell any security. Streetwise Reports requires contributing authors to disclose any shareholdings in, or economic relationships with, companies that they write about. Streetwise Reports relies upon the authors to accurately provide this information and Streetwise Reports has no means of verifying its accuracy.
4) The article does not constitute investment advice. Each reader is encouraged to consult with his or her individual financial professional and any action a reader takes as a result of information presented here is his or her own responsibility. By opening this page, each reader accepts and agrees to Streetwise Reports’ terms of use and full legal disclaimer. This article is not a solicitation for investment. Streetwise Reports does not render general or specific investment advice and the information on Streetwise Reports should not be considered a recommendation to buy or sell any security. Streetwise Reports does not endorse or recommend the business, products, services or securities of any company mentioned on Streetwise Reports.
5) From time to time, Streetwise Reports LLC and its directors, officers, employees or members of their families, as well as persons interviewed for articles and interviews on the site, may have a long or short position in securities mentioned. Directors, officers, employees or members of their immediate families are prohibited from making purchases and/or sales of those securities in the open market or otherwise from the time of the interview or the decision to write an article until three business days after the publication of the interview or article. The foregoing prohibition does not apply to articles that in substance only restate previously published company releases.

( Companies Mentioned: BJB:CSE,
)

Rep. Mooney seeks to audit gold intervention, ban federal tax on precious metal coins

By Money Metals News Service

Surreptitious intervention in the gold market by the U.S. government is the target of legislation introduced in the House of Representatives by Rep. Alex X. Mooney, R-West Virginia.

In a letter to House colleagues seeking support for his Gold Reserve Transparency Act, H.R. 2559, Mooney writes: “Because there are concerns the U.S. Treasury may have sold, swapped, leased, or otherwise placed encumbrances upon some of America’s gold, H.R. 2559 also requires a full accounting of any and all sales, purchases, disbursements, or receipts; a full accounting of any and all encumbrances, including due to lease, swap, or similar transactions in existence or entered into in the past 15 years; and an analysis of the sufficiency of the measures taken to ensure the physical security of such reserves.”

Information about the bill is posted at Congress’ internet site here.

Mooney also has introduced legislation to protect Americans against the Federal Reserve’s steady devaluation of the dollar – legislation to forbid federal taxation on the sale of gold, silver, platinum, and palladium coins.

In a letter to colleagues seeking support for his Monetary Metals Tax Removal Act, H.R. 1089, Mooney writes: “The Internal Revenue Service does not let taxpayers deduct the staggering capital losses they suffer when holding Federal Reserve Notes over time, so it is unfair to assess a capital gains tax when citizens hold gold and silver to protect them from the Fed’s policy of currency devaluation.”

Information about the bill is posted at Congress’ internet site here.

Americans who seek transparency in the gold market and favor allowing the public to protect itself with the monetary metals against currency devaluation can alert their members of Congress to Mooney’s legislation.

The text of his letters to colleagues about the bills is appended.

Letter in support of the Gold Reserve Transparency Act

Letter in support of the Monetary Metals Tax Removal Act


The Money Metals News Service provides market news and crisp commentary for investors following the precious metals markets.
Dollar bearish bets ticked up despite surprisingly strong jobs report

By IFCMarkets

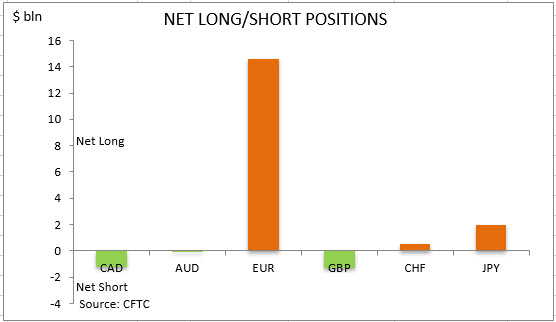
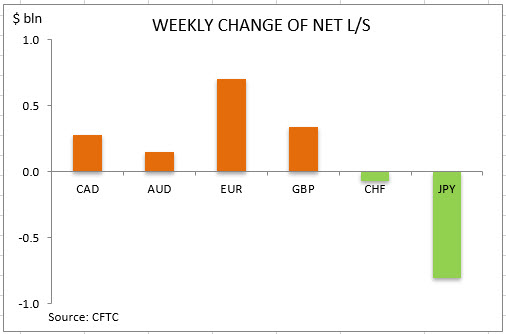
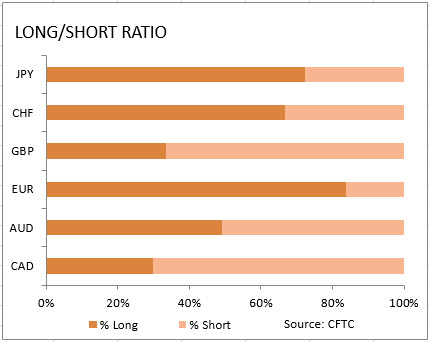
US dollar net short bets declined to $14.48 billion from $13.89 against the major currencies during the one week period, according to the report of the Commodity Futures Trading Commission (CFTC) covering data up to July 7 and released on Friday July 10. The change in net short dollar bets resulted from significant decrease in bearish bets on Canadian dollar, British Pound and increase in bullish bets on euro, which outweighed a marked decrease in yen bullish bets. The Pound, Canadian and Australian dollars maintained net short positions against the dollar. The bearish dollar bets rose again despite US Labor Department data showed that the US added back 4.8 million jobs in June when a gain of 3.7 million jobs was expected, and Institute of Supply Management report its manufacturing purchasing managers index climbed to 52.6 from 43.1 in May. Readings above 50 indicate an expansion in economic activity. Bullish euro view was supported by sharp easing in euro-zone’s business activity contraction in June according to final services PMI reading.


CFTC Sentiment vs Exchange Rate

July 07 2020BiasEx RateTrendPosition $ mlnWeekly Change
CADbearishpositive-1236275
AUDbearishpositive-48153
EURbullishpositive14599706
GBPbearishpositive-1287339
CHFbullishpositive501-71
JPYbullishpositive1954-809
Total14483


commitment of traders net long short
commitment of traders weekly change
market sentiment ratio long short positions

Market Analysis provided by IFCMarkets

Note:
This overview has an informative and tutorial character and is published for free. All the data, included in the overview, are received from public sources, recognized as more or less reliable. Moreover, there is no guarantee that the indicated information is full and precise. Overviews are not updated. The whole information in each overview, including opinion, indicators, charts and anything else, is provided only for familiarization purposes and is not financial advice or а recommendation. The whole text and its any part, as well as the charts cannot be considered as an offer to make a deal with any asset. IFC Markets and its employees under any circumstances are not liable for any action taken by someone else during or after reading the overview.