EURUSD Analysis: Contracting service sector in euro-zone bearish for EURUSD

By IFCMarkets

Contracting service sector in euro-zone bearish for EURUSD

Euro-zone’s Service PMI final reading confirmed the sector continued contracting: Markit report indicated the services PMI ticked up to 12 after falling to 11.7 in March. Readings above 50.0 mean industry expansion, below indicate contraction. This is bearish for EURUSD.

IndicatorVALUESignal
RSINeutral
MACDNeutral
Donchian ChannelNeutral
MA(200)Sell
FractalsSell
Parabolic SARSell


Summary of technical analysis

OrderSell
Buy stopBelow 1.0781
Stop lossAbove 1.0841

Market Analysis provided by IFCMarkets

Technical Analysis Points To Key Reversal Of Global Markets

By TheTechnicalTraders

Recently, we received a number of email messages and comments regarding our recent Bitcoin article and how we attempted to explain the market trend/technical analysis.  It appears we were not making our interpretation very clear for our friends and followers.  This article should help to clear up our interpretation of the major market trends and our advanced technical analysis tools and utilities.

As purely technical traders, there are certain things we want to make clear.  First, we do pay attention to what is happening to the fundamentals and global economic data when it posts.  We’ve authored many previous articles stating our belief that “capital is like a living/breathing entity which attempts to survive (generate ROI with little risk) in various global market environments”.  In order for us, as technical traders, to identify real opportunities for superior trades, we must be aware of what is happening in the “environment” that surrounds us.

A perfect example is a recent collapse in oil.  We continue to read articles of how thousands of traders believed super-low oil prices were a GIFT and these traders piled into long trades expecting oil to rebound higher.  This happens when technical traders fail to understand the environment in which the instrument is trading within.  At this time, the supply side for oil vastly outweighs the demand-side – so the environment is skewed towards much weaker price activity.  The chance that any moderate price recovery would take place is minimal until the supply glut is diminished.

One of the easiest ways to think of a truly technical trader is that we don’t care if the price goes up or down, we just care that our technical triggers and indicators present clear opportunities that are superior to more traditional methods of trading.

To accomplish this, we believe we must understand the environment in which we are trading and the technical conditions that are present within the charts.  Technically, the price may be going up within a defined bearish/downtrend. This does not mean the upside price move is a technically valid “trade trigger”.  The opposite may be true for a move down in a bullish trending market.  Without proper confirmation of the overall technical bias, environment, and shorter-term technical triggers – one might as well throw a dart at a wall and hope for the best.

In our view, we issue many published research reports for our friends and followers to read and review every week.  Our interpretation of the technical triggers, economic data, forward expectations, and other setups are designed to help you learn how we conduct our research and to help you find opportunities in the markets.  Our members receive this same research and more – they receive our hand-selected trade triggers.  These are the best technical setups/trade triggers known as BAN Trades (Best Asset Now) so we can find that provide superior opportunities for skilled traders.

Before you continue, be sure to opt-in to our free market trend signals
before closing this page, so you don’t miss our next special report & signal!

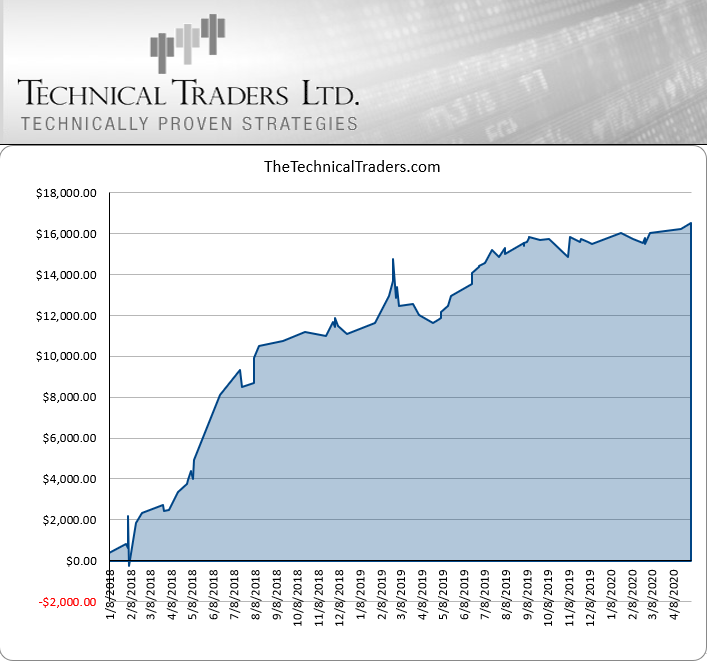
This chart, below, shows our historical results for the past 2.5 years.  You’ll notice that we do sometimes take losses – yes.  You’ll also notice the consistency of the profits – yes.  We hope you’ll also notice that we work very hard to make sure our member’s success is the first priority in everything we do.

Now, back to technical analysis…

Our research team believes the markets have set up a massive downside price advance (creating a much deeper low that confirms Fibonacci price theory and aligns with our Fibonacci Price Amplitude Arcs), which sets up a very unique technical pattern.  Until the price is capable of establishing a series of new higher-high points through consecutive upside price advances AND until the Weekly and Monthly charts confirm a new high price breakout – technically speaking, we’re still in a bearish price trend.

Weekly S&P 500 (SPY) Chart

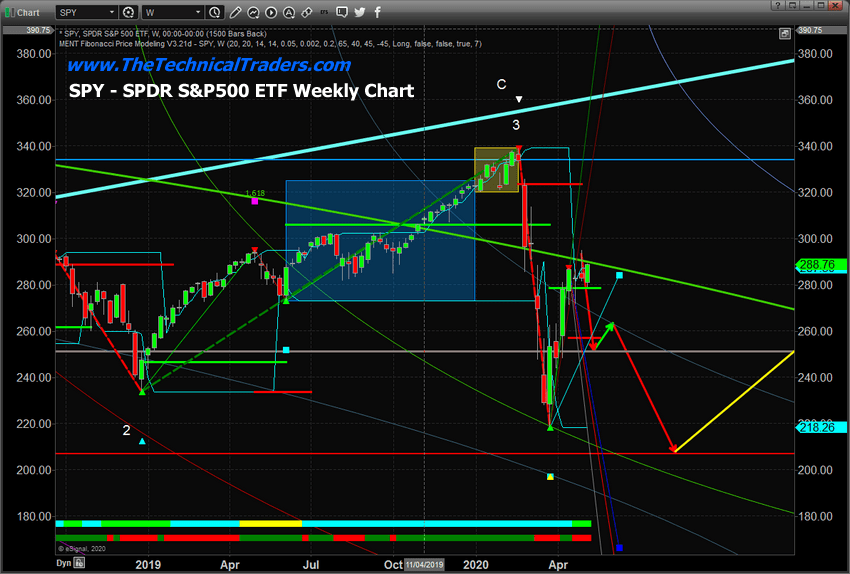
This Weekly SPY chart, below, shows you three key technical factors that tell us there is a greater risk of a breakdown in price than any upside price trend continuation…

A.  The recent low/bottom price level broke below the December 2018 low price level (new lower low).

B.  The GREEN ARC price level is a massive 1.618 Fibonacci Price Amplitude Arc that suggests massive resistance exists at this level.  Price moving above this level then falling back below it suggests a “scouting pattern” type of event took place and FAILED.

C.  Recent price activity has rallied from recent lows too, again, reconfirm the GREEN ARC resistance level.  We believe this Fibonacci Price Amplitude Arc will present a major price ceiling as Q2 and Q3 economic data pushes forward – driving the price lower over time and eventually targeting the RED support level near $208 in July or August.

You may remember that we’ve been suggesting a bottom will not complete until sometime after July or August 2020 in previous research posts.  Now you know where we derive these projections and expectations, we use technical analysis and our advanced predictive modeling tools to “see into the future”.  Believe it or not, we’ve already mapped out SPY price activity 10+ years into the future.

Weekly Transportation Index (TRAN) Chart

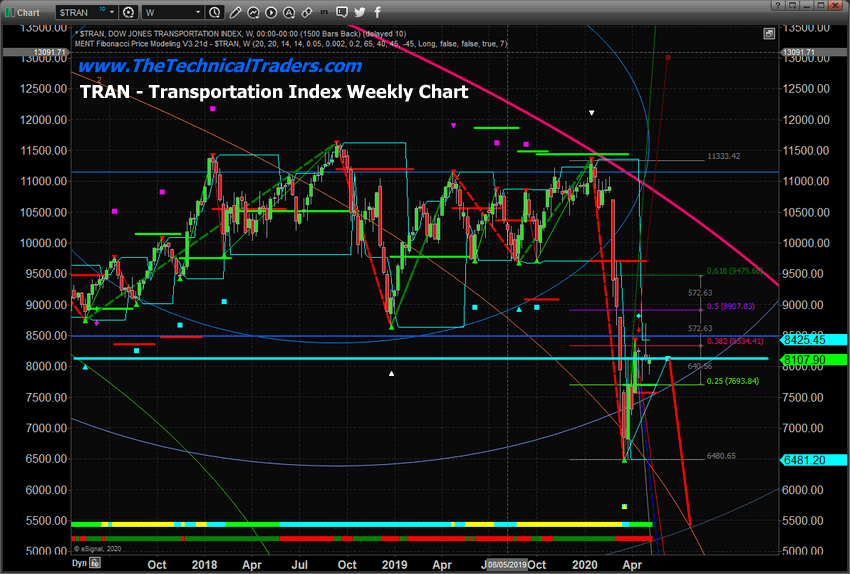
This TRAN Weekly chart also helps to confirm our technical analysis research.  We are deploying the same types of technical analysis tools on all of these charts to show you how our research team attempts to identify trends and opportunities.  You can see the heavy LIGHT RED Fibonacci Price Amplitude Arc near the peak in February 2020.  This Arc represents a massive price resistance channel.  You may also notice the thinner ORANGE Fibonacci Price Amplitude Arc that touches recent lows?  This arc acts as Support in its current form.

Our proprietary Adaptive Fibonacci Price Modeling System is drawing a CYAN projected target level from recent lows where the heavy CYAN line is displayed on this chart.  Additionally, a previous BLUE target level is also displayed on this chart which originated from the recent PEAK in February 2020.  Now, pay attention to where the TRAN price has found recent resistance and stalled…  RIGHT AT THOSE LEVELS.

We believe the failure of the SPY and TRAN to move above the ARCs and Fibonacci price targets suggests a critical upward price trend failure.  A failure of this nature will prompt a new downside price move in the near future as price must always attempt to establish new price highs or new price lows based on the Fibonacci Price Theory (technical analysis).

Monthly Dow Jones Industrial (INDU)

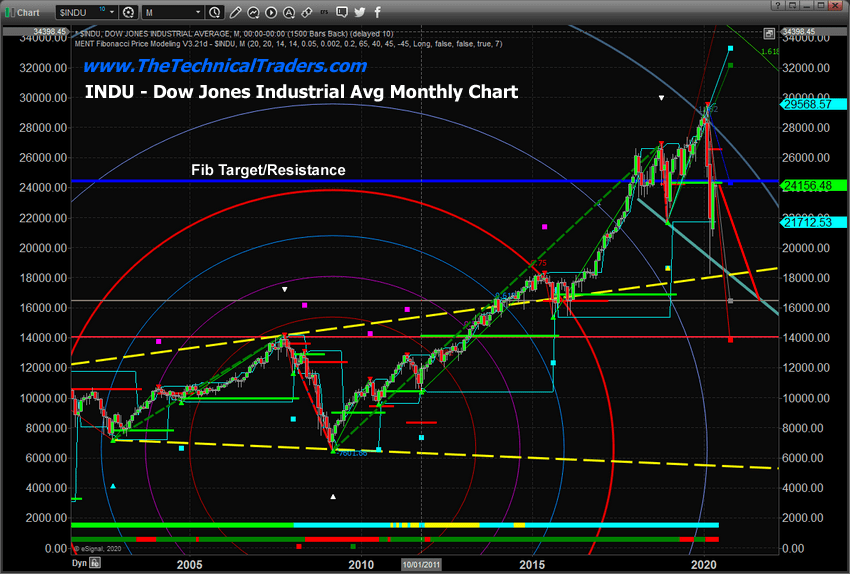
This last chart, the Monthly INDU, is probably the most impressive one so far.  Clear Fibonacci Price Amplitude Arcs suggest massive resistance near the February 2020 peak levels.  A very clear downward price channel originating from the February 2018 lows and transitioning across the December 2018 lows and into current lows.  An Adaptive Fibonacci Price Modeling System target price (CYAN) near 8108 (very near current price levels) and a very clear technical price pattern (Dojis) suggesting a potential top or price reversal is setting up.  Lastly, the recent deep low price stalled very near to the historical YELLOW DASHED price channel that spans the 2000 and 2007 price peaks.

Pulling all of this technical analysis together with simple Fibonacci Price Theory suggests that until the markets can prove to us that price is capable of establishing we upside price structures, the recent deep new price low (near 18,265) suggests future price action may collapse even further and attempt to establish a new, deeper, “new price low” before the real bottoms set up in the markets.  On this INDU chart, it suggests that a “deeper price low” may result in a move well below the YELLOW DASHED price channel from 2000/07 and attempt to move to the RED Fibonacci Price Target level near 14,000.

Concluding Thoughts:

Obviously, we are still very bearish in terms of the current overall market trend.  No technical analysis technique has shown us that the intermediate and longer-term trends have changed direction to Bullish.  Yes, our Daily systems did identify a bullish trigger within this bearish trend on the SPY which we executed successfully for our members.  There is an opportunity to take a bullish trade within a bearish price trend when technical analysis confirms the trigger and it is executed properly.

If you are using our free public research for your own trading decision-making and/or using it as an opportunity to find and execute successful trades, please remember you are the one ultimately making the decisions to trade based on our interpretation and free research posts.  We, as technical traders, will continue to post new research articles and content that we believe is relevant to the current market setups.

If you want to improve your accuracy and opportunities for success, then we urge you to visit TheTechnicalTraders.com to learn how you can enjoy our research and our members-only trading triggers (see the first chart in this article).  If you are managing your retirement account or 401k, then we urge you to visit www.TheTechnicalInvestor.com to learn how to protect your assets and grow your wealth using our proprietary longer-term modeling systems.  Our goal is to help you find and create success – not to confuse you.

Our researchers will generate free research on just about any topic that interests them.  As technical traders, we follow price, predict future price moves, tops, bottoms, and trends, and attempt to highlight incredible setups that exist on the charts.  What you do with it is up to you.  Visit www.TheTechnicalTraders.com/FreeResearch/ to review all of our detailed free research posts.

In closing, we would like to suggest that the next 5+ years are going to be incredible opportunities for skilled traders.  Remember, we’ve already mapped out price trends 10+ years into the future that we expect based on our advanced predictive modeling tools.  If our analysis is correct, skilled traders will be able to make a small fortune trading these trends and Metals will skyrocket.  The only way you’ll know which trades to take or not is to become a member.

Chris Vermeulen
Chief Market Strategist
TheTechnicalTraders.com


COCOA Analysis: Cocoa harvest in West Africa may decline

By IFCMarkets

Cocoa harvest in West Africa may decline

According to the Council, the cocoa harvest in Ghana will amount to 780 thousand tons, which is less than its October forecast of 800 thousand tons. From October to mid-April, cocoa exports from Ghana fell by 0.9% over the same period of the previous season. Ghana is the 2nd largest cocoa producer in the world after Côte d’Ivoire. Together, these two countries provide slightly less than 70% of the global cocoa crop. From October to early May, cocoa exports from Côte d’Ivoire amounted to 1.89 million tons, which is only 1.1% more than in the same period last season. Meanwhile, quarantine due to the coronavirus pandemic has caused an increase in demand for chocolate products. According to the US marketing agency Nielsen, chocolate and cocoa sales in the United States since the beginning of the year increased by 5.7%. The European Cocoa Association reported an increase in cocoa processing in Europe in the 1st quarter of 2020 by 0.9% to 373.6 thousand tons compared to last year. This is the maximum volume observed in the 1st quarter since 2003. Note that cocoa quotes are highly dependent on the weather in West Africa.

IndicatorVALUESignal
RSINeutral
MACDBuy
MA(200)Neutral
FractalsNeutral
Parabolic SARBuy
Bollinger BandsBuy


Summary of technical analysis

OrderBuy
Buy stopAbove 2420
Stop lossBelow 2200

Market Analysis provided by IFCMarkets

US stock market is trying to keep growing

By IFCMarkets

Top daily news

A number of US shale companies joined the OPEC + decision to limit oil production. Thanks to this, WTI has risen in price almost twice. The US stock market resumed growth amid optimistic Fed statements about the beginning of the US economy recovery in the 2nd half of the year. The Friday publication of Non Farm Payrolls for April may be the main event of the week.

Forex news

Currency PairChange
EUR USD-1.46%
GBP USD-0.6%
USD JPY-0.8%

The euro is getting cheaper today for the third day in a row after the German High Court ordered the ECB to report for the purchase of bonds under the TLTRO program within 3 months. In the event of a negative development, the court may exclude the Bundesbank from ECB measures designed to weaken the impact of the coronavirus pandemic on the European economy. The probability of this is still low, but the fact of going to court indicates disagreements in the distribution of economic aid among the EU countries. Another factor in the euro’s fall was the publication of the Markit Manufacturing PMI in the EU for April, which turned out to be worse than forecasts. GBPUSD again failed to overcome the psychological level of 1.26 and dropped slightly. The continuing uncertainty about the conditions of Brexit in trade between Britain and the EU contributed to the weakening of the pound. Note that by the end of June, the parties must agree on extension of the transitional period until December 31 this year. Without a mutual trade agreement, Britain will have to trade with the European Union under the rules of the World Trade Organization. They are much less profitable, which can significantly weaken the pound and the entire British economy.

Stock Market news

IndicesChange
Dow Jones Index+0.55%
S&P 500+0.88%
Nasdaq 100+1.05%
DE 30+0.39%

On Tuesday, US stocks rose for the second day in a row due to a slight easing of US-Chinese discord over foreign trade. Additional trade sanctions and duties will be discussed, it will take a lot of time. In addition, the Fed announced that the US economy will begin to recover in the 2nd half of 2020. The leading shares of companies from the S&P 500 list belong to the following sectors: Healthcare, Technology and Basic Materials. The coronavirus pandemic in the United States continues. Quotes of the pharmaceutical corporation Pfizer Inc rose by 2.4% and the UnitedHealth Group – by 1.9%. Shares of Portola Pharmaceuticals soared 130% and Ritter Pharmaceuticals – 88%. At the same time, Norwegian Cruise Line Holdings lost 22.6%. This morning, European stock indices grew slightly amid rising futures for US indices. Investors have so far ignored a record drop in the German factory orders indicator for March and the poor profit forecast of the BMW car manufacturer (-2.7%). Labor market data for April from independent agency ADP will be released in the USA today.

Commodity Market news

CommoditiesChange
WTI Crude+17.4%
Brent Crude Oil+12.9%

Oil prices continued to rise on Wednesday. US crude oil has increased almost twofold in a week thanks to the announcement by a number of countries on the mitigation of quarantine. In addition, OPEC + reduced production by 10 million barrels per day since May 1. In the United States, many companies stopped or limited the development of shale wells at the Permian Basin. Today, the attention of market participants is drawn to data on changes in official US oil reserves for the week, which will be released later this evening. The independent American Petroleum Institute expects them to grow by 8.4 million barrels and also the gasoline inventories to decrease by 2.4 million barrels. Note that the demand for sugar rose with the increase in oil prices. Brazil, the United States and other countries may begin to process some of their sugar cane into biofuels.

Gold Market News

MetalsChange
Gold+0.18%

Gold has been traded for a few weeks in a narrow range near the psychological level of $ 1,700 per ounce. Investors are uncertain about when the coronavirus pandemic will end and the world economy will recover. The escalation of the US-China trade war is also a significant global risk and supports gold quotes. Palladium is getting cheaper amid a sharp decline in new car sales worldwide due to quarantine. The metal is used in gasoline engine catalysts.

Market Analysis provided by IFCMarkets

Note:
This overview has an informative and tutorial character and is published for free. All the data, included in the overview, are received from public sources, recognized as more or less reliable. Moreover, there is no guarantee that the indicated information is full and precise. Overviews are not updated. The whole information in each overview, including opinion, indicators, charts and anything else, is provided only for familiarization purposes and is not financial advice or а recommendation. The whole text and its any part, as well as the charts cannot be considered as an offer to make a deal with any asset. IFC Markets and its employees under any circumstances are not liable for any action taken by someone else during or after reading the overview.

Report on COVID-19 Human Costs and Economic Damage

By Dan Steinbock      

The belated COVID-19 mobilization has resulted in historical human costs and a major economic damage. If right policies are further ignored, a multi-year global contraction could follow.

My report on the pandemic has been released [here’s the link]. “The Tragedy of Missed Opportunities” focuses on “the COVID-19 human costs and economic damage.” It identifies the missed opportunities in the virus battle. And it outlines the consequent costs in terms of cases, lost lives, and economic damage.

Despite several opportunities to initiate early mobilization outside China and proximate Asia, most major economies did not opt for preemptive action.

In the US, the Trump administration has engaged in a self-defeating effort to “protect the economy” (read: the markets). The White House continues to suppress an adequate science-based policy response resting on medical evidence.

The European Union (EU) was more willing but unable to fight the virus earlier. But it is not fully integrated and lacks the common institutions for effective response.

The 1st Missed Opportunity (Jan 2020)  

Between the first recorded case (Dec 30, 2019), and the WHO’s announcement of the international emergency (Jan 30, 2020), the epicenter of the outbreak was centered in Wuhan, Hubei, and nearby Chinese provinces.

That’s when China, Hong Kong and later South Korea mobilized against the virus.

The virus did not stay in Asia, however. First cases were also recorded in some 20 countries worldwide, including the United States and EU economies.

Moreover, the virus information that China and other early mobilizers used to attack the virus has also been available to the White House since January 3, while the European CDC began its risk assessments only days later. Yet, neither chose to mobilize.

That’s how they missed the first major opportunity for proactive mobilization.

The 2nd Missed Opportunity (1Q 2020)

The second critical opportunity to contain the virus outbreak could be dated from the WHO’s international emergency (Jan 30) to its global pandemic announcement (Mar 10). That’s when the epicenter moved to Europe and then to the US. Yet, full mobilization in both began only 1-2 weeks after the pandemic warning – 6-8 weeks later than proactive mobilization in China and Hong Kong.

Most countries failed to provide WHO full case reports until February, which penalized international cooperation at a critical moment. Worse, inadequate preparedness contributed to new challenges, including faulty test kits and long delays in testing, and huge shortages of personal protective equipment (PPE) that endangered the lives of frontline healthcare professionals.

US trade wars caused additional shortages. The Trump White House allowed US companies to export PPE, but did not permit Chinese companies to import PPE to the US. Meanwhile, failed responses to the outbreak added to health risks. Media coverage was high on hype, but short on facts causing a virtual ‘infodemic.’

Oddly, many international observers, including even reputable dailies in the West, began an odd battle against the WHO and its leadership, who have urged countries to mobilize fast against the virus since January.

That’s how the second major opportunity for mobilization was missed. In cumulative terms, it covers the entire 1st quarter of the year.

The 3rd Missed Opportunity (1Q-2Q 2020)

As escalation continued in Europe, the epicenter moved from the West Coast to the US. Meanwhile quarantines and lockdowns diffused worldwide. It was only in April that the social distancing measures, which China initiated in January, were widely introduced in the West.

Since late mobilization and weaker enforcement proved less effective, the result was effective herd immunity. Instead of flattening the epidemic curve, many countries initially fattened that curve for weeks. So, the outbreak will diffuse and linger worldwide longer than currently acknowledged, while secondary virus waves and residual virus clusters are more likely over the year.

Premature lockdown exits are likely to magnify human and economic costs.

As these costs have soared, some government leaders seek to evade responsibility via a “paranoid style of politics.” That’s why the Trump White House has targeted China as a politically expedient scapegoat. It’s a futile effort to misplace the blame.

That’s how the third major opportunity to battle the virus failed. In cumulative terms, it comprises the first half of the year.

The 4th Missed Opportunity (1Q-2Q 2020 and beyond)

In this period, the epicenter will move from advanced economies to emerging and developing countries with weaker healthcare systems.

Many of these countries have been willing to fight the outbreak, but they lack adequate resources domestically and external support. The net effect could prove catastrophic.

Recently, the UN food relief agency (WFP) chief David Beasley warned UN Security Council about an impending “global humanitarian catastrophe,” especially in Africa.

As the global pandemic threatens to push 265 million people into abject poverty in the world’s poorest areas, the adverse feedback effects could be felt worldwide.

That’s how the fourth major opportunity against COVID-19 would be missed.

Massive human costs   

In January, there were almost 7,740 cumulative confirmed cases in China, but barely 14 in Europe and 5 in the US.

Having peaked in February, the cases in China were 82,000 at the end of the 1st quarter. Yet, those in Europe and US exceeded 425,000 and 140,000, respectively.

Assuming the global pandemic’s current growth pace, the worldwide cases could exceed 7-8 million by the end of the 2nd quarter. In Europe and the US, that could translate to almost 3 million each.

Without appropriate vaccination and therapies, the human costs will continue to climb until the epidemic curves normalize over time around spring 2021 or 2022.

Historical economic damage   

Even in the current baseline case (IMF, Apr 2020), the cumulative loss to global GDP over 2020 and 2021 could amount to about $9 trillion. That’s more than the world’s third and fourth largest economies – Japan and Germany – combined.

Yet, that baseline is not adequately realistic because it ignores the dire economic landscape – 2008/9 global crisis, 2010, European debt crisis, failed global recovery 2017/18 due to US tariff wars and the consequent accumulation of global debt of 230% of world GDP – that preceded the pandemic.

So, let’s assume two more realistic trajectories, the Great Power Conflicts scenario and the Great Power Cooperation scenario. Let’s also assume, as many analysts and epidemiologists currently do, that there might be a longer outbreak in 2020, a new outbreak in 2021, or both.

The Great Power Conflicts scenario presumes progressive deterioration of pandemic and economic costs. In this alternative, lingering pandemic risks would generate intense trade and technology wars, “hot” geopolitical conflicts and a long, multi-year global depression. This is the current path of the Trump White House.

Unlike US Great Depression in the 1930s, it would result in gloomier outlook since the output potential of the US and major Western economies was in secular stagnation even before the global pandemic.

In the Great Power Cooperation scenario, pandemic and economic costs would be significantly reduced. In this alternative, lingering pandemic risks would prove longer than expected, but trade deals in trade and technology and subdued geopolitical friction would result in eventual economic recovery. This appears to be the preferred path of China, the EU and the US opposition of the Trump White House.

Here’s the inconvenient truth: if the late mobilizers and failed mobilizers had followed the proactive measures of the early mobilizers, millions of people could have avoided the virus and hundreds of thousands would remain alive.

There was nothing inevitable about this global pandemic but the costs of complacency will prove high, very high.

About the Author:

Dr. Dan Steinbock is an internationally recognized strategist of the multipolar world and the founder of Difference Group. He has served at the India, China and America Institute (USA), Shanghai Institutes for International Studies (China) and the EU Center (Singapore). For more, see https://www.differencegroup.net

This commentary is based on Dr Steinbock’s briefing on Saturday, May 2, 2020.
 

Forex Technical Analysis & Forecast 06.05.2020

Article By RoboForex.com

EURUSD, “Euro vs US Dollar”

After rebounding from 1.0900, EURUSD continues falling with the target at 1.0820. According to the main scenario, the price is expected to reach this level and then consolidate near these lows. After that, the instrument may break the range to the upside and start a new correction to return to 1.0900 and test it from below.

EURUSD
Risk Warning: the result of previous trading operations do not guarantee the same results in the future

GBPUSD, “Great Britain Pound vs US Dollar”

After completing the correction at 1.2482, GBPUSD is forming a new descending structure with the first target at 1.2363. Later, the market may consolidate near these lows. After that, the instrument may break the range to the upside and start another correction towards 1.2500.

GBPUSD
Risk Warning: the result of previous trading operations do not guarantee the same results in the future

USDRUB, “US Dollar vs Russian Ruble”

USDRUB continues falling towards 73.41. After that, the instrument may start a new growth to reach 74.74 and then resume trading downwards with the short-term target at 71.30.

USDRUB
Risk Warning: the result of previous trading operations do not guarantee the same results in the future

USDJPY, “US Dollar vs Japanese Yen”

After finishing the correction at 106.88 and then rebounding from this level to the downside, USDJPY has broken 106.60. The main scenario implies that the price may continue trading downwards with the short-term target at 107.55.

USDJPY
Risk Warning: the result of previous trading operations do not guarantee the same results in the future

USDCHF, “US Dollar vs Swiss Franc”

After breaking 0.9670 to the upside, USDCHF is expected to continue growing towards 0.9750. Today, the pair may reach this level and then consolidate near these highs. Later, the market may break the range to the downside and start another correction to return to 0.9670.

USDCHF
Risk Warning: the result of previous trading operations do not guarantee the same results in the future

AUDUSD, “Australian Dollar vs US Dollar”

After completing the correction at 0.6466 and then forming a new consolidation range below this level, AUDUSD has broken it to the downside. Possibly, the pair may continue falling towards 0.6363 and then consolidate near these lows. After that, the instrument may break the range to the upside and form one more ascending correction with the target at 0.6464.

AUDUSD
Risk Warning: the result of previous trading operations do not guarantee the same results in the future

BRENT

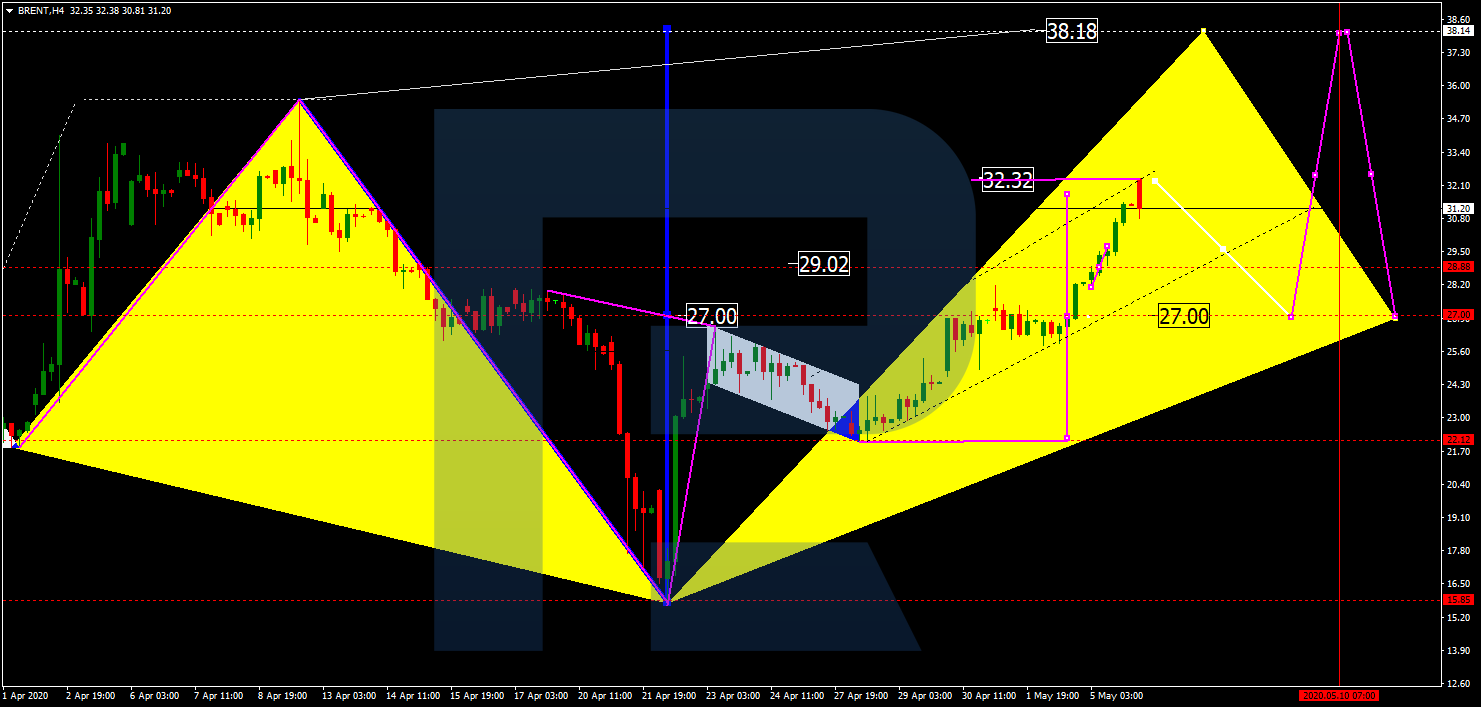
After finishing the third ascending wave at 32.32, Brent is expected to consolidate close to these highs. After that, the instrument may break the range to the downside and correct towards 27.00. Later, the market may resume trading upwards with the first target at 38.20.

BRENT
Risk Warning: the result of previous trading operations do not guarantee the same results in the future

XAUUSD, “Gold vs US Dollar”

After reaching the correctional target at 1690.00, Gold is forming another ascending wave towards 1718.25. After that, the instrument may consolidate around this level. If later the price breaks the range to the upside, the market may continue growing with the short-term target at 1745.25.

GOLD
Risk Warning: the result of previous trading operations do not guarantee the same results in the future

BTCUSD, “Bitcoin vs US Dollar”

After completing the correction at 8800.00 and rebounding from this level to the upside, BTCUSD is forming another ascending structure towards 9120.00. After that, the instrument may consolidate. If later the price breaks this range to the downside, the market may start a new correction to return to 8800.00; if to the upside – resume trading upwards with the target at 10000.00.

BITCOIN
Risk Warning: the result of previous trading operations do not guarantee the same results in the future

S&P 500

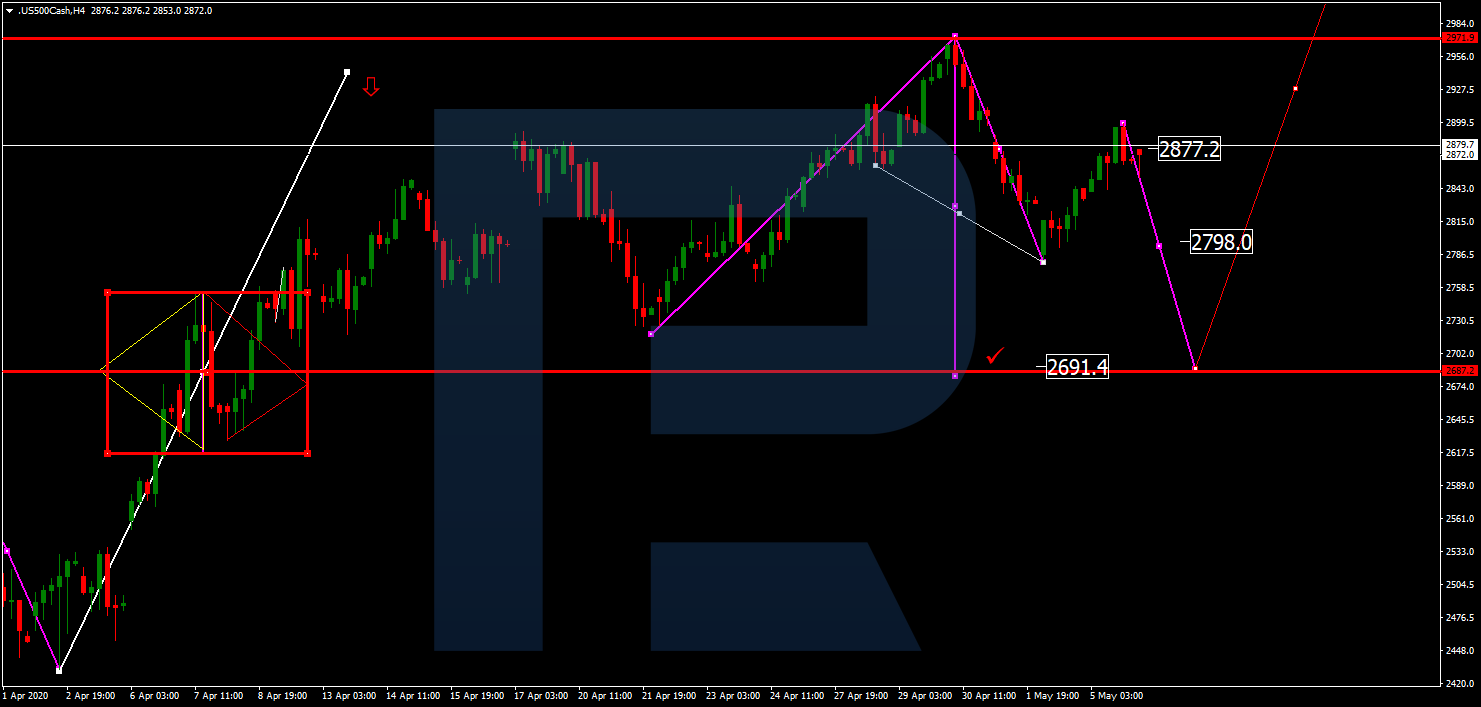
After finishing the correction at 2877.2, the Index is falling with the target at 2798.0. Later, the market may consolidate. After that, the instrument may break the range to the downside and the form a new descending structure towards 2691.4.

S&P 500

Article By RoboForex.com

Attention!
Forecasts presented in this section only reflect the author’s private opinion and should not be considered as guidance for trading. RoboForex LP bears no responsibility for trading results based on trading recommendations described in these analytical reviews.

Gold Prices Continue To Trade Flat

By Orbex

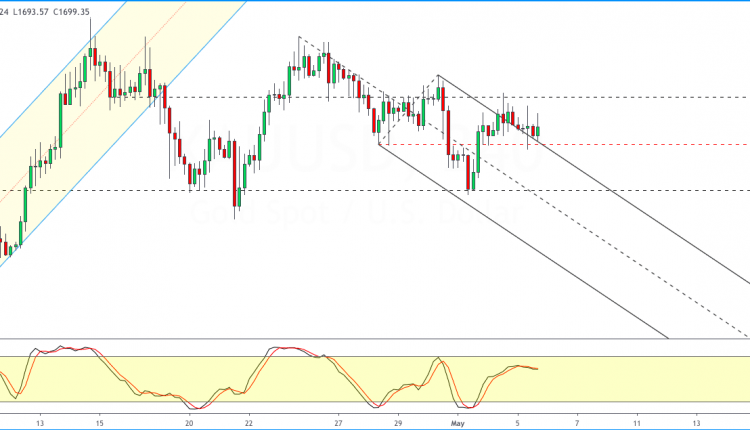
Gold prices are likely to continue to trade within the levels of 1712.47 and 1691.76.

This comes as risk appetite is improving slightly. With prices trading within the said levels, the bias also remains mixed.

There is scope for both an upside or a downside breakout. However, prices need to post a convincing close above the ranges to mark further direction to the trend.

The lower high formation, of course, adds to the downside bias, but with the support at 1691.76 holding up, for now, we expect the consolidation to continue.

By Orbex


Fibonacci Retracements Analysis 06.05.2020 (GBPUSD, EURJPY)

Article By RoboForex.com

GBPUSD, “Great Britain Pound vs US Dollar”

What can we see in the H4 chart? It looks like the pair is going to continue trading downwards in the nearest future, because it has failed to break the high at 1.2648. After testing the high and rebounding from it, GBPUSD is forming a new correctional structure to the downside with the target at 38.2%, 50.0%, and 61.8% fibo at 1.2175, 1.2030, and 1.1881 respectively.

GBPUSD_H4
Risk Warning: the result of previous trading operations do not guarantee the same results in the future

The H1 chart shows a more detailed structure of the current descending wave. The pair is approaching 23.6% fibo and may break it to continue falling towards 38.2% fibo at 1.2175. This scenario is confirmed by the downward dynamics of the MACD lines.

GBPUSD_H1
Risk Warning: the result of previous trading operations do not guarantee the same results in the future

EURJPY, “Euro vs. Japanese Yen”

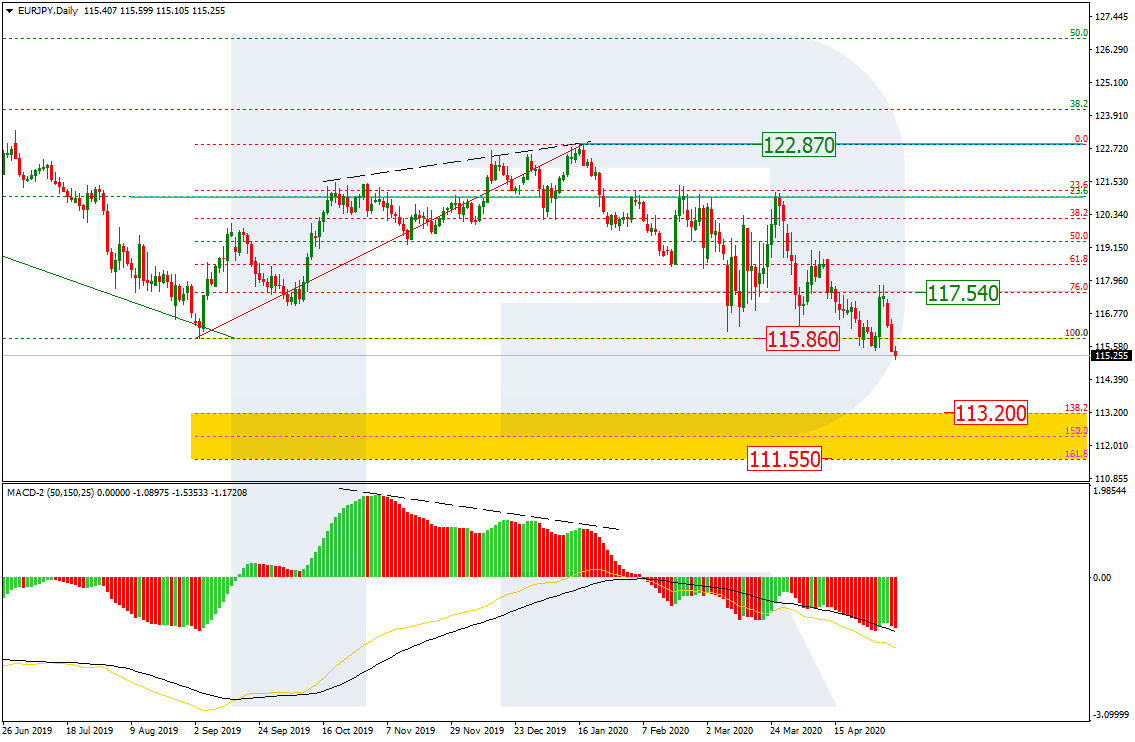
As we can see in the daily chart, after breaking the previous low at 115.86, EURJPY has managed to fix below it. In the future, the pair may continue falling towards the post-correctional extension area between 138.2% and 161.8% fibo at 113.20 and 111.54 respectively. the current resistance is at 76.0% fibo (117.54).

EURJPY_D1
Risk Warning: the result of previous trading operations do not guarantee the same results in the future

In the H4 chart, after finishing the short-term pullback, the pair is forming a new descending wave. One should pay attention that the current descending tendency is rather slow. At the same time, there might be a convergence on MACD to indicate a new correction soon to reach 76.0% fibo at 117.54.

EURJPY_H4

Article By RoboForex.com

Attention!
Forecasts presented in this section only reflect the author’s private opinion and should not be considered as guidance for trading. RoboForex LP bears no responsibility for trading results based on trading recommendations described in these analytical reviews.

WTI Crude Completes Double Bottom Target

By Orbex

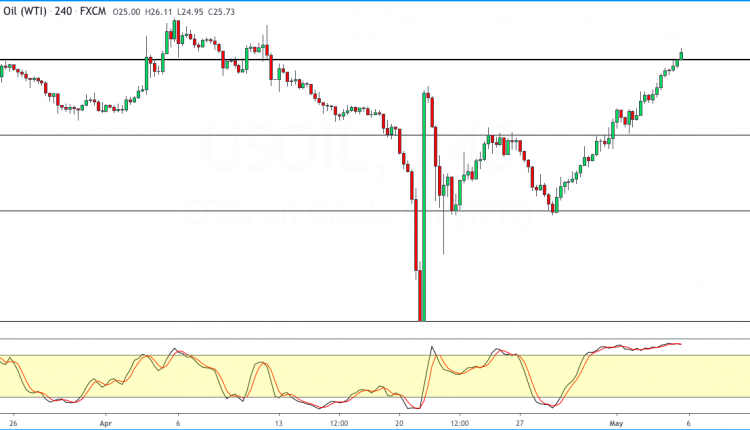
WTI crude oil prices are up for the fifth consecutive session. As a result, the rally in oil prices saw them trading near the 25.00 level.

This marks the completion of the double bottom pattern after a successful rebound.

With prices now at the level of 25.00, we could expect a pullback. This can also be seen from the bearish divergence on the Stochastics oscillator.

Therefore, watch for a strong bearish close near 25.00.

This will see the previous resistance level of 17.80 being tested for support.

By Orbex


The Single Currency Has Fallen due to Accusations of the German Federal Court of Justice

by JustForex

The US dollar continues to grow against a basket of major currencies. The US dollar index (#DX) has updated local highs and closed in the positive zone (+0.20%). US Deputy National Security Advisor Matthew Pottinger has tried to ease the tension between the US and China. The official says that the United States is not going to apply “punitive measures” against China in the context of combat with the epidemic, taking a more peaceful position.

The single currency is under pressure after the German Federal Court of Justice accused the ECB of having exceeded its authority by launching a quantitative easing program in 2015. Now the ECB should prove the validity of the bond-buying program. Otherwise, the Bundesbank will stop participating in a program to rebuild economies that have suffered from the coronavirus pandemic.

Today, during the Asian trading session, optimistic economic data from New Zealand and Australia have been published. Thus, the level of employment in the 1st quarter (q/q) increased by 0.7%, while experts expected a decline by 0.3%. Australia’s retail sales rose by 8.5% instead of a forecasted growth by 8.2%.

The “black gold” prices continue to recover. Currently, futures for the WTI crude oil are testing the $25.40 mark per barrel. At 17:30 (GMT+3:00), US crude oil inventories will be published.

Market indicators

Yesterday, there was the bullish sentiment in the US stock market: #SPY (+0.92%), #DIA (+0.58%), #QQQ (+1.13%).

The 10-year US government bonds yield has grown again. At the moment, the indicator is at the level of 0.67-0.68%.

The news feed on 2020.05.06:
  • – UK construction PMI at 11:30 (GMT+3:00);
  • – ADP nonfarm employment change at 15:15 (GMT+3:00).

by JustForex