Oil, Hertz, Airlines, USDTRY and EURTRY lead the Weekly Top Gainers/Losers

By IFCMarkets

Top Gainers – The World Market

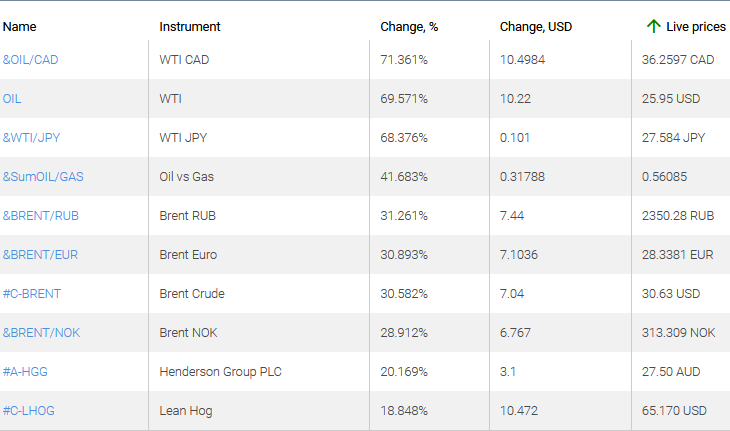
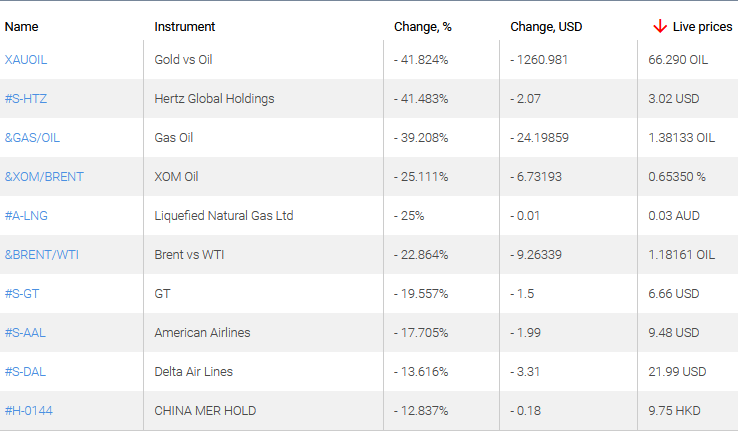
The world oil prices continued to increase for the 2nd week in a row. Since May 1, OPEC + countries have limited production by 10 million barrels per day. Some US shale companies joined them. A number of countries have reported a mitigation of quarantine requirements in the wake of the coronavirus pandemic from May 11-12. All this contributed to an increase in oil demand. Accordingly, oil and trading instruments based on it became the top gainers and losers. Amidst the risks of another escalation of the USA-China trade war, the yen and the Swiss franc strengthened as heaven currencies.

1. &OIL/CAD – a personal composite instrument West Texas Intermediate (WTI) oil against the Canadian dollar.

2. OIL – American Light Sweet Crude Oil West Texas Intermediate (WTI).
market sentiment ratio long short positions

 Top Losers – The World Market

1. Hertz Global Holdings, Inc. – an American car rental company.

2. XAUOIL – a gold instrument Gold against WTI oil.
market sentiment ratio long short positions

 Top Gainers – Foreign Exchange Market (Forex)

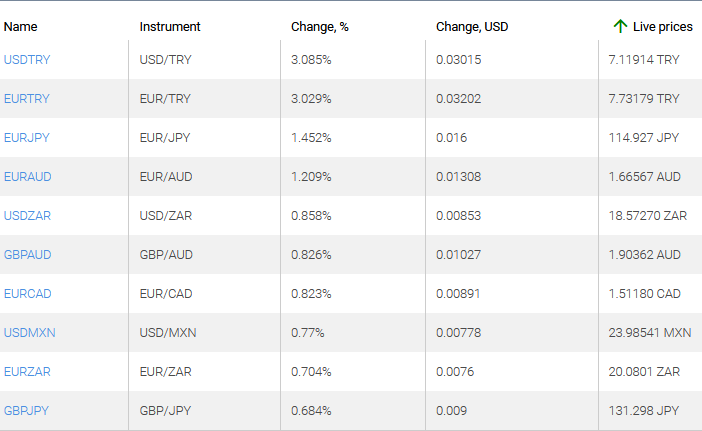
1. USDTRY, EURTRY – the growth of these charts means the strengthening of the US dollar and the euro against the Turkish lira.

2. EURJPY, EURAUD – the growth of these charts means the weakening of the Japanese yen and the Australian dollar against the euro.
market sentiment ratio long short positions

 Top Losers – Foreign Exchange Market (Forex)

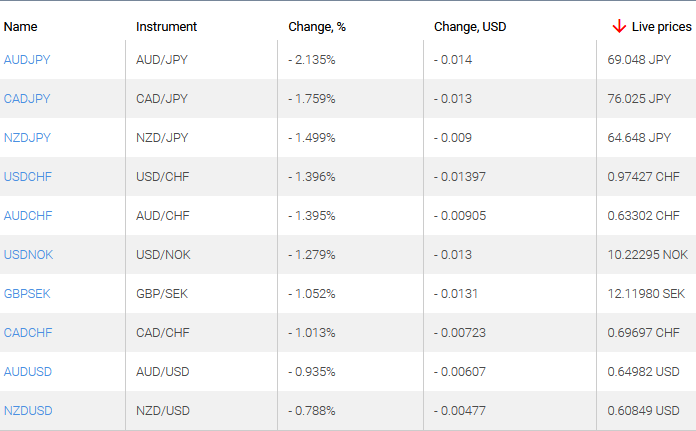
1. AUDJPY, CADJPY – the fall of these charts means the strengthening of the Japanese yen against the Australian and Canadian dollars.

2. USDCHF, AUDCHF – the fall of these charts means the weakening of the American and Australian dollars against the Swiss franc.
market sentiment ratio long short positions

Market Analysis provided by IFCMarkets

Note:
This overview has an informative and tutorial character and is published for free. All the data, included in the overview, are received from public sources, recognized as more or less reliable. Moreover, there is no guarantee that the indicated information is full and precise. Overviews are not updated. The whole information in each overview, including opinion, indicators, charts and anything else, is provided only for familiarization purposes and is not financial advice or а recommendation. The whole text and its any part, as well as the charts cannot be considered as an offer to make a deal with any asset. IFC Markets and its employees under any circumstances are not liable for any action taken by someone else during or after reading the overview.

Forex Technical Analysis & Forecast 08.05.2020

Article By RoboForex.com

EURUSD, “Euro vs US Dollar”

After expanding the consolidation range down to 1.0766, thus finishing this descending wave, EURUSD has completed a new ascending impulse at 1.0853. Possibly, today the pair may start a new correction towards 1.0810 and then form another ascending impulse with the short-term target at 1.0880.

EURUSD
Risk Warning: the result of previous trading operations do not guarantee the same results in the future

GBPUSD, “Great Britain Pound vs US Dollar”

After completing the descending wave at 1.2266, GBPUSD has finished the ascending impulse towards 1.2400. Today, the pair may correct this impulse and reach 1.2333. Later, the market may form the second ascending impulse with the short-term target at 1.2448.

GBPUSD
Risk Warning: the result of previous trading operations do not guarantee the same results in the future

USDRUB, “US Dollar vs Russian Ruble”

After finishing the descending structure at 73.63, USDRUB is expected to consolidate around this level. If later the price breaks this range to the downside, the market may resume trading downwards with the short-term target at 72.50; if to the upside – form one more ascending structure towards 74.00 and then continue the downtrend with the target at 71.30.

USDRUB
Risk Warning: the result of previous trading operations do not guarantee the same results in the future

USDJPY, “US Dollar vs Japanese Yen”

After finishing the ascending impulse at 106.60, USDJPY is consolidating around 106.40. Possibly, the pair may expand the range down to 106.15 and then return to 106.40. If later the price breaks this range to the downside, the market may resume trading inside the downtrend with the target at 105.50; if to the upside – continue the correction to reach 106.80.

USDJPY
Risk Warning: the result of previous trading operations do not guarantee the same results in the future

USDCHF, “US Dollar vs Swiss Franc”

After expanding the range up to 0.9783, USDCHF has finished the descending impulse at 0.9715. Today, the pair may grow towards 0.9750 and then form the second descending impulse with the target at 0.9660.

USDCHF
Risk Warning: the result of previous trading operations do not guarantee the same results in the future

AUDUSD, “Australian Dollar vs US Dollar”

After forming another consolidation range around 0.6455 and breaking it to the upside, AUDUSD has reached 0.6533; right now, it is consolidating close to these highs. According to the main scenario, the price is expected to break the range to the downside and resume falling with the target at 0.6455.

AUDUSD
Risk Warning: the result of previous trading operations do not guarantee the same results in the future

BRENT

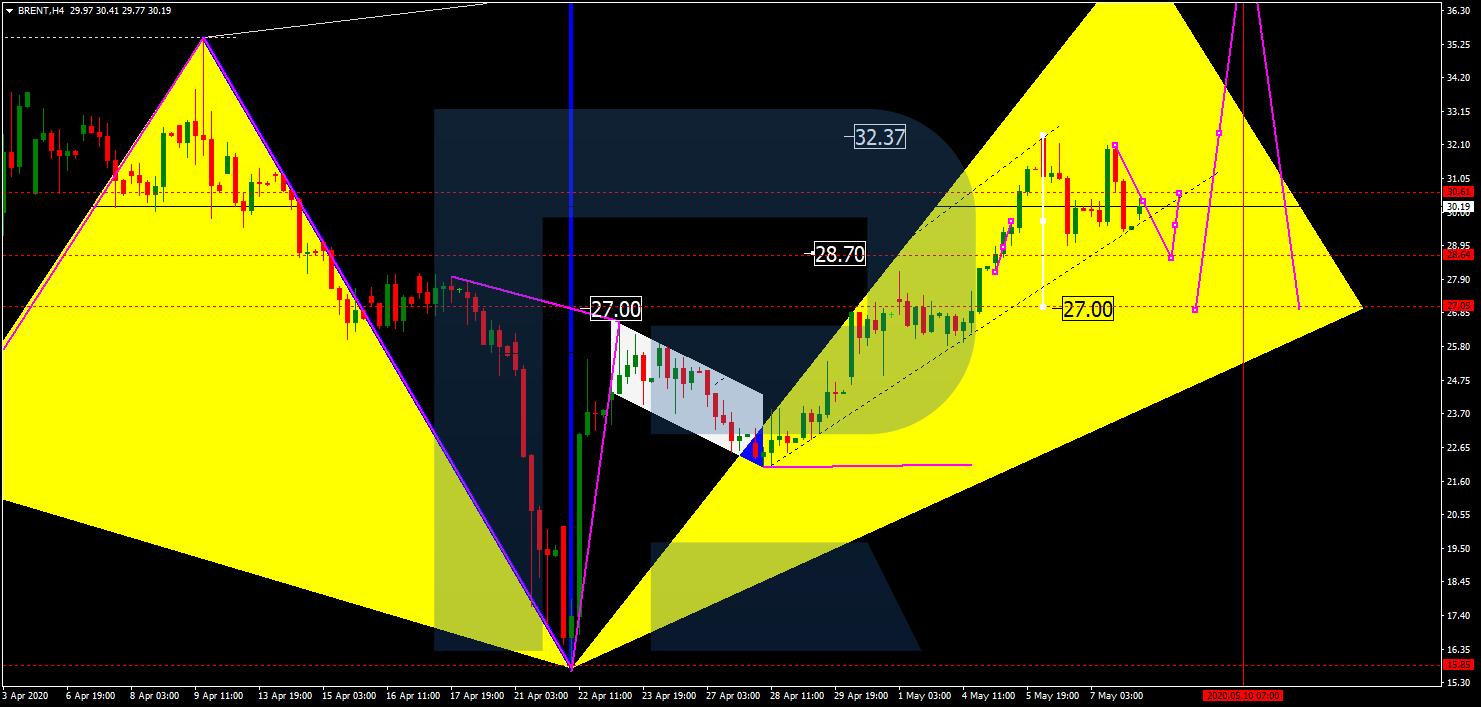
Brent is still consolidating around 30.00. The main scenario implies that the price may expand the range down to 28.70 and then return to 30.00. If later the price breaks this range to the downside, the market may resume trading downwards with the target at 27.00; if to the upside – form one more ascending structure towards 38.20.

BRENT
Risk Warning: the result of previous trading operations do not guarantee the same results in the future

XAUUSD, “Gold vs US Dollar”

After breaking 1700.00 and reaching the target of the third wave at 1721.90, Gold is consolidating below this level. Possibly, the pair may correct to return to 1700.00 and test it from above. After that, the instrument may start another growth with the target at 1755.55.

GOLD
Risk Warning: the result of previous trading operations do not guarantee the same results in the future

BTCUSD, “Bitcoin vs US Dollar”

After reaching its upside target at 10000.00, BTCUSD is consolidating above it. Today, the pair may correct to the downside and reach 9500.00. After that, the instrument may resume trading upwards with the target at 9750.00.

BITCOIN
Risk Warning: the result of previous trading operations do not guarantee the same results in the future

S&P 500

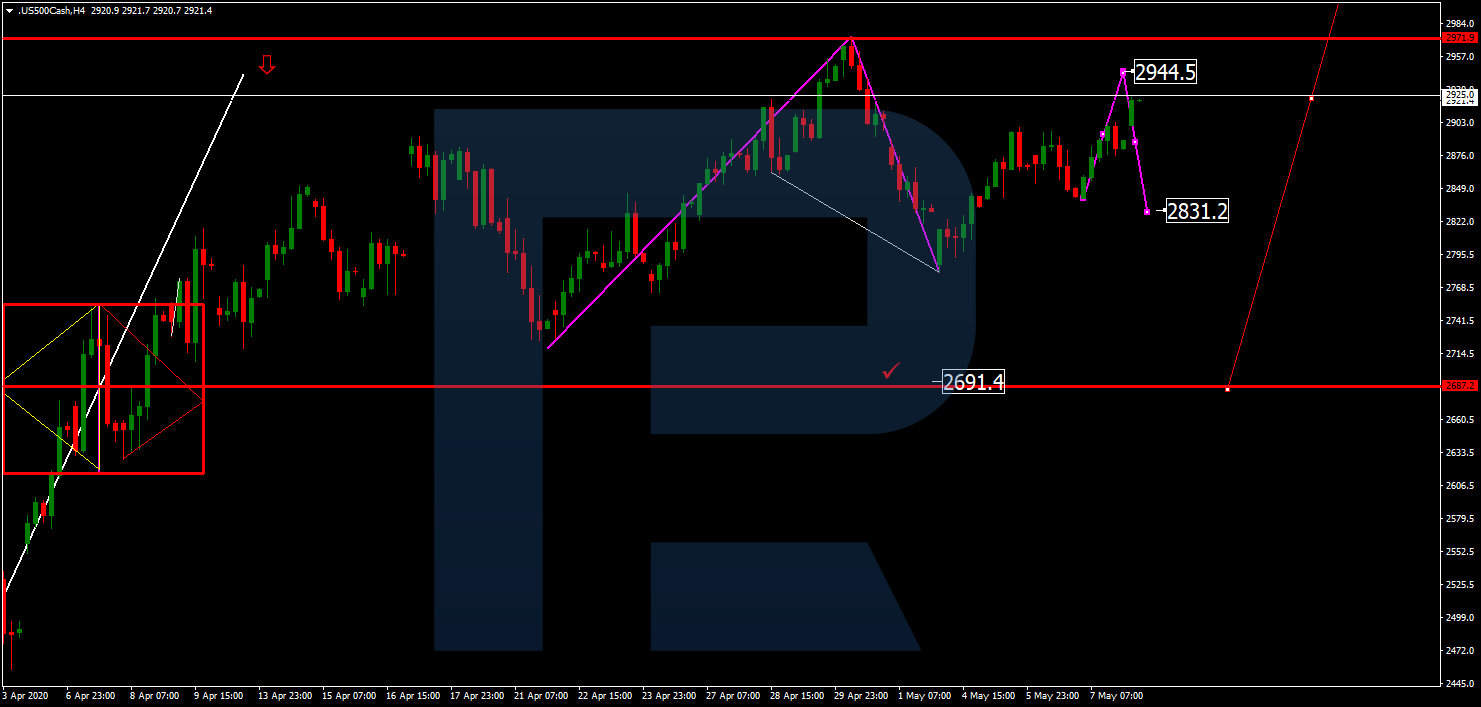
The Index continues trading upwards; it has broken the consolidation range to the upside. Possibly, today the pair may reach 2944.2 and then start the second descending impulse towards 2830.5, thus forming a new consolidation range between these two levels. If later the price breaks this range to the upside, the market may resume trading upwards with the target at 3160.2; if to the downside – continue the correction towards 2691.4.

S&P 500

Article By RoboForex.com

Attention!
Forecasts presented in this section only reflect the author’s private opinion and should not be considered as guidance for trading. RoboForex LP bears no responsibility for trading results based on trading recommendations described in these analytical reviews.

Fibonacci Retracements Analysis 08.05.2020 (BITCOIN, ETHEREUM)

Article By RoboForex.com

BTCUSD, “Bitcoin vs US Dollar”

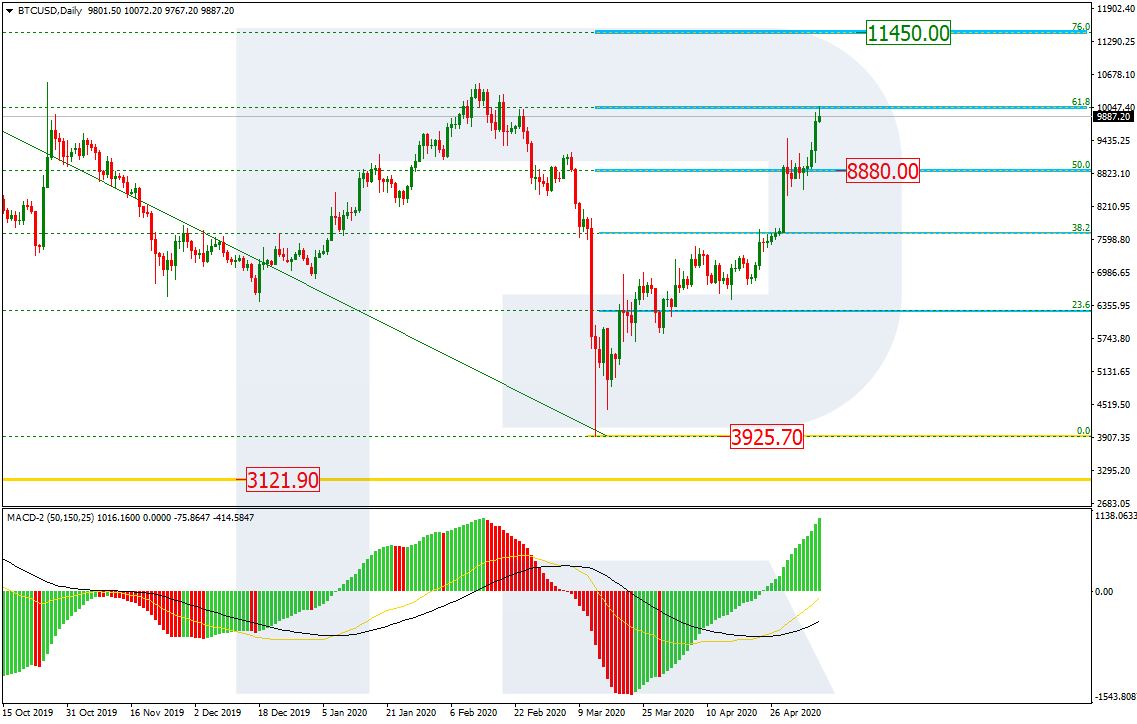
As we can see in the daily chart, the asset is correcting to the upside after completing the previous downtrend. By now, it has reached 61.8% fibo and may yet continue this rising tendency towards 76.0% fibo at 11450.00. However, the tendency may continue only after a slight pullback with the first target at 50.0% fibo at 8880.00.

BTCUSD_D1
Risk Warning: the result of previous trading operations do not guarantee the same results in the future

In the H4 chart, the uptrend has already broken mid-term 76.0% fibo and may continue moving to break the fractal high at 10505.60. At the same time, the MACD indicator is forming a divergence, which hints at a possible pullback. The support is те far from 61.8% fibo at 8000.00.

BTCUSD_H4
Risk Warning: the result of previous trading operations do not guarantee the same results in the future

ETHUSD, “Ethereum vs. US Dollar”

As we can see in the H4 chart, the divergence on MACD made the pair stop growing at 61.8% fibo and start a new correction to the downside. The downside correctional target is 38.2% fibo at 165.90. After completing the correction, ETHUSD may form one more ascending structure towards 76.0% fibo at 241.40 and then the high at 288.98.

ETHUSD_H4
Risk Warning: the result of previous trading operations do not guarantee the same results in the future

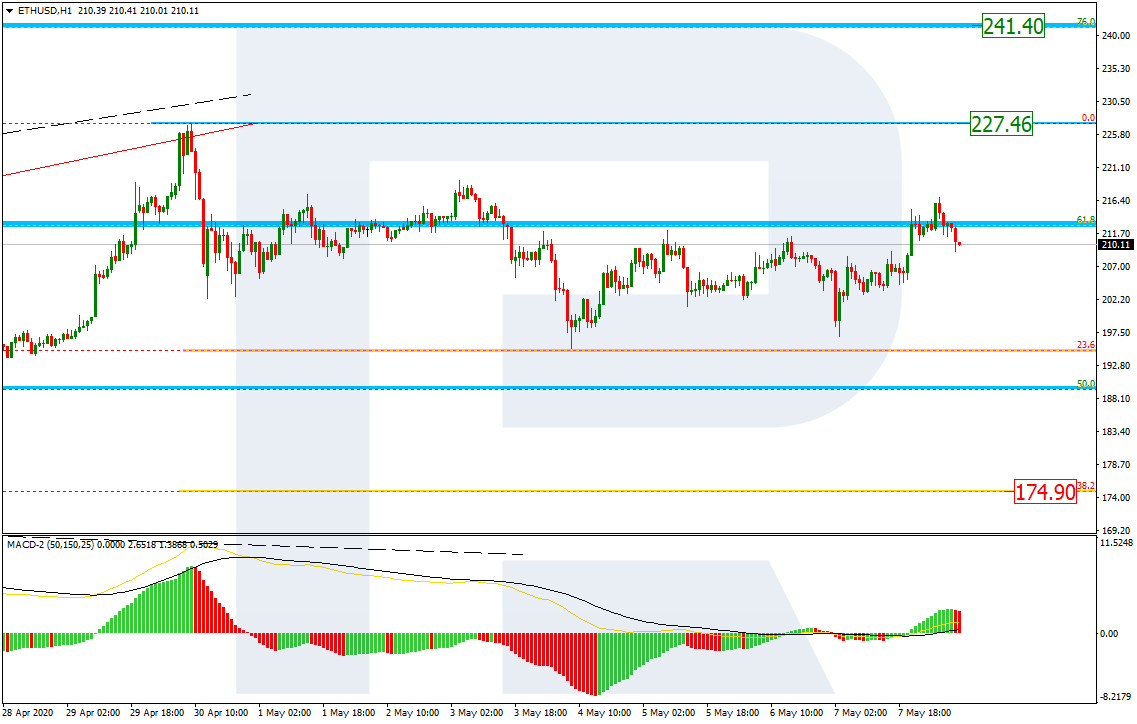
The H1 chart shows more detailed structure of the current correction. After reaching 23.6% fibo, the price has formed an internal pullback. Later, after the pullback, the pair may start a new descending wave towards 38.2% fibo at 174.90. However, if the instrument breaks the resistance at 227.46, it may resume the mid-term uptrend.

ETHUSD_H1

Article By RoboForex.com

Attention!
Forecasts presented in this section only reflect the author’s private opinion and should not be considered as guidance for trading. RoboForex LP bears no responsibility for trading results based on trading recommendations described in these analytical reviews.

Is Optimism In The Market Unrealistic?

By Orbex

Markets have a tendency to, shall we say, overreact. After all, the trick is to get in the market before it moves, causing people to pile on rumors and drive prices on rollercoaster rides.

We needn’t look further than the reaction to the COVID-19 pandemic. Stock markets around the world crashed within a couple of weeks, only to rebound by half of the drop a couple of days after touching bottom.

Of late, markets seem to be breaking into new areas of risk appetite, banking on a fast recovery from the lockdowns. It’s more than reasonable to question the sanity of the markets in general, and in this case, even more so.

In fact, there are good arguments to be had on both sides. There are even good arguments to support a third side: that markets will trend sideways for a while.

So, What’s Going On?

Let’s review what drove the stock market’s wild moves, since equities are a good guide of sentiment.

On Feb 21, analysts noticed that there was a lack of liquidity in the bond market. Businesses were drawing down on their credit facilities in anticipation of tough economic times. This is the spark that sent markets around the world tumbling.

There was almost a month of crashing markets, but what brought an end to the freefall was reversing what had caused it: central banks (led by the Fed) basically promised unlimited liquidity.

With access to funds guaranteed, markets reversed course and returned to a more “sensible” level.

Going Higher?

Central banks are providing unprecedented levels of liquidity, which is allowing investors to keep putting money into the stock market. This is the primary argument for why the market would continue its rise – even as the economy shrinks by historic measures.

No one is being forced to liquidate their positions, and many see it as a buying opportunity.

The thing is, markets can’t be too disconnected from the underlying economy. Rising stocks as companies cut dividends and suspend guidance is not sustainable. This is the argument that some analysts propose for why there could be another move down in equities.

This would be the W-shaped recovery. If the economic reports are really bad these months, it could drive the markets lower despite all the “cheap money”.

The Predictions

Arguably, the yield curve inversion once again accurately predicted a recession.

What’s it saying now, though? Well, the curve has risen substantially, showing that investors are putting their money where their mouth is, projecting a quick recovery by the end of the year.

The thing is, protracted downturns like the last one (which had a W-shape) are based on uncertainty. At the time, it wasn’t known exactly what was wrong with the market, and it was impossible to predict how long it would take to balance out.

This time the cause of the downturn is simple and clear: the need to prevent the spread of COVID-19. Which means the solution is just as simple: a vaccine or reasonable treatment becoming available. It doesn’t mean we’ll return to “normal”; just that by removing the uncertainty that keeps markets down, their natural buoyancy will reassert itself.

Is expecting a treatment/vaccine by the end of the year overoptimistic? That’s more of a medical question than a market analysis one.

By Orbex


The Analytical Overview of the Main Currency Pairs on 2020.05.08

by JustForex

The EUR/USD currency pair

Technical indicators of the currency pair:
  • Prev Open: 1.07936
  • Open: 1.08317
  • % chg. over the last day: +0.36
  • Day’s range: 1.08223 – 1.08548
  • 52 wk range: 1.0777 – 1.1494

The EUR/USD currency pair has moved away from local lows. Investors have started partially fixing greenback positions before today’s US labor market report. Experts forecast a decrease in the number of jobs in the US economy by 22.1 million in April. The unemployment rate will reach 16.0%. We recommend paying attention to the difference between the actual and forecasted values. At the moment, EUR/USD quotes are consolidating in the range of 1.0815-1.0855. Positions should be opened from these marks.

The Economic News Feed for 08.05.2020

  • At 15:30 (GMT+3:00), the US labor statistics for April will be published.
EUR/USD

Indicators do not give accurate signals: the price has fixed between 50 MA and 100 MA.

The MACD histogram is in the positive zone, but below the signal line, which gives a weak signal to buy EUR/USD.

Stochastic Oscillator is in the neutral zone, the %K line is below the %D line, which indicates the bearish sentiment.

Trading recommendations
  • Support levels: 1.0815, 1.0775, 1.0750
  • Resistance levels: 1.0855, 1.0885, 1.0925

If the price fixes above 1.0855, further recovery of the EUR/USD currency pair is expected. The movement is tending to 1.0885-1.0925.

An alternative could be a drop in EUR/USD quotes to 1.0780-1.0750.

The GBP/USD currency pair

Technical indicators of the currency pair:
  • Prev Open: 1.23364
  • Open: 1.23508
  • % chg. over the last day: +0.16
  • Day’s range: 1.23498 – 1.24086
  • 52 wk range: 1.1466 – 1.3516

There is an ambiguous technical pattern on the GBP/USD currency pair. The British pound is consolidating. Financial market participants have taken a wait-and-see attitude before today’s report on the US labor market. At the moment, the local support and resistance levels are 1.2350 and 1.2410, respectively. It should be recalled that earlier the Bank of England kept the key marks of monetary policy at the same level. We recommend opening positions from key levels.

GBP/USD

Indicators do not give accurate signals: the price has fixed between 50 MA and 100 MA.

The MACD histogram has moved into the positive zone, indicating the bullish sentiment.

Stochastic Oscillator is in the neutral zone, the %K line is below the %D line, which gives a signal to sell GBP/USD.

Trading recommendations
  • Support levels: 1.2350, 1.2310, 1.2270
  • Resistance levels: 1.2410, 1.2445, 1.2485

If the price fixes above 1.2410, GBP/USD quotes are expected to rise. The movement is tending to 1.2450-1.2490.

An alternative would be a decrease in the GBP/USD currency pair to 1.2310-1.2260.

The USD/CAD currency pair

Technical indicators of the currency pair:
  • Prev Open: 1.41433
  • Open: 1.39758
  • % chg. over the last day: -1.23
  • Day’s range: 1.39250 – 1.39891
  • 52 wk range: 1.2949 – 1.4668

There are aggressive sales on the USD/CAD currency pair. During yesterday’s and today’s trading sessions, the drop in quotes exceeded 200 points. The trading instrument has set new local lows. The loonie is supported by price recovery in the “black gold” market. At the moment, the USD/CAD currency pair is consolidating in the range of 1.3925-1.3975. Investors expect important economic reports from the US and Canada. Positions should be opened from key levels.

At 15:30 (GMT+3:00), statistics on Canada’s labor market will be published.

USD/CAD

Indicators signal the power of sellers: the price has fixed below 100 MA.

The MACD histogram is in the negative zone, indicating the bearish sentiment.

Stochastic Oscillator is in the neutral zone, the %K line is above the %D line, which gives a signal to buy USD/CAD.

Trading recommendations
  • Support levels: 1.3925, 1.3890, 1.3850
  • Resistance levels: 1.3975, 1.4010, 1.4050

If the price fixes below the support level of 1.3925, a further drop in USD/CAD quotes is expected. The movement is tending to 1.3880-1.3850.

An alternative could be the growth of the USD/CAD currency pair to 1.4020-1.4050.

The USD/JPY currency pair

Technical indicators of the currency pair:
  • Prev Open: 106.083
  • Open: 106.275
  • % chg. over the last day: +0.12
  • Day’s range: 106.220 – 106.461
  • 52 wk range: 101.19 – 112.41

The USD/JPY currency pair is consolidating. There is no defined trend. Financial market participants expect a report on the US labor market for April. At the moment, USD/JPY quotes are testing local support and resistance levels: 106.20 and 106.45, respectively. We also recommend paying attention to the dynamics of US government bonds yield. Positions should be opened from key levels.

USD/JPY

Indicators do not give accurate signals: the price has fixed between 50 MA and 100 MA.

The MACD histogram is near the 0 mark.

Stochastic Oscillator is in the neutral zone, the %K line is below the %D line, which indicates the bearish sentiment.

Trading recommendations
  • Support levels: 106.20, 106.00
  • Resistance levels: 106.45, 106.65, 106.85

If the price fixes above 106.45, USD/JPY quotes are expected to rise. The movement is tending to 106.70-107.00.

An alternative could be a decrease in the USD/JPY currency pair to 105.80-105.60.

by JustForex

WTI Crude Oil Rebounds Off 25.00 Technical Support

By Orbex

The bullish price action in crude oil continues following a dip back to the price level of 25.00.

However, following this minor pullback, WTI crude oil prices are rising higher once again.

If prices do not post any meaningful highs above 25.00, we could expect to see a retracement.

This would mean that the 25.00 level will be the price of interest.

A close below this level will signal a move lower to the 17.80 level which will be the most likely price level for support to form.

By Orbex


Investors Have Started Fixing Positions on the Greenback. US Labor Market Report Is in the Spotlight

by JustForex

The American currency has been declining. The US dollar index (#DX) closed in the negative zone (-0.23%) yesterday. Financial market participants have started partially fixing positions on the US dollar before today’s labor market report. Experts forecast a decrease in the number of jobs in the US economy by 22.1 million in April. The unemployment rate will reach 16.0%. We recommend paying attention to the difference between the actual and forecasted values.

Yesterday, the Bank of England meeting took place, during which the key interest rate was not changed and remained at the level of 0.10%. According to the regulator, the UK economy expects the largest recession in 300 years due to the COVID-19 pandemic. The Bank of England predicts a sharp decline in GDP this year. According to forecasts, the economy will decline by 30% in the first six months of 2020. Economic recovery is expected no earlier than mid-2021. The crisis caused by the pandemic also affects the growth in unemployment. As reported by the Bank of England, this indicator will more than double and exceed 9% in 2020.

The “black gold” prices continue to recover in the hope of rising demand after more and more countries announce quarantine easing. Currently, futures for the WTI crude oil are testing the $24.15 mark per barrel.

Market indicators

Yesterday, there was the bullish sentiment in the US stock market: #SPY (+1.21%), #DIA (+0.87%), #QQQ (+1.29%).

The 10-year US government bonds yield has risen again. At the moment, the indicator is at the level of 0.70-0.71%.

The news feed on 2020.05.08:
  • – Statistics on the US labor market at 15:30 (GMT+3:00);
  • – Employment change in Canada at 15:30 (GMT+3:00).

by JustForex

Equities on the rise after US-China negotiators talk

By IFCMarkets

Top daily news

Global equities’ advance continues today after US Trade Representative Lighthizer, Treasury Secretary Mnuchin and China’s Vice Premier Liu He agreed in a phone call to strengthen macroeconomic and public health cooperation. Investors are awaiting for US jobs report today – expected to show unemployment jumped to 15.2% from a 50-year low of only 3.5% two months ago after US Labor department report showed over 33 million Americans have lost their jobs in the last seven weeks.

Forex news

Currency PairChange
EUR USD-0.18%
GBP USD-0.48%
USD JPY-0.8%
AUD USD+1.32%
The Dollar weakening continues today ahead of April jobs report. The live dollar index data show the ICE US Dollar index, a measure of the dollar’s strength against a basket of six rival currencies, fell 0.3% Thursday after report initial jobless claims jumped another 3.2 million last week. Both GBP/USD and EUR/USD reversed sliding yesterday with both pairs lower currently. Pound got a support from Bank of England decision keeping interest rates steady at 0.1% and asset purchases at £645 billion. Both USD/JPY and AUD/USD reversed sliding and are higher currently.

Stock Market news

IndicesChange
Dow Jones Index+0.23%
Nikkei Index+0.55%
Hang Seng Index+0.23%
Australian Stock Index+0.32%
Futures on three main US stock indexes are higher currently after a surge Thursday. Earnings season continues with another batch of companies including Siemens, Mitsubishi and ING reporting quarterly results today. Stock indexes in US ended solidly higher on Thursday led by technology shares: the three main US stock indexes recorded gains ranging from 0.9% to 1.4%. European stock indexes are rising today after ending higher Thursday led by retail stocks. Asian indexes are higher today after China’s commerce ministry stated US and China agreed to work together to implement the Phase One trade agreement signed earlier this year: NIKKEI jumped 2.5%while Shanghai Composite added 0.8%.

Commodity Market news

CommoditiesChange
Brent Crude Oil+2.55%
WTI Crude+4.49%
Brent is retracing higher today after retreat on Thursday. Oil prices gave back earlier gains prompted by reports Saudi Arabia, the most influential member of the Organization of Petroleum Exporting Countries, is raising crude prices for its customers world-wide. However the US oil benchmark West Texas Intermediate (WTI) futures ended lower yesterday: June WTI lost 1.8% but is sharply higher currently. July Brent crude closed 0.9% lower at $29.46 a barrel on Thursday.

Gold Market News

MetalsChange
Gold+0.06%
Gold prices advance is intact today. June gold rose 2.2% to $1725.80 an ounce on Thursday.

Market Analysis provided by IFCMarkets

Note:
This overview has an informative and tutorial character and is published for free. All the data, included in the overview, are received from public sources, recognized as more or less reliable. Moreover, there is no guarantee that the indicated information is full and precise. Overviews are not updated. The whole information in each overview, including opinion, indicators, charts and anything else, is provided only for familiarization purposes and is not financial advice or а recommendation. The whole text and its any part, as well as the charts cannot be considered as an offer to make a deal with any asset. IFC Markets and its employees under any circumstances are not liable for any action taken by someone else during or after reading the overview.

GBPUSD Completes The Head And Shoulder Target

By Orbex

The British pound completed the downside target of the head and shoulders pattern.

Price briefly tested the lower range level of 1.2277 before pulling back slightly.

We expect a more firm test of this level in the near term. The overall consolidation, however, is putting pressure on the downside.

Therefore, in the event that prices breakdown below this level, we could expect strong moves lower.

To the upside, the recently breached neckline support at 1.2423 will be testing for resistance once again.

By Orbex


After a horrific ADP: will NFP’s push the USD/JPY towards 105.00?

By Admiral Markets

Source: Economic Events May 8, 2020 – Admiral Markets’ Forex Calendar

On Friday, the eyes of traders around the world will be certainly on the Non-Farm Payrolls or NFP’s.

That is particularly true, as after Wednesday’s ADP data showed that private businesses in the US fired 20.2 million workers in April due to the Corona lockdown, but only slightly above market expectations at 20 million.

It was the biggest decline ever, and since ADP is usually a good indication for the Non-Farm Payrolls, it is certainly fair to assume that the market consensus at -21.5 million is probably not that far off.

Not surprisingly, the USD/JPY has already taken on bearish momentum, heading for a test of the region around 106.00 over the last days since it underlines one aspect of the last Fed statement and the willingness of the Fed to take further monetary action in a worsening economic situation.

While we certainly don’t know how much of such a worsening economic situation was already priced into the Fed assumptions, it seems certainly fair to assume we should expect further monetary stimulus from the US central bank with ongoing bad economic projections, especially from the US labour market, putting further pressure on US yields, making a rather sooner than later a test of the region around 105.00 likely and even a drop lower.

Technically the picture only brightens slightly, if the currency par recaptures 107.80/108.00:

Source: Admiral Markets MT5 with MT5-SE Add-on USD/JPY Daily chart (between March 15, 2019, to May 7, 2020). Accessed: May 7, 2020, at 10:00pm GMT – Please note: Past performance is not a reliable indicator of future results, or future performance

In 2015, the value of the USD/JPY increased by 0.5%, in 2016, it fell by 2.8%, in 2017, it fell by 3.6%, in 2018, it fell by 2.7%, in 2019, it fell by 0.85%, meaning that after five years, it was down by 9.2%.

Discover the world’s #1 multi-asset platform

Admiral Markets offers professional traders the ability to trade with a custom, upgraded version of MetaTrader 5, allowing you to experience trading at a significantly higher, more rewarding level. Experience benefits such as the addition of the Market Heat Map, so you can compare various currency pairs to see which ones might be lucrative investments, access real-time trading data, and so much more. Click the banner below to start your FREE download of MT5 Supreme Edition!

Download MetaTrader 5 and begin trading today!

Disclaimer: The given data provides additional information regarding all analysis, estimates, prognosis, forecasts or other similar assessments or information (hereinafter “Analysis”) published on the website of Admiral Markets. Before making any investment decisions please pay close attention to the following:

  1. This is a marketing communication. The analysis is published for informative purposes only and are in no way to be construed as investment advice or recommendation. It has not been prepared in accordance with legal requirements designed to promote the independence of investment research, and that it is not subject to any prohibition on dealing ahead of the dissemination of investment research.
  2. Any investment decision is made by each client alone whereas Admiral Markets shall not be responsible for any loss or damage arising from any such decision, whether or not based on the Analysis.
  3. Each of the Analysis is prepared by an independent analyst (Jens Klatt, Professional Trader and Analyst, hereinafter “Author”) based on the Author’s personal estimations.
  4. To ensure that the interests of the clients would be protected and objectivity of the Analysis would not be damaged Admiral Markets has established relevant internal procedures for prevention and management of conflicts of interest.
  5. Whilst every reasonable effort is taken to ensure that all sources of the Analysis are reliable and that all information is presented, as much as possible, in an understandable, timely, precise and complete manner, Admiral Markets does not guarantee the accuracy or completeness of any information contained within the Analysis. The presented figures refer that refer to any past performance is not a reliable indicator of future results.
  6. The contents of the Analysis should not be construed as an express or implied promise, guarantee or implication by Admiral Markets that the client shall profit from the strategies therein or that losses in connection therewith may or shall be limited.
  7. Any kind of previous or modeled performance of financial instruments indicated within the Publication should not be construed as an express or implied promise, guarantee or implication by Admiral Markets for any future performance. The value of the financial instrument may both increase and decrease and the preservation of the asset value is not guaranteed.
  8. The projections included in the Analysis may be subject to additional fees, taxes or other charges, depending on the subject of the Publication. The price list applicable to the services provided by Admiral Markets is publicly available from the website of Admiral Markets.

Leveraged products (including contracts for difference) are speculative in nature and may result in losses or profit. Before you start trading, you should make sure that you understand all the risks

By Admiral Markets