NASDAQ Sets Up A Massive Head-n-Shoulders

By TheTechnicalTraders 

– Our research team has identified a potential trade setup in QID that correlates to our ongoing analysis of the US stock market and our Advanced Fibonacci Price Amplitude Arcs.  We believe a major price inflection point is setting up in the US stock market within the next 48 hours that may prompt a price trend reversal in the NASDAQ and other major US stock market indexes.  This pattern correlates to a much longer-term Head-n-Shoulders pattern that is also setting up in the SPY.

Our belief is that technical traders should wait for confirmation of this setup before entering any new trades, yet we believe we will have confirmation of this setup within 3 to 5 trading days – given the urgency of the setup with our Fibonacci Price Amplitude Arcs.  We believe a right-shoulder could be forming as the US stock markets push a bit higher in early trading this week. We believe the Fibonacci Price Acr’s are suggesting a major inflection point is preparing to disrupt price trends.

Just to be clear, this is a prediction, and as technical traders, we wait for confirmation before trading. This is the #1 issue with most traders. They jump the gun and buy into a trade idea before the price chart has confirmed and they lose a lot of money. Follow price, don’ try to lead it.

If our analysis is correct, we may see a fairly strong trend reversal over the next 5+ trading days as this pattern/setup complete and confirm.

Before you continue, be sure to opt-in to our free-market trend signals
before leaving this page, so you don’t miss our next special report & signal!

Daily QID (Inverse Nasdaq ETF) Chart

This Daily QID chart highlights the major RED Fibonacci Price Amplitude Arc that is setting up as well as the more narrow MAGENTA Arc.  Both of these arcs are aligning very close to one another.  Additionally, the RSI suggests any trend reversal to the upside could prompt a moderately large upside price trend.

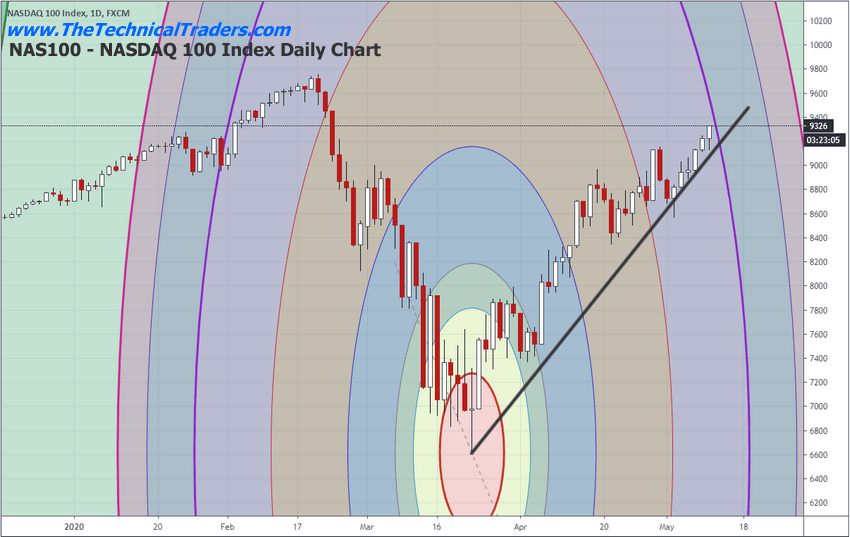
NAS100 Daily Chart

This NAS100 Daily chart highlights the right-shoulder of a longer-term price pattern that we believe may be ending soon.  If our analysis is correct, the right-side of the Head-n-Shoulders pattern may set up near the PURPLE Arc on this chart (or soon after) – prompting a broad downside price trend in the US stock market.

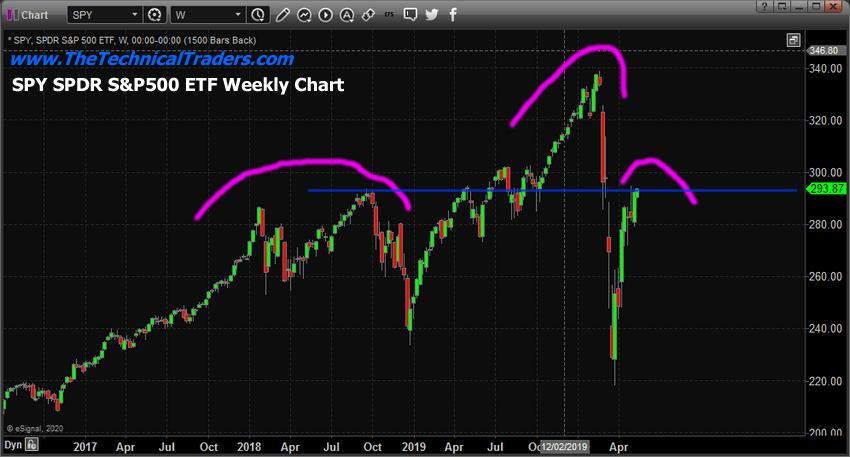
Longer-Term Weekly SPY chart

This longer-term Weekly SPY chart shows the Head-n-Shoulder setup that is forming in the SPY.  Although the right side of the shoulder is rather short and volatile, we believe this setup may be a fairly strong potential pattern warning of a stronger downside price trend that may initiate soon.  Obviously, 240 (previous lows) would be an easy objective in the SPY if this happens.

Concluding Thoughts

Current price levels suggest a resistance level has been reached.  If this resistance level persists in containing price and creates a Head-n-Shoulders pattern, there is a very strong likelihood that a broader downside price move may present real opportunities for profits.  Skilled traders should prepare for this potential and watch for confirmation of this pattern/setup.

If you are using our free public research for your own trading decision-making and/or using it as an opportunity to find and execute successful trades, please remember you are the one ultimately making the decisions to trade based on our interpretation and free research posts.  We, as technical traders, will continue to post new research articles and content that we believe is relevant to the current market setups.

If you want to improve your accuracy and opportunities for success, then we urge you to visit TheTechnicalTraders.com to learn how you can enjoy our research and our members-only trading triggers (see the first chart in this article).  If you are managing your retirement account or 401k, then we urge you to visit www.TheTechnicalInvestor.com to learn how to protect your assets and grow your wealth using our proprietary longer-term modeling systems.  Our goal is to help you find and create success – not to confuse you.

Our researchers will generate free research on just about any topic that interests them.  As technical traders, we follow price, predict future price moves, tops, bottoms, and trends, and attempt to highlight incredible setups that exist on the charts.  What you do with it is up to you.  Visit www.TheTechnicalTraders.com/FreeResearch/ to review all of our detailed free research posts.

In closing, we would like to suggest that the next 5+ years are going to be incredible opportunities for skilled traders.  Remember, we’ve already mapped out price trends 10+ years into the future that we expect based on our advanced predictive modeling tools.  If our analysis is correct, skilled traders will be able to make a small fortune trading these trends and Metals will skyrocket.  The only way you’ll know which trades to take or not is to become a member.

Chris Vermeulen
Chief Market Strategist
TheTechnicalTraders.com


Why Financial Trouble Brews on the “Home” Front

By Elliott Wave International

The world has been hearing a lot about “homes” in recent months, as in — “stay there” to help halt the spread of COVID-19.

At the same time, the sales of those homes in the U.S. have seen a significant slowdown.

No doubt about it, the coronavirus has played a big role. Yet, a notable divergence was taking shape in the housing market long before the current pandemic.

Financial history shows that it’s happened before.

Around the time of the prior housing bubble peak, the January 2006 Elliott Wave Financial Forecast, which is an Elliott Wave International monthly publication that mainly focuses on U.S. markets, the economy and cultural trends, noted:

Home sales are falling across the board now, but “virtually no investors expect sudden burst of housing bubble,” says the headline of a UBS/Gallup Poll of investor attitudes: “Just 1% of all investors expect housing prices next year to exhibit a rapid decline.” This sentiment is bearish for real estate prices.

Indeed, U.S. housing prices topped later in 2006. Lower home prices followed slowing sales.

Fast forward to this chart and commentary from the May 2020 Elliott Wave Financial Forecast:

The top graph on the chart shows the median price paid for houses sold in the U.S. … In addition to the terminal five-wave form of the rise, a key to the forecast is seen on the bottom graph. It shows the dramatic divergence in home sales, which retraced just 45% of the 2005-2010 decline.

Individual homeowners would not be the only group hurt if real estate prices fell. Also be aware of this notable factoid and comment from the August 2019 Elliott Wave Theorist:

Since 2012, private equity firms have been buying an average of 10% of the annual inventory of properties for sale in the U.S. They now own huge portfolios of homes worth hundreds of billions of dollars.

You’ve just seen the Elliott wave count of U.S. median home sale prices.

Other financial markets are also at crucial junctures, so this is an ideal time to learn how to apply the Elliott wave method yourself.

Yes, the learning process does require work, but it’s worth it.

As Elliott Wave Principle: Key to Market Behavior states:

All one really needs to know at the time is whether to be long, short or out, a decision that can sometimes be made with a swift glance at a chart and other times only after painstaking work.

If you’re ready to learn, tap into the insights of The Wave Principle Applied, which is a 1-hour course that you can access for free through May 15 by joining Club EWI (membership is also free).

Keep in mind that Elliott Wave International normally sells this course for $99, so take advantage of this limited-time opportunity to learn how to spot Elliott wave patterns on chart patterns of financial markets — 100% free.

Here’s the link that gets you started: The Wave Principle Applied.

USDJPY Analysis: The Fed’s head speech is expected on Wednesday

By IFCMarkets

The Fed’s head speech is expected on Wednesday

The upward movement means the weakening of the Japanese yen against the US dollar. The yen is included in the dollar index. Previously, the Japanese currency, along with the Swiss franc and gold, was in demand as a protective asset against the backdrop of global risks due to the Covid-19 pandemic. Several countries (France, Japan, New Zealand, Britain, and others) reported a decrease in the number of patients and the mitigation of quarantine measures. The US dollar is in good demand due to positive unemployment data for April and Non Farm Payrolls. They were better than expected. At the same time, the Japanese economic indicator Jibun Bank Composite PMI for April was worse than expected. This week important economic indicators such as Consumer Price, Retail Sales and Industrial Production will be published in the US. In Japan, Eco Watchers Survey, Machine Tool Orders, and Current Account will be released. All of this may affect the dynamics of USDJPY. On Wednesday, Jerome Powell, the head of the United States Federal Reserve, will give a speech. On Monday, the head of the Chicago Federal Reserve Bank (Chicago FRB) Charles Evans said that he does not expect negative Fed rates and a noticeable increase in inflation. Note that according to the American Commodity Futures Trading Commission (CFTC), demand for US dollars (net long) has been growing for the 7th week in a row and peaked in 2 months.

IndicatorVALUESignal
RSIBuy
MACDNeutral
MA(200)Neutral
FractalsBuy
Parabolic SARBuy
Bollinger BandsBuy


Summary of technical analysis

OrderBuy
Buy stopAbove 107.5
Stop lossBelow 105.7

Market Analysis provided by IFCMarkets

Will the clock unveil more new virus cases as restrictions ease?

By Jameel Ahmad, Global Head of Currency Strategy and Market Research at FXTM

Market volatility remains muted, however the crossroads appear to be getting closer where questions will be asked if eased restrictions are contributing to new outbreaks of disease infections.

Both Germany and South Korea have each noted new infections of the coronavirus after lockdown restrictions were eased recently. A day or two of spikes higher in new cases will likely not set investor alarms buzzing right away, however it is a concerning signal and puts once again into question that some officials are arguably moving too fast to reopen based on what damage the fight against the coronavirus is doing to the world economy.

Should these concerns accelerate and more infections get announced from nations that have eased restrictions in recent weeks, the trends noted here regarding the Yen risk a short expiry date.

It is possible that another wave of potential risk aversion leads to weakness in stock markets, and could put on the table increases in USD, JPY and Gold as a result of improved safe haven demand.

Disclaimer: The content in this article comprises personal opinions and should not be construed as containing personal and/or other investment advice and/or an offer of and/or solicitation for any transactions in financial instruments and/or a guarantee and/or prediction of future performance. ForexTime (FXTM), its affiliates, agents, directors, officers or employees do not guarantee the accuracy, validity, timeliness or completeness, of any information or data made available and assume no liability as to any loss arising from any investment based on the same.


Forex-Time-LogoArticle by ForexTime

ForexTime Ltd (FXTM) is an award winning international online forex broker regulated by CySEC 185/12 www.forextime.com

Markets lower after mixed session as lockdown easing continues

By IFCMarkets

Top daily news

Global equities are mixed today as worries about a second wave of coronavirus cases overshadow hopes over reopening economies around the globe. Continued slide in crude oil prices also points to weakness in global demand weighing on investors’ appetite as more companies report quarterly results while providing no guidance on future earnings.

Forex news

Currency PairChange
EUR USD+0.14%
GBP USD-0.84%
USD JPY+0.32%
AUD USD+0.89%
The Dollar strengthening has stalled today ahead of the start of purchasing of corporate bond exchange-traded funds by the Federal Reserve’s new lending program today. The live dollar index data show the ICE US Dollar index, a measure of the dollar’s strength against a basket of six rival currencies, jumped 0.5% Monday. Both EUR/USD and GBP/USD reversed climbing Monday as Italy reported its industrial production fell 28.4% in March after 1% decline in prior month, when a 20% drop was expected. Euro is higher currently against the dollar while Pound lower still. USD/JPY joined AUD/USD’s continuing slide today.

Stock Market news

IndicesChange
Dow Jones Index-0.44%
Nikkei Index+1.94%
Australian Stock Index-0.41%
Futures on three main US stock indexes are edging lower currently after ending mixed Monday despite reports auto factories in Michigan reopened amid concerns new wave of cases may emerge as a growing number of states are easing lockdown restrictions. 3M, Hershey and Toyota Motor are among companies reporting quarterly results today. Stock indexes in US ended mixed on Monday: the three main US stock indexes posted returns ranging from -0.4% to +0.8% led by technology shares. Quarterly results so far point to about 13.6% fall from a year ago in aggregate earnings, the worst performance since the third quarter of 2009, according to FactSet.European stock indexes are falling mostly currently after extending losses Monday with Italy’s bigger than expected drop in industrial output in March highlighting the hefty toll of lockdown measures on euro-zone economy. Asian indexes are mostly lower today as China reported its producer price index fell 3.1% over year in April, compared with a 1.5% fall in March. Hong Kong’s Hang Seng Index is down 1.8%.

Commodity Market news

CommoditiesChange
Brent Crude Oil-0.63%
WTI Crude+0.68%
Brent is extending losses today. Oil prices declined on Monday despite news Saudi Arabia’s energy ministry directed Saudi Aramco to reduce its crude oil production by an extra voluntary 1 million barrels per day beginning in June. Kuwait and United Arab Emirates also reported voluntary cuts to their crude output by 80,000 and 100,00 barrels per day respectively in June. Organization of the Petroleum Exporting Countries and other major producers have commenced cuts equating to 9.7 million a barrel a day, about 13% of global production, on May 1 through June. The US oil benchmark West Texas Intermediate (WTI) futures fell Monday: June WTI lost 2.4% but is rising currently. July Brent crude dropped 4.3% to $29.63 a barrel.

Gold Market News

MetalsChange
Silver+0.42%
Gold prices are edging higher today. June gold lost 0.9% to $1698 an ounce on Monday.

Market Analysis provided by IFCMarkets

Note:
This overview has an informative and tutorial character and is published for free. All the data, included in the overview, are received from public sources, recognized as more or less reliable. Moreover, there is no guarantee that the indicated information is full and precise. Overviews are not updated. The whole information in each overview, including opinion, indicators, charts and anything else, is provided only for familiarization purposes and is not financial advice or а recommendation. The whole text and its any part, as well as the charts cannot be considered as an offer to make a deal with any asset. IFC Markets and its employees under any circumstances are not liable for any action taken by someone else during or after reading the overview.

Moldova leaves key rates steady amid disinflation

By CentralBankNews.info

Moldova’s central bank left its main interest rate steady at what is said was a “stimulating” level that supports lending amid continued disinflationary pressures that has allowed monetary policy to support demand and ease the consequences of the coronavirus pandemic.
The National Bank of Moldova’s (NBM) executive committee unanimously maintained the base rate at 3.25 percent along with the the rate on loans and overnight deposits at 6.25 percent and 0.25 percent, respectively.
NBM has lowered its policy rate twice this year by a total of 225 basis points, with the first cut on March 4 and then a second cut at an extraordinary meeting on March 20. On that day, it also lowered the reserve ratio on banks’ domestic liabilities by 250 basis points.
Since December 2019, when NBM cut its rate by 200 basis point, the rate has been lowered by 4.25 percentage points.
The central bank said it was continuing to monitor the macroeconomic situation caused by the Covid-19 pandemic and would maintain sufficient liquidity in the banking system without compromising its fundamental objective of price stability.
Currently, there is an increased degree of uncertainty regarding the magnitude of the crises created by the virus, the subsequent economic recovery, and the evolution of commodity and energy prices.
Inflation in Moldova eased to 5.25 percent in April from 5.9 percent in March, the fourth month in a row of deceleration from 7.5 percent in December 2019.
NBM targets inflation of 5.0 percent, plus/minus 1.5 percentage points..

www.CentralBankNews.info

Bitcoin halving highlights crypto is part of mainstream finance: deVere CEO

By George Prior

– Bitcoin’s historic halving event on Monday underscores that the “long-term future of cryptocurrencies is secure”, says the CEO and founder of one of the world’s largest independent financial advisory organizations.

The comments from deVere Group’s Nigel Green come as the world’s supply of Bitcoin was forever slashed on Monday. The highly anticipated halving event, occurring only every four years, means that less and less Bitcoin – which is limited to 21 million units – wiil now been mined.

Monday’s was only the third ever halving. In 2012, the number of new Bitcoins issued every 10 minutes fell from 50 to 25. In 2016, it went down from 25 to 12.5. Now, in the 2020 halving, it will drop from 12.5 to 6.25.

The halving happened on block 630,000.

Nigel Green says: “The historic Bitcoin halving event has demonstrated in two ways that digital assets’ long-term future is secure.

“First, the price had been rising steadily ahead of the highly anticipated event – almost three-fold in the last three months – and then dropped back just before and after it took place.

“This shows that there has been increasing retail demand for Bitcoin as investors see and understand the growing influence and huge opportunities of digital currencies in an increasingly tech-driven world.

“With this in mind, large cryptocurrency investors, known as ‘whales’, accumulate crypto at much lower prices then start a sell-off to capitalize on this sustained growing demand.”

He continues: “Second, history teaches us that after this post-halving drop in price, there is a subsequent bull run.

“Previous Bitcoin halving events have prompted impressive price climbs. The 2016 halving triggered a 300% jump in the value of Bitcoin.

“There is no reason to believe this time the market will not respond with a longer-term upward trajectory.

“Indeed, the rally which is likely on its way could potentially be even more dramatic because there is more mass awareness than ever before of the long-term use of and need for digital currencies.”

The deVere CEO adds that in these unusual times, central banks have increased monetary supply and this will further drive prices of cryptocurrencies such as Bitcoin.

“Traditional currencies are devalued and inflation fears rise on the back of the mass printing of money, the likes of which we have recently seen in the U.S., where the nation’s central bank has added trillions of dollars to the money supply,” he says.

“Such measures will inevitably encourage even more investors to consider decentralised, non-sovereign digital currencies.”

Mr Green concludes: “Looking ahead beyond the halving event, cryptocurrencies are increasingly becoming regarded as the future of money due to the real-world issues they address and growing mass adoption.”

About:

deVere Group is one of the world’s largest independent advisors of specialist global financial solutions to international, local mass affluent, and high-net-worth clients.  It has a network of more than 70 offices across the world, over 80,000 clients and $12bn under advisement.


Inflation, Deflation, or Both?

By Money Metals News Service

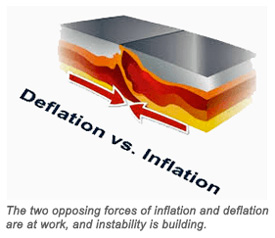
The forces of deflation and inflation continue to tug at the economy simultaneously.

The pressures on both sides are huge.

On the deflation side, jobs, industrial demand, and the small business lifeblood of communities are contracting at an unprecedented pace. Meanwhile, trillions in credit card, auto, student loan, and mortgage debt that props up consumer spending and home values is at risk of imploding – and bringing markets down with it.

Deflation vs. Inflation

On the inflation side, the Federal Reserve is pumping more than $6 trillion into the financial system.

Meanwhile, all pretenses of needing to be fiscally responsible are being discarded in Washington as Congress pushes stimulus after stimulus with money it doesn’t technically have.

An annual budget deficit of as much as $4 trillion in 2020 will put the U.S. squarely on “third world” financial footing. That may finally cause the world to lose confidence in the U.S. dollar and send its value reeling (and prices for the things people need to buy with dollars rising).

Ultimately, this economic crisis could lead to a hyperinflation. But probably not right away.

In the near term, the forces of sharp economic contraction and unlimited monetary expansion will continue to produce wild swings in asset markets. At the same time as prices for some assets begin to surge, others may be in free-fall.

For example, an emerging shortage of beef and other foodstuffs that people need will translate into sharply higher prices at the grocery store.

But discretionary items such as used cars – and economically sensitive investments such as shopping mall REITs and cruise line stocks – could crash in value at the same time.

There is no precedent for the current economic environment, but perhaps the most fitting term for the one we will be entering is that of stagflation.

There will be no “V” shaped economic recovery as many businesses and jobs will simply never come back – hence, the economy will stagnate at best at the same time as central planners in Washington try to pump it up with inflationary liquidity injections.

Bank of America investment strategists are now preparing their clients for a stagflationary environment similar perhaps to the late 1970s.

In a recent report, BOA forecasted surging gold prices as occurred in the late 1970s.

“Inflation hedges must be sought by asset allocators via real assets over financial assets,” according to the analysts – a bold and somewhat surprising call coming from employees of a mega bank.

We’ve already seen plenty of evidence that inflationary forces are prevailing upon precious metals, particularly in the bullion market.

Limited and diminishing supplies of coins, rounds, and bars have forced premiums to soar to elevated levels and largely remain elevated.

The shutdown of production at numerous mines around the world raises serious questions about the ability of supply to ramp up in the months ahead. That, in turn, raises the prospect of chronic disruptions in the supply chain to both retail and industrial buyers of precious metals.

We don’t yet know how quickly or to what extent industrial demand will recover in the weeks ahead. But investment demand for gold and silver figures to remain strong against this scary economic backdrop.


The Money Metals News Service provides market news and crisp commentary for investors following the precious metals markets.

Canada needs to see the U.S. and its trade motives clearly

By Blayne Haggart, Brock University

Existential crises that threaten one’s entire society have a way of forcing us to see the world as it truly is. The coronavirus pandemic is no exception. Canada, once mocked by South Park as “not even a real country anyway,” has come together in remarkable fashion. Canadians and their leaders, from every region and across the political spectrum, are all pushing in the same direction.

But while the pandemic has showcased the country’s inspiring cohesiveness, it has also revealed the tragic costs, measured in lives lost and economic opportunity squandered, of Canada’s continued adherence to a one-dimensional ideology that long ago passed its best-before date.

Since the 1990s, Canadian economic development policy has been anchored in two words: free trade. The previously widely accepted notion that countries should have an industrial policy — a strategy for encouraging strong and desirable economic growth — was cast aside in the single-minded pursuit of comprehensive trade agreements.

Economic security and prosperity, so the conventional wisdom held, was best ensured by lowering trade barriers and encouraging specialization. Production would be global, which wouldn’t pose any problems in a free-trade world.

Image by James Wheeler / Pixabay

Two flaws

There have long been two flaws in this policy. First, while Canada may be “a trading nation,” trade is merely a means to an end: securing markets for Canadian producers and ensuring Canadians’ access to foreign goods and services. At the end of the day, it’s production, not trade, that matters most for a country’s economic security and power.

Second, policy-makers failed to appreciate the extent to which the entire free-trade world was dependent on the actions and support of the United States given its global superpower status. After the Second World War, the U.S. decided to underwrite a liberal multilateral order that encouraged free trade, which it was able to reinforce in the 1990s after the end of the Cold War.

For a long while in the 1990s, Canada was able to get away with neglecting industrial policy and to imagine that free trade would be our economic salvation. This was because the world of open borders, ostensibly supported by U.S. power, hid the long-term costs of de-industrialization since we still had easy access to cheap production in other countries.

Unfortunately for Canada, that world hasn’t existed for almost 20 years. The multilateral free-trade world was only ever as resilient as the American commitment to it.

The unilateral U.S. choice of security over prosperity following the 9/11 terrorist attacks was the beginning of the end of this multilateral economic order. The unsanctioned American invasion of Iraq hastened the system’s decline, as did its open embrace of torture in contravention of international conventions and basic human decency.

Less dramatically, U.S. economic policy, under Democrats and Republicans alike, turned trade agreements from potentially win-win tariff-lowering treaties into agreements designed to lock in the American advantage on issues of the future: intellectual property, data governance and internet governance. Free trade agreements are no longer about free trade.

COVID-19 exposes the cracks

All this happened before the pandemic exposed the physical vulnerability of countries lacking guaranteed access to producers of medical equipment. The current international scramble for medical equipment is not causing the world order to collapse: it’s a symptom of an order that has been falling apart in slow motion for a long while.

Countries have been tentatively, almost unconsciously, adjusting to this reality. These include forms of what I call digital economic nationalism, in which countries, including Canada, are pursuing national industrial policies in high-tech areas like artificial intelligence and are seriously considering the regulation of global, mostly American, online platforms.

Still, tentatively is the operative word. Policy continues to be marked by a failure to think through the consequences of these long-term trends, and by the hope that U.S. President Donald Trump’s eventual departure from the Oval Office will restore the multilateral order.

It won’t, for the simple reason that there is no longer a political bipartisan consensus on Capitol Hill that this order is worth saving. The liberal, multilateral world order that has been underwritten by the United States since the end of the Second World War cannot survive this degree of instability for very long.

Canada’s free-trade obsession has put us in a bind, making us overly reliant on global supply chains. That’s a huge unforced error given that 19 years ago, 9/11 showed us just how quickly border policy can change.

The recently concluded NAFTA 2.0, officially known as the U.S.-Mexico-Canada trade agreement (USMCA), has myriad loopholes that leave Canada open to future harassment and concessions on data localization made without any analysis on their impact. It also illustrates Canada hasn’t fully comprehended how the world has transformed since 1994.

Policy-makers could well find that the USMCA, purpose-built for a world that no longer exists, severely restricts their ability to set a production-focused policy appropriate for 2020 and beyond.

Still, acknowledging reality is the first step in dealing with a crisis. The post-Second World War order is gone. Trade policy must be put in its proper place, a component — but not the entire game — of a comprehensive, government-led domestic industrial policy that involves actual, production-focused planning for a world in which the conventional wisdom of the past 70 years no longer holds.

Just signing trade agreements is no longer enough to ensure Canadian prosperity. We have to deal with the world as it is, not as we wish it would be.The Conversation

About the Author:

Blayne Haggart, Associate Professor of Political Science, Brock University

This article is republished from The Conversation under a Creative Commons license. Read the original article.


Yen flattened by eased lockdown restrictions

By Jameel Ahmad, Global Head of Currency Strategy and Market Research at FXTM

For better (economy) or for worse (health care advice) the eased lockdown restrictions that a number of nations are announcing to help economies recover from the global pandemic is still encouraging support for riskier assets. This is still a very sensitive and cautious time, resulting in a number of major asset classes including major currency pairs and gold trading in very tight ranges but traders have been provided with volatility from a weakening Japanese Yen.

The Japanese Yen, aka the ultimate best friend of traders in uncertain times has been wacked at the beginning of trading this week. I still have my own doubts on economies reopening as soon as they are and feel this market needs a fundamental charge to change direction in a meaningful way, but for the time being the trend of potential further Yen weakness can lead to opportunities in USDJPY and Yen crosses.

The USDJPY has climbed by just over 120 pips to reach its highest level since late April. Potential buyers will likely wait to see if the USDJPY can get past the gates of 108.09 before deciding if the pair can indeed continue its incline as high as perhaps 109.

(USDJPY Daily FXTM MT4)

The EURJPY has enjoyed a tear higher up the charts since the failure swing reversal candlestick emerged on 7 May. The pair has climbed close to 150 pips today alone and a push above 116.56 will be monitored to see if it is possible for EURJPY to recover as high as maybe 118.

(EURJPY Daily FXTM MT4)

The incline in GBPJPY has been more modest and less convincing with only a 60 pip move to show as progress today. It does appear that the United Kingdom remains in a fragile state with the second largest fatalities worldwide from the virus and will not be lifting lockdown as fast as peers. The situation can make it make or break for the pair and we might see gains limited in GBPJPY as a result.

To the downside, GBPJPY is a fair distance away from the 2020 lows seen a few months back and perhaps some of these support levels will come into play should Pound negativity resume.

(GBPJPY FXTM Daily MT4)

AUDJPY is in a similar position and given the sensitivity the Australian economy faces to external headwinds and world economic optimism, perhaps the small advance in AUDJPY can also potentially find limitations to 70.41.

(AUDJPY Daily FXTM MT4)

Disclaimer: The content in this article comprises personal opinions and should not be construed as containing personal and/or other investment advice and/or an offer of and/or solicitation for any transactions in financial instruments and/or a guarantee and/or prediction of future performance. ForexTime (FXTM), its affiliates, agents, directors, officers or employees do not guarantee the accuracy, validity, timeliness or completeness, of any information or data made available and assume no liability as to any loss arising from any investment based on the same.


Forex-Time-LogoArticle by ForexTime

ForexTime Ltd (FXTM) is an award winning international online forex broker regulated by CySEC 185/12 www.forextime.com