FX Swaps During a Declining Market – Are They Worth It?

By ForexNewsNow

Foreign Currency swaps were originally introduced by the World Bank back in 1981. Its main purpose was to secure loans in foreign currency at lower interest rates. Basically this is a currency exchange agreement, where parties agree to swap interest and principal payments on loans, denominated in two different currencies.

According to the definition, any amount of interest paid or received by a trader is called a Swap. Every currency on the Forex market has its own interest rate, usually determined by the Central bank. If a trader buys a higher-yielding currency and borrows a lower-yielding currency, then he or she will receive interest on daily bases. If the opposite is the case, then a market participant has to pay a swap.

If we see the definition of FX swaps here it basically means that this is the essence of carrying trades strategies, where traders are looking to borrow in lower-yielding currencies and buy higher-yielding currencies in order to receive daily swaps. For many years thousands of professional traders employed this strategy and as a result, earned a significant amount of payouts.

However, the situation has changed dramatically since the outbreak of COVID-19. As late as February 2019, the US Federal Reserve kept interest rates at 1.50% to 1.75% range, the Australian dollar, the UK Pound both yielded 0.75%, the Canadian dollar – 1.25%, New Zealand dollar – 1.00%.

At the same time, carry traders had three major funding currencies at their disposal: the European Central Bank kept rates at 0%, the Japanese Yen and Swiss Francs both had a negative -0.1% and -0.75% yields respectively.

So as we can see even as late as two months ago carry traders had plenty of options to choose from. For example, by opening and keeping long USD/JPY positions a trader could potentially earn up to 1.85% annually on swap payments. Now, this amount of interest does not sound that impressive, but here we have to keep in mind that most Forex traders use leveraged positions.

For example, suppose that a trader used $10,000 with 1:20 leverage and opened a $200,000 long USD/JPY position. From this, he or she might earn up to $3,700 per annum or approximately $308 per month. This represents a 37% annual return, considerably better payout compared to any savings accounts or dividend stock yields.

Here it might be helpful to point out that the heavy majority of brokers do not pay the exact yield difference between two currencies. The actual amount of swap might be slightly lower than that, yet still, for years traders could have earned significant payouts.

New Reality with Forex Swaps

As the COVID-19 concerns started to affect the markets, major central banks one by one started cutting rates dramatically. Nowadays all those higher-yielding currencies, USD, GBP, AUD, CAD, NZD have their interest rates between 0.1% to 0.25%. Consequently, the potential returns from carrying trades have diminished significantly. Yes, theoretically a trader with some brokers can still earn up to 0.35% annual return from holding a long AUD/JPY position, however, this is more than 5 times less return, compared to the above example.

Obviously this state of affairs might not persist for very long, maybe from next year, some central banks might consider hiking their key interest rates, and consequently, there might be more opportunities for carrying trades.

However, for now, traders have two options. Firstly they can increase their trading balances considerably. For example, instead of depositing $10,000, one can invest $50,000 and earn roughly similar returns from holding long AUD/CHF or NZD/JPY positions, as traders earned with USD/JPY before the outbreak of the COVID-19 pandemic. This might work for some people, but many traders might not be comfortable with depositing such large amounts or some of them might simply not afford to do that.

The second option is to buy higher-yielding emerging market currencies. For example, the South African Reserve Bank still keeps its key interest rate at 4.25%, Russian Ruble has a yield of 6%, the Turkish Lira – 8.75%. The main issue here is that those currencies have much higher inflation rates and most of them have a history of long term depreciation against major currencies. In fact, according to Bloomberg, some of those central banks are already cutting their rates. Therefore opening and holding short USD/RUB or EUR/ZAR positions for a long time might be riskier, than most traders are comfortable with.

In conclusion, Foreign Currency swaps are much less profitable and attractive today, then even months before, but it is up to an individual to decide if it’s worth investing in them.

By ForexNewsNow


Forex Technical Analysis & Forecast 13.05.2020

Article By RoboForex.com

EURUSD, “Euro vs US Dollar”

After extending the ascending structure towards 1.0880 and then finishing the descending impulse at 1.0850, EURUSD has formed a new consolidation range around the latter level. Possibly, the pair may break the range to the downside and then resume trading downwards with the short-term target at 1.0817.

EURUSD
Risk Warning: the result of previous trading operations do not guarantee the same results in the future

GBPUSD, “Great Britain Pound vs US Dollar”

After breaking 1.2308 to the downside, GBPUSD is still falling to reach 1.2239. After that, the instrument may correct to test 1.2308 from below and then continue trading inside the downtrend with the target at 1.2146.

GBPUSD
Risk Warning: the result of previous trading operations do not guarantee the same results in the future

USDRUB, “US Dollar vs Russian Ruble”

USDRUB is trading to break 73.00 to the downside. Possibly, the pair may form one more ascending structure towards 73.50 to test it from below. Later, the market may break the downside border of the current range and then resume trading inside the downtrend with the target at 72.22.

USDRUB
Risk Warning: the result of previous trading operations do not guarantee the same results in the future

USDJPY, “US Dollar vs Japanese Yen”

After breaking 107.34 to the downside, USDJPY is expected to reach 107.03. After that, the instrument may correct to return to 107.354 and then form a new descending structure with the first target at 106.95.

USDJPY
Risk Warning: the result of previous trading operations do not guarantee the same results in the future

USDCHF, “US Dollar vs Swiss Franc”

After extending the descending wave towards 0.9666, USDCHF has formed a new consolidation range around 0.9696. Possibly, today the pair may break the range to the upside and grow with the target at 0.9720. Later, the market may correct to return to 0.9696.

USDCHF
Risk Warning: the result of previous trading operations do not guarantee the same results in the future

AUDUSD, “Australian Dollar vs US Dollar”

After completing the first descending impulse at 0.6464, AUDUSD is consolidating around this level. According to the main scenario, the price is expected to break this range to the downside and then start another decline with the target at 0.6393.

AUDUSD
Risk Warning: the result of previous trading operations do not guarantee the same results in the future

BRENT

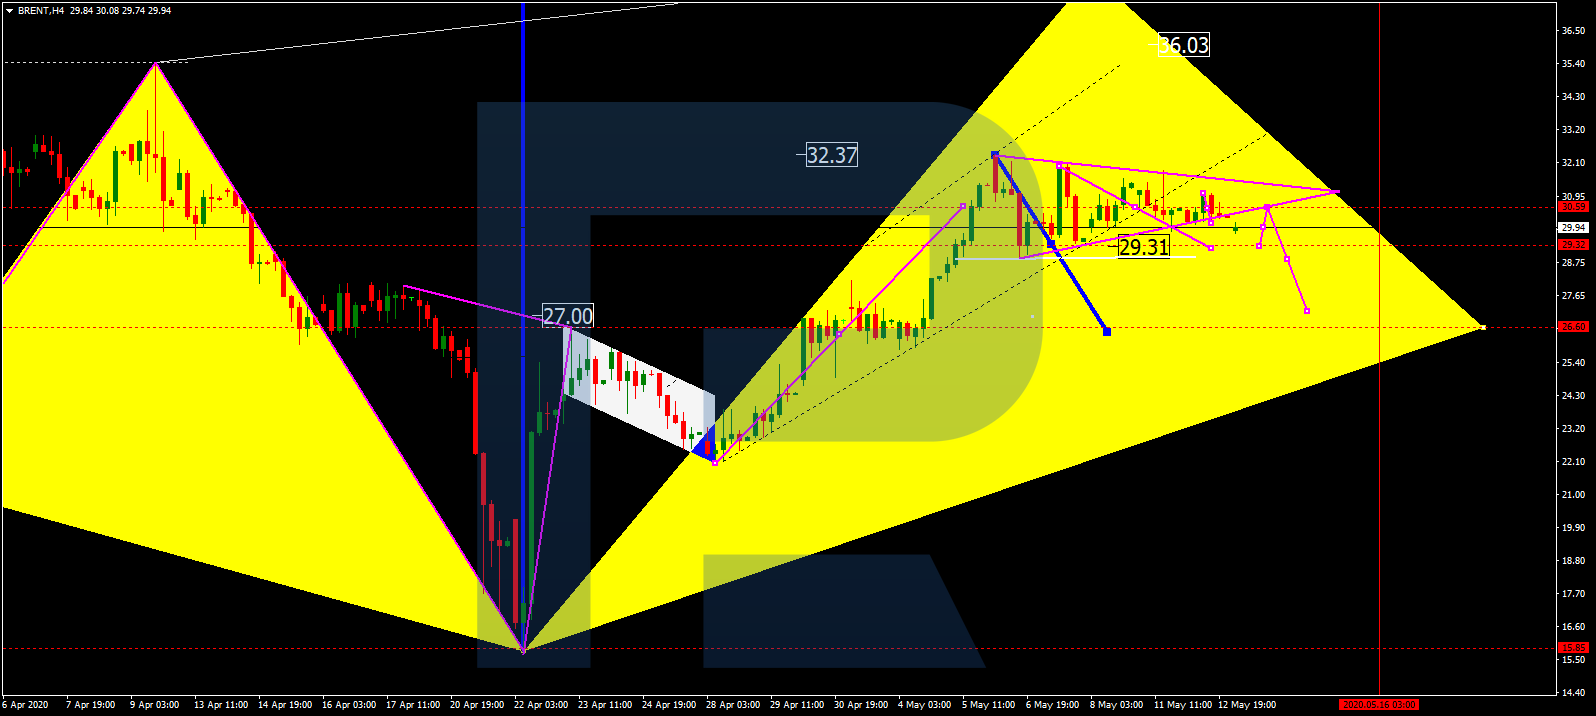
After breaking its consolidation range to the downside, Brent is expected to fall towards 29.30. Today, the pair may break this level as well and then continue the correction to reach 27.00. Later, the market may start forming the fifth ascending wave with the target at 38.20.

BRENT
Risk Warning: the result of previous trading operations do not guarantee the same results in the future

XAUUSD, “Gold vs US Dollar”

After completing the correction at 1700.00, Gold is expected to trade upwards and reach 1712.00. After breaking this level to the upside, the market may continue growing with the target at 1723.20.

GOLD
Risk Warning: the result of previous trading operations do not guarantee the same results in the future

BTCUSD, “Bitcoin vs US Dollar”

BTCUSD is consolidating around 8800.00. Possibly, today the pair may trade upwards to reach 9450.00 and then form a new descending structure to return to 8800.00. After that, the instrument may start another growth with the target at 9900.00.

BITCOIN
Risk Warning: the result of previous trading operations do not guarantee the same results in the future

S&P 500

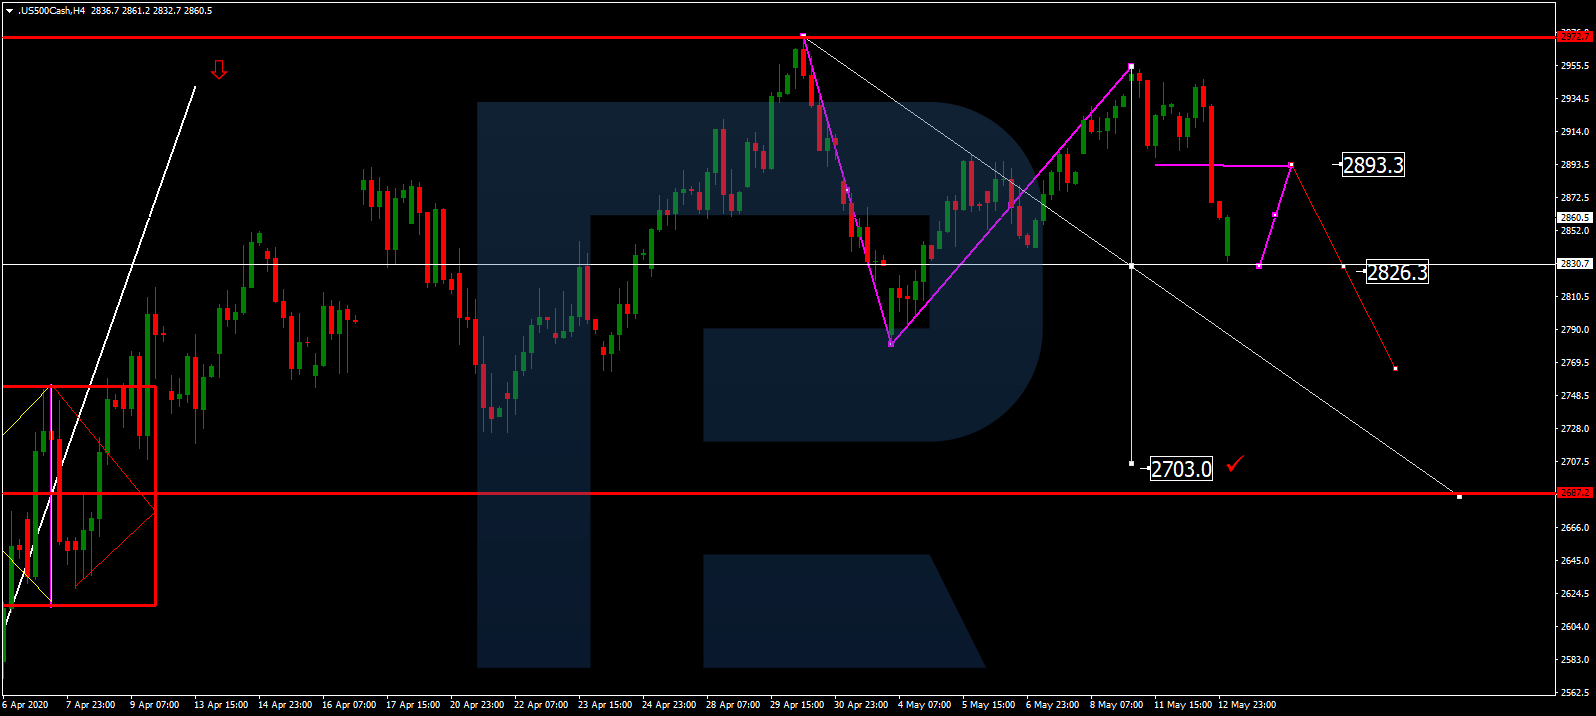
After breaking 2893.3 to the downside, the Index has reached 2835.0. Today, the pair may return to 2893.2 and test it from below. Later, the market may form a new descending structure to break 2826.5 and then continue trading downwards with the target at 2750.5.

S&P 500

Article By RoboForex.com

Attention!
Forecasts presented in this section only reflect the author’s private opinion and should not be considered as guidance for trading. RoboForex LP bears no responsibility for trading results based on trading recommendations described in these analytical reviews.

Fibonacci Retracements Analysis 13.05.2020 (GBPUSD, EURJPY)

Article By RoboForex.com

GBPUSD, “Great Britain Pound vs US Dollar”

As we see in the H4 chart, GBPUSD is steadily trading downwards within another correctional wave with the targets at 38.2%, 50.0%, and 61.8% fibo at 1.2175, 1.2030, and 1.1881 respectively. After completing this correctional downtrend, the pair is expected to start a new rising wave or impulse to break the high at 1.2648. Later, the market may form a long-term rising wave to reach 50.0% fibo at 1.2892.

GBPUSD_H4
Risk Warning: the result of previous trading operations do not guarantee the same results in the future

The H1 chart shows the current descending wave towards 38.2% fibo at 1.2175. At the same time, there might be convergence on MACD, which may indicate a possible pullback towards 23.6% fibo after the price reaches its target.

GBPUSD_H1
Risk Warning: the result of previous trading operations do not guarantee the same results in the future

EURJPY, “Euro vs. Japanese Yen”

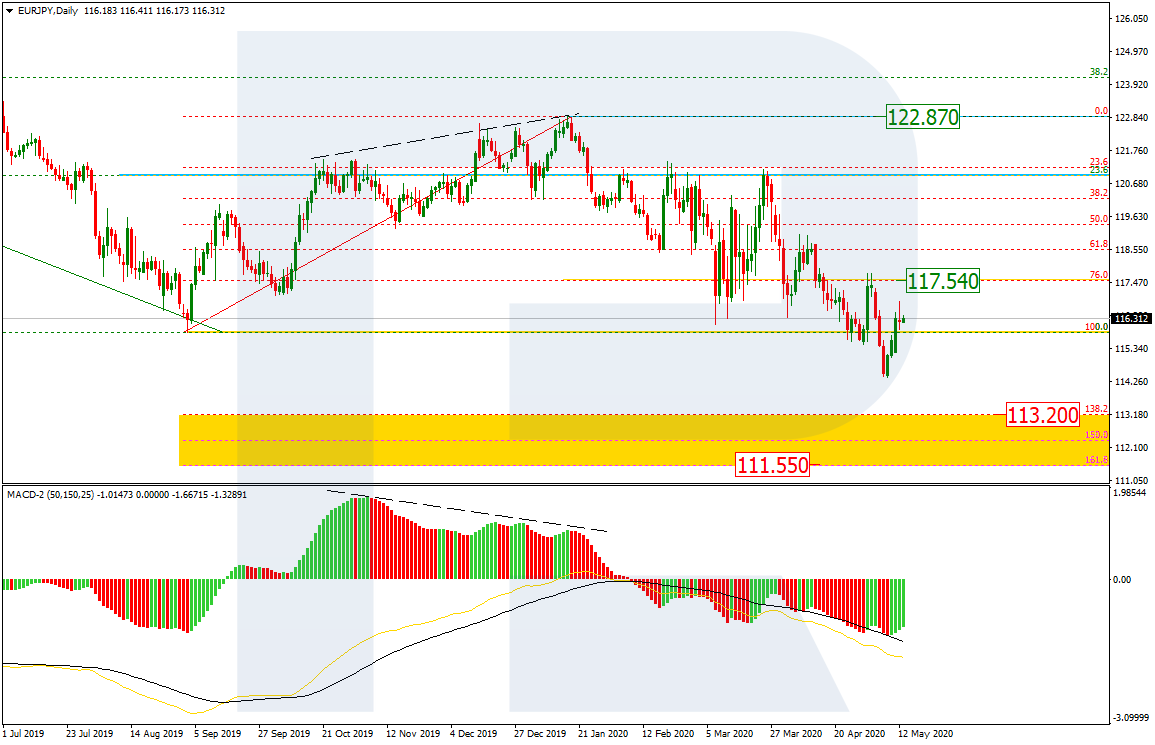
As we can see in the daily chart, after breaking the previous low, EURJPY has returned to it once again; this movement may be considered as an internal pullback within the descending wave but this pullback may transform into a correction in the form of the sideways channel. The local target of this pullback is 76.0% fibo at 117.54, which is the current resistance. The key downside targets remain inside the post-correctional extension area between 138.2% and 161.8% fibo at 113.20 and 111.55 respectively.

EURJPY_D1
Risk Warning: the result of previous trading operations do not guarantee the same results in the future

The H4 chart shows more detailed structure of the current pullback after the convergence. If the pair fails to reach the resistance at 117.54, the instrument may form a new descending impulse towards the post-correctional extension area between 138.2% and 161.8% fibo at 113.20 and 111.55 respectively.

GBPUSD_H4

Article By RoboForex.com

Attention!
Forecasts presented in this section only reflect the author’s private opinion and should not be considered as guidance for trading. RoboForex LP bears no responsibility for trading results based on trading recommendations described in these analytical reviews.

GBPUSD Shows No Signs Of A Breakout Yet

By Orbex

The Pound sterling continues to trade flat with prices drifting above the lower support level of the range at 1.2277.

With the minor resistance level at 1.2423 coming in, to the upside, GBPUSD could continue to drift sideways.

For the moment, the minor falling trend line will be key.

A successful upside breakout could confirm near term gains towards the 1.2423 level which could open up for a test back to the upper end of the range at 1.2485.

By Orbex


The Analytical Overview of the Main Currency Pairs on 2020.05.13

by JustForex

The EUR/USD currency pair

Technical indicators of the currency pair:
  • Prev Open: 1.08051
  • Open: 1.08470
  • % chg. over the last day: +0.37
  • Day’s range: 1.08411 – 1.08569
  • 52 wk range: 1.0777 – 1.1494

EUR/USD quotes have moved away from local lows. The greenback demand has weakened after the release of weak data on inflation in the US. Financial market participants have taken a wait-and-see attitude before today’s speech by Fed Chairman Jerome Powell. Investors assess rumors that the regulator may cut rates into negative territory in the future. At the moment, the EUR/USD currency pair is consolidating in the range of 1.0835-1.0875. A trading instrument has the potential for further growth. Positions should be opened from key levels.

At 15:30 (GMT+3:00), the US producer price index will be published.

EUR/USD

Indicators do not give accurate signals: the price has fixed between 50 MA and 100 MA.

The MACD histogram is in the positive zone, but below the signal line, which gives a weak signal to buy EUR/USD.

Stochastic Oscillator is in the neutral zone, the %K line is below the %D line, which indicates the bearish sentiment.

Trading recommendations
  • Support levels: 1.0835, 1.0790, 1.0770
  • Resistance levels: 1.0875, 1.0895, 1.0925

If the price fixes above 1.0875, further growth of the EUR/USD currency pair is expected. The movement is tending to 1.0900-1.0930.

An alternative could be a drop in EUR/USD quotes to 1.0800-1.0780.

The GBP/USD currency pair

Technical indicators of the currency pair:
  • Prev Open: 1.23310
  • Open: 1.22597
  • % chg. over the last day: -0.61
  • Day’s range: 1.22512 – 1.23013
  • 52 wk range: 1.1466 – 1.3516

Sales prevail on the GBP/USD currency pair. The British pound has reached key extremes. Currently, GBP/USD quotes are consolidating in the range of 1.2250-1.2300. Financial market participants assess the UK GDP report. The Office for National Statistics reported that the country’s GDP fell by 2.0% (q/q) in the first quarter. At the same time, experts forecasted a 2.5% drop (q/q). A trading instrument has the potential for further decline. We recommend opening positions from key levels.

We expect important economic releases from the US.

GBP/USD

Indicators signal the power of sellers: the price has fixed below 50 MA and 100 MA.

The MACD histogram is in the negative zone, but above the signal line, which gives a weak signal to sell GBP/USD.

Stochastic Oscillator is in the neutral zone, the %K line is below the %D line, which also indicates the bearish sentiment.

Trading recommendations
  • Support levels: 1.2250, 1.2200
  • Resistance levels: 1.2300, 1.2360, 1.2405

If the price fixes below 1.2250, a further drop in GBP/USD quotes is expected. The movement is tending to the round level is 1.2200.

An alternative could be the growth of the GBP/USD currency pair to 1.2340-1.2370.

The USD/CAD currency pair

Technical indicators of the currency pair:
  • Prev Open: 1.40031
  • Open: 1.40770
  • % chg. over the last day: +0.51
  • Day’s range: 1.40444 – 1.40853
  • 52 wk range: 1.2949 – 1.4668

The USD/CAD currency pair has recovered most of the losses after a sharp decline at the end of last week. The loonie is currently consolidating. Investors expect additional drivers. The local support and resistance levels are 1.4035 and 1.4085, respectively. Today we recommend paying attention to the news feed on the US economy, as well as the dynamics of “black gold” prices. Positions should be opened from key levels.

The news feed on Canada’s economy is calm.

USD/CAD

Indicators do not give accurate signals: 50 MA has started crossing 100 MA.

The MACD histogram is in the positive zone, but below the signal line, which gives a weak signal to buy USD/CAD.

Stochastic Oscillator is in the neutral zone, the %K line is above the %D line, which indicates the bullish sentiment.

Trading recommendations
  • Support levels: 1.4035, 1.4000, 1.3970
  • Resistance levels: 1.4085, 1.4120, 1.4170

If the price fixes above the resistance level of 1.4085, further growth of the USD/CAD quotes is expected. The movement is tending to 1.4120-1.4150.

An alternative could be a decrease in the USD/CAD currency pair to 1.4000-1.3970.

The USD/JPY currency pair

Technical indicators of the currency pair:
  • Prev Open: 107.628
  • Open: 107.135
  • % chg. over the last day: -0.49
  • Day’s range: 107.003 – 107.276
  • 52 wk range: 101.19 – 112.41

The USD/JPY currency pair has been declining. The trading instrument has updated local lows. The greenback demand has weakened. At the moment, USD/JPY quotes are testing a round level of 107.00. The 107.35 mark is the nearest resistance. The yen has the potential for further growth against the US currency. We expect important economic reports from the US. Positions should be opened from key levels.

The news feed on Japan’s economy is calm.

USD/JPY

Indicators do not give accurate signals: the price has fixed between 50 MA and 100 MA.

The MACD histogram is in the negative zone and below the signal line, which gives a strong signal to sell USD/JPY.

Stochastic Oscillator is in the neutral zone, the %K line has crossed the %D line. There are no signals at the moment.

Trading recommendations
  • Support levels: 107.00, 106.70, 106.45
  • Resistance levels: 107.35, 107.75

If the price fixes below the round level of 107.00, a further drop in the USD/JPY quotes is expected. The movement is tending to 106.70-106.50.

An alternative could be the growth of the USD/JPY currency pair to 107.60-107.90.

by JustForex

Fed Chairman Jerome Powell to speak today

By IFCMarkets

Top daily news

Investors are looking forward to Fed Head Jerome Powell’s speech and his views on further rate cuts. Yesterday’s fall in US stock indices triggered a wave of sales on European and Asian exchanges. Gold and oil continue to be traded in very narrow bands.

Forex news

Currency PairChange
EUR USD+0.04%
GBP USD-1.2%
USD JPY+0.13%

Today the US dollar index fell slightly for the second day in a row amid the discussion of negative interest rates by the US authorities. Earlier, US President Donald Trump called on the Fed to lower the base rate to a negative value. In his opinion, this will greatly simplify the refinancing of public debt and help the development of the economy. Now the rate is + 0.25%. The next Fed meeting will be on June 10th. Resolve of negative rates proponents is supported by the extremely low inflation. In April, it amounted to only 0.3% in annual terms. Thus, the allocation of financial assistance to corporations ($ 2.3 trillion) did not adversely affect consumer prices. In theory, negative rates can weaken the dollar. Investors are waiting for today’s speech by Fed Chairman Jerome Powell and his opinion on monetary policy. It will start at 15-00 CET. The New Zealand dollar depreciated today after the regular meeting of the Reserve Bank of New Zealand (RBNZ). The RBNZ  kept the rate (+ 0.25%), but announced the possibility of its further reduction, and also doubled the amount of emissions (quantitative easing) in order to provide financial assistance to the national economy.

Stock Market news

IndicesChange
S&P 500-2.03%
Dow Jones Index-1.87%
Nasdaq 100-2%
Nikkei Index-2.1%

On Tuesday, US stock indexes fell significantly. The main reason for this was that investors feared the mitigation of quarantine in some states might increase the number of coronavirus patients and even trigger a second wave of the pandemic. An additional negative factor was the worsening of trade and political relations between China and the US after American President Donald Trump announced that China might be responsible for the Covid-19 pandemic. Against the background of a possible Fed rate cut, shares of American banks JPMorgan Chase & Co (-3.3%) and Goldman Sachs Group Inc (-3.2%) fell yesterday. European stock indices went down today. Like in the USA, the shares of the largest banks turned out to be the top losers: Commerzbank (-5.6%), ABN Amro (-6.1%) and Deutsche Bank (-4%). Today no significant macroeconomic data are expected to be published in the US and the EU.

Commodity Market news

CommoditiesChange
WTI Crude+1.01%
Brent Crude Oil+0.7%

On Wednesday, oil quotes hardly changed. On the one hand, investors’ fears that a 2nd wave of the coronavirus pandemic may begin are having a negative effect. On the other hand, the abolition of quarantine measures in a number of countries increases the demand for gasoline and other fuels. Official data on US oil reserves for the week from U.S. Energy Information Administration, which may affect the market, will be published tonight. Total US oil reserves are predicted to increase, but the reserves in the Cushing storage facility, Oklahoma, are likely to decline by 2.3 million barrels, for the first time since February this year.

Gold Market News

MetalsChange
Gold+0.33%

For several weeks, gold has been traded in a narrow range near the psychological level of $ 1,700 per ounce. Lowering the Fed rate into the negative zone may increase the demand for precious metals. Today’s speech by Fed Chairman Jerome Powell can affect their quotes.

Market Analysis provided by IFCMarkets

Note:
This overview has an informative and tutorial character and is published for free. All the data, included in the overview, are received from public sources, recognized as more or less reliable. Moreover, there is no guarantee that the indicated information is full and precise. Overviews are not updated. The whole information in each overview, including opinion, indicators, charts and anything else, is provided only for familiarization purposes and is not financial advice or а recommendation. The whole text and its any part, as well as the charts cannot be considered as an offer to make a deal with any asset. IFC Markets and its employees under any circumstances are not liable for any action taken by someone else during or after reading the overview.

Euro Moves Higher As Technical Support Holds

By Orbex

The euro currency is posting modest gains after consolidating near the technical support level of 1.0818.

Price action is slightly bullish at the moment, but the bias will not shift unless EURUSD breaks out above 1.1000 level of resistance.

In the near term, this could put the currency pair at a risk to the downside.

However, as long as the support level near 1.0818 holds, we expect a move closer to the 1.10000 resistance level.

The slightly bullish divergence from the Stochastics also adds to this view.

By Orbex


Kiwi Has Collapsed After the RBNZ Meeting. Investors Expect a Press Conference of the Fed Chairman

by JustForex

During yesterday’s trading session, the US dollar weakened against a basket of currency majors. The US dollar index (#DX) closed in the negative zone (-0.31%). The greenback demand has declined before Fed Chairman Jerome Powell’s speech. Financial market participants are worried that the US may introduce negative interest rates in the future. Yesterday, US President Donald Trump called on the Fed to cut rates to negative values.

The New Zealand dollar has collapsed sharply during the Asian trading session. The Reserve Bank of New Zealand decided on a key interest rate and left it unchanged at 0.25%. At the same time, the regulator doubled the volume of bonds to be purchased as part of the quantitative easing program and announced a possible transition to negative interest rates amid the economic consequences of coronavirus. So far, rates will remain at the current level, but their reduction is quite likely.

The “black gold” prices are consolidating. At the moment, futures for the WTI crude oil are testing the $25.25 mark per barrel. At 17:30 (GMT+03:00), the US crude oil inventories will be published.

Market indicators

Yesterday, there was the bearish sentiment in the US stock market: #SPY (-1.99%), #DIA (-1.85%), #QQQ (-2.09%).

The 10-year US government bonds yield has fallen again. At the moment, the indicator is at the level of 0.66-0.67%.

The news feed on 2020.05.13:
  • – UK GDP data at 09:00 (GMT+03:00);
  • – UK manufacturing production at 09:00 (GMT+03:00);
  • – Producer price index in the US at 15:30 (GMT+03:00).

by JustForex

Gold traders to focus on Powell’s testimony on Wednesday

By Admiral Markets

Source: Economic Events May 13, 2020 – Admiral Markets’ Forex Calendar

Gold has generally been stable over the last days, trading around 1,700 USD.

That may surprise, given the fact that US economic data sets from the labour market came in at “catastrophic” levels with the ADP printing at -20.2 million, and Friday’s NFP’s at -20.5 million, which shows how much of the bad economic data seems to have been already priced into the markets.

On Wednesday, the main focus will probably be on the testimony from Fed chairman Powell in front of the US congress, regarding the economic impact and how any developments after the lockdown are to be lifted.

In fact, given the already massive monetary and fiscal stimulus from the US government, and the Fed’s fight against the economic impact of the lockdown, the comments from Powell need to point to a significantly weaker than already anticipated picture to trigger higher volatility in financial markets, especially Gold.

Still, a new sharper leg up stays a serious option, bringing the region around 1,750 USD back into focus in the days to come.

On the other hand the bearish divergence in the RSI(14) on a daily time-frame (orange) is still a topic and would be confirmed with a break below 1,660 USD, making a deeper corrective move as low as 1,630/35 USD possible.

Source: Admiral Markets MT5 with MT5-SE Add-on Gold Daily chart (between February 11, 2019, to May 12, 2020). Accessed: May 12, 2020, at 10:00pm GMT – Please note: Past performance is not a reliable indicator of future results, or future performance.

In 2015, the value of Gold fell by 10.4%, in 2016, it increased by 8.1%, in 2017, it increased by 13.1%, in 2018, it fell by 1.6%, in 2019, it increased by 18.9%, meaning that after five years, it was up by 28%.

Discover the world’s #1 multi-asset platform

Admiral Markets offers professional traders the ability to trade with a custom, upgraded version of MetaTrader 5, allowing you to experience trading at a significantly higher, more rewarding level. Experience benefits such as the addition of the Market Heat Map, so you can compare various currency pairs to see which ones might be lucrative investments, access real-time trading data, and so much more. Click the banner below to start your FREE download of MT5 Supreme Edition!

Download MetaTrader 5 and begin trading today!

Disclaimer: The given data provides additional information regarding all analysis, estimates, prognosis, forecasts or other similar assessments or information (hereinafter “Analysis”) published on the website of Admiral Markets. Before making any investment decisions please pay close attention to the following:

  1. This is a marketing communication. The analysis is published for informative purposes only and are in no way to be construed as investment advice or recommendation. It has not been prepared in accordance with legal requirements designed to promote the independence of investment research, and that it is not subject to any prohibition on dealing ahead of the dissemination of investment research.
  2. Any investment decision is made by each client alone whereas Admiral Markets shall not be responsible for any loss or damage arising from any such decision, whether or not based on the Analysis.
  3. Each of the Analysis is prepared by an independent analyst (Jens Klatt, Professional Trader and Analyst, hereinafter “Author”) based on the Author’s personal estimations.
  4. To ensure that the interests of the clients would be protected and objectivity of the Analysis would not be damaged Admiral Markets has established relevant internal procedures for prevention and management of conflicts of interest.
  5. Whilst every reasonable effort is taken to ensure that all sources of the Analysis are reliable and that all information is presented, as much as possible, in an understandable, timely, precise and complete manner, Admiral Markets does not guarantee the accuracy or completeness of any information contained within the Analysis. The presented figures refer that refer to any past performance is not a reliable indicator of future results.
  6. The contents of the Analysis should not be construed as an express or implied promise, guarantee or implication by Admiral Markets that the client shall profit from the strategies therein or that losses in connection therewith may or shall be limited.
  7. Any kind of previous or modeled performance of financial instruments indicated within the Publication should not be construed as an express or implied promise, guarantee or implication by Admiral Markets for any future performance. The value of the financial instrument may both increase and decrease and the preservation of the asset value is not guaranteed.
  8. The projections included in the Analysis may be subject to additional fees, taxes or other charges, depending on the subject of the Publication. The price list applicable to the services provided by Admiral Markets is publicly available from the website of Admiral Markets.

Leveraged products (including contracts for difference) are speculative in nature and may result in losses or profit. Before you start trading, you should make sure that you understand all the risks

By Admiral Markets

SUGAR Analysis: Sugar production declined in India

By IFCMarkets

Sugar production declined in India

An additional factor for the possible growth of sugar prices may be an increase in bioethanol production in Brazil. Both products (sugar and biofuels) are made from sugar cane. Amid the collapse of world oil prices, Brazilian farmers in the second half of April increased the share of sugar cane processing into sugar to 45.8% from 30.9% in the same period last year. As a result, sugar production increased by 93%. This was reported by Unica. As oil quotes recover and grow, Brazil’s bioethanol production may increase due to reduced sugar production. The possible strengthening of the Brazilian real can also contribute to higher sugar prices.

IndicatorVALUESignal
RSINeutral
MACDBuy
MA(200)Neutral
FractalsNeutral
Parabolic SARBuy
Bollinger BandsNeutral


Summary of technical analysis

OrderBuy
Buy stopAbove 11
Stop lossBelow 9,2

Market Analysis provided by IFCMarkets