Author Archive for InvestMacro – Page 9

Financial Market Sentiment Has Been Improved

by JustForex

The greenback has been declining against a basket of world currencies. The dollar index (#DX) has updated local lows. Investors’ sentiment has been improved after Oxford University and some US pharmaceutical companies reported significant advances in the development of a COVID-19 vaccine. These events have strengthened the demand for risky assets.

EU leaders have agreed on a plan and budget for economic recovery in the region, which has been affected by the COVID-19 epidemic. Today, financial market participants will assess the report on retail sales in Canada and API weekly crude stock.

The “black gold” prices have been growing again. At the moment, futures for the WTI crude oil are testing the $42.00 mark per barrel.

Market indicators

Yesterday, there were purchases in the US stock market: #SPY (+0.81%), #DIA (+0.03%), #QQQ (+2.84%).

The 10-year US government bonds yield continues to consolidate. At the moment, the indicator is at the level of 0.61-0.62%.

The news feed for 2020.07.21:
  • – Statistics on retail sales in Canada at 15:30 (GMT+3:00).

by JustForex

56% of investors say sustainable investments (ESG) are a new safe-haven

By George Prior

– Sustainable and responsible investments (ESG) are now regarded as ‘safe havens’ by the majority of investors, reveals one of the world’s largest independent financial advisory and fintech organizations.

deVere Group, which operates in more than 100 countries globally, reports that 56% of clients who seek to include environmental, social and governance-orientated investments into their portfolios do so citing that such sustainable funds offer financial protection in times of uncertainty.

A safe-haven asset is a financial instrument that is expected to retain, or even gain value during periods of economic downturn.

Nigel Green, deVere Group’s CEO and founder, says: “There’s been a massive surge from clients this year looking for ESG investments.

“Indeed, more than a quarter of all clients are currently considering or are already actively engaged in responsible, impactful and sustainable investing.

“It’s a phenomenon that’s particularly prevalent with millennials, with eight out of 10 putting ESG credentials at the heart of their investment decision-making process.”

He continues: “However, what is perhaps particularly interesting are the reasons why investors are seeking ESG in the first place.

“Of course, the global public health crisis has acted as a wake-up call in many respects. It has prompted a growing collective awareness of mutual responsibility that fits perfectly into the narrative of ESG investing.

“But what’s most surprising is that the majority [56%] also now say that they perceive ESG investments as the new safe-haven asset class.  As such, they are increasing their exposure to such funds in a way that traditionally they would have done with, say, gold or U.S. government bonds.”

Mr Green goes on to say: “They would be correct in citing this view. All the latest research underscores that the majority of environmental, social and governance investments have outperformed their non-sustainable counterparts this year and have had lower volatility.

“This cannot be ignored by retail – and increasingly institutional – investors who are looking for resilience in these highly unusual times of this new era.”

Previously, the deVere CEO has commented that the trend for ESG is only likely to intensify as millennials, who are statistically more likely to seek responsible investment options, become the major beneficiaries of the largest intergenerational transfer of wealth – an estimated $30tn in the next few years – meaning we can expect both retail and institutional investors to continue to pile into ESG.

Nigel Green concludes: “The data shows that the view held by traditionalists who claim ESG investments are ‘nice to have’ but not ‘a need to have,’ falls apart under scrutiny in the virus-driven global economic downturn.

“And whilst this short time frame is not determinative, those investors citing ESG’s safe-haven credentials are, for now at least, being proven right.”

About:

deVere Group is one of the world’s largest independent advisors of specialist global financial solutions to international, local mass affluent, and high-net-worth clients.  It has a network of more than 70 offices across the world, over 80,000 clients and $12bn under advisement.

Japanese Candlesticks Analysis 21.07.2020 (USDCAD, AUDUSD, USDCHF)

Article By RoboForex.com

USDCAD, “US Dollar vs Canadian Dollar”

As we can see in the H4 chart, after re-testing the resistance area and forming a Shooting Star pattern, USDCAD has almost reversed. Considering the current downtrend, one may assume that the asset may break the support level and then continue falling. In this case, the downside target is at 1.3434. Still, an opposite scenario suggests that the instrument may continue growing to return to the resistance area at 1.3620.

USDCAD
Risk Warning: the result of previous trading operations do not guarantee the same results in the future

AUDUSD, “Australian Dollar vs US Dollar”

As we can see in the H4 chart, the uptrend continues. By now, AUDUSD has formed a Shooting Star pattern not far from the resistance area; at the moment, the pair is reversing. The target is the rising channel’s downside border. Later, the price may rebound from the support level and resume the rising tendency. In this case, the upside target remains at 0.7070. At the same time, one shouldn’t exclude another scenario, which implies that the instrument may continue falling and return to 0.6970.

AUDUSD
Risk Warning: the result of previous trading operations do not guarantee the same results in the future

USDCHF, “US Dollar vs Swiss Franc”

As we can see in the H4 chart, after testing the support area again and forming a group of reversal patterns, including Hammer, USDCHF is reversing. The upside target is at 0.9450. After completing the pullback, the pair may resume trading downwards to reach the next downside target at 0.9360. Later, the market may update its lows and continue falling.

USDCHF

Article By RoboForex.com

Attention!
Forecasts presented in this section only reflect the author’s private opinion and should not be considered as guidance for trading. RoboForex LP bears no responsibility for trading results based on trading recommendations described in these analytical reviews.

Top Software Picks for Day Trading

Day trading’s popularity has surged in the past couple of decades. High-speed internet connections and access to personal computers made day trading an attainable possibility. Today, the potential to earn money and work full-time executing trades is an exciting possibility.

However, as any skilled day trader will tell you, day trading isn’t for everyone. It’s often aggressive, fast-paced, and requires an enormous amount of skill and strategy. Additionally, to be successful, you must have a comprehensive, intuitive, and powerful software.

Many new day traders mistakenly think they aren’t good at day trading when the problem isn’t their ability – it’s their software’s shortcomings causing them to fall short.

So, what are the top software picks for day traders? Let’s get into it.

Choosing the Right Software

When you first start learning how to day trade, you might not have your strategy figured out yet. Not knowing what you need can make finding the right software even more challenging.

If you’re just getting started, there are a few specific things you want your software to have:

  • Responsive and Up-To-Date Research
  • An Affordable Minimum Balance
  • Low Fees and Commissions
  • Mobile-Friendly
  • Comprehensive Analytics
  • Fast Execution Time
  • Market Scanning Capabilities
  • Portfolio Tracking
  • User-Friendly Charting Software

If your software has all of the above features, you’ve likely found a winner. However, your needs might be more complicated. If you plan to utilize complex algorithms, you might find that you need a localized computer-based software. You might also really benefit from additional features like backtesting, news coverage, and more.

Start with the must-have features, and then look for software solutions that also include your unique needs. The perfect software for you exists, you just have to find it.

Now, what are some of the software solutions on the market that fit the bill? Let’s dive into some of the top choices.

Five Top Day Trading Software

  1. LightSpeed – LightSpeed offers a free demo account for users. This allows you to learn how to trade with zero risks. Pair that with their low latency and fast execution speeds, and it’s clear why they’re a top pick. They also have incredibly low commissions, which is essential for active day traders. Once you get your feet wet, customization is a breeze.
  2. TradeStation – TradeStation has been in the game since 1982. They’re true innovators in the trading software world. They offer commission-free stock trades, one-click trading, comprehensive research, and completely customizable software. They’re also praised for their top-tier customer service.
  3. Interactive Brokers – Interactive Brokers is the trading software developed specifically for day trading. Because of this, it’s incredibly intuitive to the needs of day traders. They can be costly, though. Most experts say that Interactive Brokers is the best software for day traders, but only if you know exactly what you’re doing. If you’re brand new to day trading, you’d likely fare better learning the ropes with different software and then switching to this one later on.
  4. TD Ameritrade (ThinkorSwim) – Unlike Interactive Brokers, ThinkorSwim is a terrific software to learn the ropes. It offers research and tools, educational resources, mobile trading, and hotkeys. Additionally, it has nearly every single feature you could ever need. Some say that there are almost too many features, which can make it overwhelming to a new trader. However, with their tools and easy-to-use interface, it’s a fantastic place to develop your strategy and style.
  5. TradeSpoon – TradeSpoon’s beginner option is free, so it’s an ideal place to start without having to pay a fortune. The interface and usability are intuitive and dynamic. They offer a wide range of interesting tools, like their sock forecast toolbox. However, what really sets TradeSpoon apart is their one-on-one mentoring options. If you like learning via a teacher or mentor, TradeSpoon has mentors available to help you learn the ropes, which can make the transition into day trading much smoother.

Selecting Your Software

Ultimately, your perfect software will depend a lot on your unique needs. However, if you look for software that includes the must-have features, you’ll be ahead of the curve. Always read the fine print on fees, check out reviews, and do additional research before committing to any software.

Finally, know that no matter what software you choose to go with, you’ll have a bit of learning to do. Learning how to successfully day trade takes a lot of work, and fantastic software is just one piece of the puzzle.

About the Author:

Skylar Hammond is a writer for the True Trader group who specializes in topics such as stock trading, personal finance, and forex. He focuses on helping beginners and experts alike learn more about the market and improve their trading skills.

Murrey Math Lines 21.07.2020 (AUDUSD, NZDUSD)

Article By RoboForex.com

AUDUSD, “Australian Dollar vs US Dollar”

In the H4 chart, AUDUSD is trading above 5/8. In this case, the pair is expected to continue growing to reach the resistance at 8/8. However, this scenario may be canceled if the price breaks 6/8 to the downside. After that, the instrument may continue falling towards the support at 5/8.

AUDUSD_H4
Risk Warning: the result of previous trading operations do not guarantee the same results in the future

As we can see in the M15 chart, the pair has broken the upside line of the VoltyChannel indicator and, as a result, may continue trading upwards.

AUDUSD_M15
Risk Warning: the result of previous trading operations do not guarantee the same results in the future

NZDUSD, “New Zealand Dollar vs US Dollar”

As we can see in the H4 chart, after rebounding from 8/8 again, NZDUSD is expected to resume trading downwards to reach the support at 6/8. However, this scenario may no longer be valid if the price breaks 8/8 to the upside. After that, the instrument may continue growing towards the resistance at +1/8.

NZDUSD_H4
Risk Warning: the result of previous trading operations do not guarantee the same results in the future

In the M15 chart, the pair may break the downside line of the VoltyChannel indicator and, as a result, continue moving downwards.

NZDUSD_M15

Article By RoboForex.com

Attention!
Forecasts presented in this section only reflect the author’s private opinion and should not be considered as guidance for trading. RoboForex LP bears no responsibility for trading results based on trading recommendations described in these analytical reviews.

The Analytical Overview of the Main Currency Pairs on 2020.07.21

by JustForex

The EUR/USD currency pair

Technical indicators of the currency pair:
  • Prev Open: 1.14102
  • Open: 1.14439
  • % chg. over the last day: +0.13
  • Day’s range: 1.14230 – 1.14697
  • 52 wk range: 1.0777  – 1.1494

The EUR/USD currency pair has become stable. At the moment, the trading instrument is consolidating. The key range is 1.1415-1.1470. EU leaders have agreed on a plan and budget for economic recovery in the region, which has been affected by the coronavirus pandemic. Sentiment in financial markets has improved after Oxford University reported significant advances in the development of a vaccine for COVID-19. The demand for risky assets is still high. Further growth of EUR/USD quotes is possible. We recommend opening positions from key levels.

The publication of important economic releases is not planned today.

EUR/USD

Indicators do not give accurate signals: the price has crossed the 50 MA.

The MACD histogram is near the 0 mark.

Stochastic Oscillator is in the neutral zone, the %K line has crossed the %D line. There are no signals at the moment.

Trading recommendations
  • Support levels: 1.1415, 1.1370, 1.1325
  • Resistance levels: 1.1470, 1.1500

If the price fixes above 1.1470, further growth in EUR/USD quotes is expected. The movement is tending to 1.1500-1.1520.

An alternative could be a decline in the EUR/USD currency pair to 1.1380-1.1360.

The GBP/USD currency pair

Technical indicators of the currency pair:
  • Prev Open: 1.25530
  • Open: 1.26567
  • % chg. over the last day: +0.72
  • Day’s range: 1.26502 – 1.27162
  • 52 wk range: 1.1466  – 1.3516

There are aggressive purchases on the GBP/USD currency pair. During yesterday’s and today’s trading sessions, the British pound added more than 160 points in price against the greenback. The trading instrument has set new local highs. At the moment, GBP/USD quotes are consolidating in the range of 1.2665-1.2715. The demand for risky assets is still high. The pound has the potential for further growth. Positions should be opened from key levels.

The news feed on the UK economy is calm.

GBP/USD

Indicators signal the power of buyers: the price has fixed above 50 MA and 100 MA.

The MACD histogram is in the positive zone, but below the signal line, which gives a weak signal to buy GBP/USD.

Stochastic Oscillator is in the neutral zone, the %K line has crossed the %D line. There are no signals at the moment.

Trading recommendations
  • Support levels: 1.2665, 1.2625, 1.2590
  • Resistance levels: 1.2715, 1.2750

If the price fixes above 1.2715, further growth in GBP/USD quotes is expected. The movement is tending to 1.2750-1.2770.

An alternative could be a decline in the GBP/USD currency pair to 1.2630-1.2600.

The USD/CAD currency pair

Technical indicators of the currency pair:
  • Prev Open: 1.35690
  • Open: 1.35359
  • % chg. over the last day: -0.29
  • Day’s range: 1.34847 – 1.35364
  • 52 wk range: 1.2949  – 1.4668

USD/CAD quotes show a negative trend. During yesterday’s and today’s trading sessions, the loonie added more than 80 points in price. At the moment, the trading instrument is testing the local support of 1.3485. The 1.3520 mark is already a “mirror” resistance. A further decline in the USD/CAD currency pair is possible. We recommend paying attention to the dynamics of “black gold” prices. Positions should be opened from key levels.

At 15:30 (GMT+3:00), a report on retail sales will be published in Canada.

USD/CAD

Indicators signal the power of sellers: the price has fixed below 50 MA and 100 MA.

The MACD histogram is in the negative zone, indicating the bearish sentiment.

Stochastic Oscillator is in the neutral zone, the %K line has crossed the %D line. There are no signals at the moment.

Trading recommendations
  • Support levels: 1.3485, 1.3450, 1.3420
  • Resistance levels: 1.3520, 1.3540, 1.3565

If the price fixes below 1.3485, a further drop in USD/CAD quotes is expected. The movement is tending to 1.3460-1.3440.

An alternative could be the growth of the USD/CAD currency pair to 1.3540-1.3560.

The USD/JPY currency pair

Technical indicators of the currency pair:
  • Prev Open: 107.092
  • Open: 107.204
  • % chg. over the last day: +0.15
  • Day’s range: 107.127 – 107.367
  • 52 wk range: 101.19  – 112.41

The technical pattern on the USD/JPY currency pair is still ambiguous. The trading instrument is in a sideways trend. The key support and resistance levels are 107.10 and 107.40, respectively. Investors expect additional drivers. We recommend paying attention to the dynamics of the US government bonds yield. Positions should be opened from key levels.

Japan’s national core consumer price index remained unchanged in June.

USD/JPY

Indicators do not give accurate signals: the price has crossed the 50 MA.

The MACD histogram is near the 0 mark.

Stochastic Oscillator is in the neutral zone, the %K line is below the %D line. There are no signals at the moment.

Trading recommendations
  • Support levels: 107.10, 106.95, 106.80
  • Resistance levels: 107.40, 107.60, 108.00

If the price fixes below 107.10, USD/JPY quotes are expected to fall. The movement is tending to 106.80-106.60.

An alternative could be the growth of the USD/JPY currency pair to 107.60-107.90.

by JustForex

Protracted G7 contraction – or multiyear global depression

By Dan Steinbock

 – Global growth prospects are deteriorating. Instead of a V-shaped recovery in the 2nd quarter, advanced economies will face historical carnage and a prolonged contraction. But there’s still worse ahead.

Current estimates for major advanced economies remain too optimistic, due to the mismanagement of the COVID-19, belated responses and premature exits, which have now caused far-earlier-than-expected secondary virus waves. As a result, the hoped-for V-shaped recovery will not happen in the 2nd quarter.

The Trump administration’s catastrophic COVID-19 failures, along with premature exits to reopen the economy and leave the WHO will virtually ensure still new virus waves and longer contraction. In turn, US tariff wars are undermining the promise of the Asian Century.

2nd quarter carnage: projections and realities

In early February, as new coronavirus cases began to decelerate in China but accelerate outside China, I predicted that China would rebound in the 2nd quarter but major advanced economies could rebound in the 3rd quarter only if they’d manage to contain the pandemic.

At the time, this view was seen as too optimistic for China and too pessimistic for advanced economies.

When the deceleration of new cases in China continued in March, but dramatically accelerated in major advanced economies, I projected that China’s rebound in the 2nd quarter would be stronger than expected. And that major advanced economies, particularly the US, would face a contraction that would be at par with or worse than the Great Depression.

At the time, this view was seen as too optimistic for China and too pessimistic for advanced economies.

In late January, President Trump congratulated President Xi Jinping for China’s success in the virus containment. In March I predicted that Trump would reverse his words. Due to plunging ratings and re-election challenges, I projected that Trump and his administration would blame China for COVID-19, particularly in early summer ahead of the 2nd quarter results in the US.

Today, we know that Chinese economy became the first to rebound in the 2nd quarter, by growth of 3.2%. In contrast, major advanced economies are heading toward a historical plunge in the 2nd quarter. And as projected, Trump’s attacks against China intensified in June and have accelerated into a kind of hybrid war.

And there’s worse ahead.

Economic erosion in G7, rebound in China

Until recently, many international observers expected US to benefit from a strong rebound that would start in late spring and strengthen in the 3rd quarter. New virus waves were seen as a possible threat but later in the fall. The Trump administration’s pandemic mismanagement and premature exits have undermined those hopes and resulted in a huge virus resurgence in the US; months earlier than anticipated.

While consensus models expected US coronavirus cases to be around 3 million by now, they will exceed 4 million soon. So, the 2rd quarter contraction, which was expected to amount to -33%, is likely to soar to -53%, according to the Atlanta Fed. Annualized growth will take a deeper hit, accordingly.

In the UK, Boris Johnson’s government followed in the US footprints until realities proved overwhelming. While the government has taken a different stance since late spring, it has been too little too late. Coronavirus cases are about to exceed 300,000. In the 2nd quarter, British economy could plunge by -20% to -25%.

Although Italy was the first major economy in the Euro area to suffer from the pandemic, its stringent quarantine measures reduced the damage in the spring. Nonetheless, the virus cases amount to almost 245,000 and the 2rd quarter is expected to translate to a plunge of -9% to -10%.

As the Euro area’s strongest economy, Germany is no longer immune to contraction either. As German cases are about to exceed 200,000, the country could experience a plunge of -8% to -10% in the 2nd quarter.

France is following in Germany’s footprints. Officially, the cases are about to exceed 175,000. Yet, the 2nd quarter will prove dire with a plunge of -17%.

While COVID-19 has recently surged in Japan, official cases average at about 25,000, while annualized growth is likely to plunge to -5%. But official virus data cannot be taken at face value because minimal testing. Until recently, the country’s testing capacity, as adjusted to population, has been significantly behind that of Uganda, half of that in the Philippines and less than 2.5% relative to the UK.

Chinese cases have stayed below 85,000, as I predicted three months ago. As long as China can deter imported infections, the rebound will prevail. The challenge will be the Trump administration’s hybrid war, which seeks to derail China’s return to pre-crisis economic growth, while risking global economic prospects for years to come.

Protracted contraction or global depression

A review of official coronavirus cases and discrepancies between expected and likely quarterly results suggests trends that will cause increasing distress in major advanced economies. Not just in the next few months but in the medium-term, due to COVID-19 mismanagement, belated responses and premature exits.

Here’s why:

  • Instead of the hoped-for V-shaped economic rebound in the 2ndquarter, no major advanced economy will deliver such performance.
  • In the US, Latin America and some other economies, where containment failures, belated responses and premature exits have proved significant, secondary waves will prolong the pandemic pain and collateral economic damage. Yet, current estimates do not reflect these outcomes, which markets still undervalue. Worse, as restrictions expire, US infections are likely to migrate elsewhere in the world.
  • If advanced economies continue to mismanage the pandemic crisis and persist in premature exits, they will face a protracted L-shaped recovery, which could evolve into a multiyear global depression in the early 2020s.
  • Major advanced economies are coping with their historical plunge by taking more debt, Ironically, the medication against COVID-19 is paving the way for soaring budget deficits. As old fiscal packages prove inadequate, new ones will be launched, which will contribute to new debt crises and risk defaults.
  • In the past months, fiscal stimuli have been coupled with aggressive monetary easing; that is, the return to ultra-low rates and large asset purchases, which will prevail significantly longer than currently acknowledged, with attendant longer-term collateral damage.

The US quest to push for tariff wars, even amid the worst contraction in a century, is now undermining efforts to promote world trade, investment and migration, which the G20 economies used in 2008 to avoid global depression.

The net effect – unwarranted de-globalization – will endanger global recovery, deepen economic challenges and contribute to potentially fatal geopolitical crises.

It’s time to tighten the belts; we’re in for a new rollercoaster ride. That’s what happens when science-based public-health policies are systematically ignored for political exigencies. Pandemics gain, economies lose, and people will suffer.

About the Author:

Dr. Dan Steinbock is an internationally recognized strategist of the multipolar world and the founder of Difference Group. He has served at the India, China and America Institute (USA), Shanghai Institutes for International Studies (China) and the EU Center (Singapore). For more, see https://www.differencegroup.net/ 

Based on Dr Steinbock’s global briefing on July 17, 2020


US Stock Market Stalls Near A Double Peak

By TheTechnicalTraders 

– The US stock market stalled early this week as earnings started to hit.  A number of news and other items are pending with earnings just starting to roll in.  There have been some big numbers posted from JP Morgan and Goldman Sachs.   Yet, the markets have reacted rather muted to these blowout revenues.

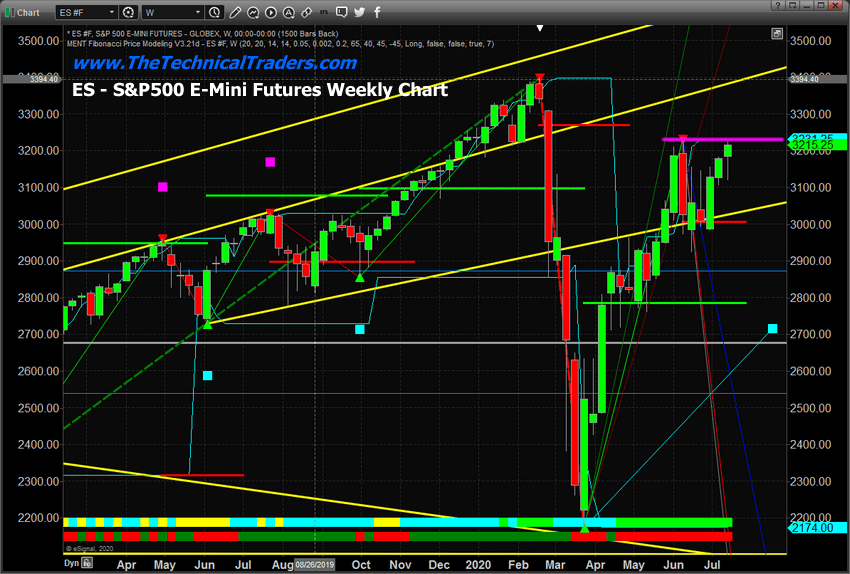
We believe this is a technical “Double Top” set up in the making.  The NASDAQ has been much weaker than the S&P and the Dow Industrials.  We believe the US stock market is reacting to the reality of earnings and forward guidance after the recent rally in price levels over the past 9+ weeks.  If we are correct and this Double-Top pushes price levels lower, then this technical resistance level may become the price ceiling headed into Q3 and Q4 2020.

Before you continue, be sure to opt-in to our free market trend signals 
before closing this page, so you don’t miss our next special report!

E-mini S&P 500, Weekly chart

his ES, E-mini S&P, Weekly chart highlights the technical Double Top pattern that we believe will become a major price ceiling as earnings and other economic data continues to be released.  This is a perfect example of how technical patterns align with fundamental data to present very clear trading signals.  If the resistance near 3220 holds as we expect, the ES price level should begin to move lower attempting to target the 3000 level.

SPY ETF Weekly Chart

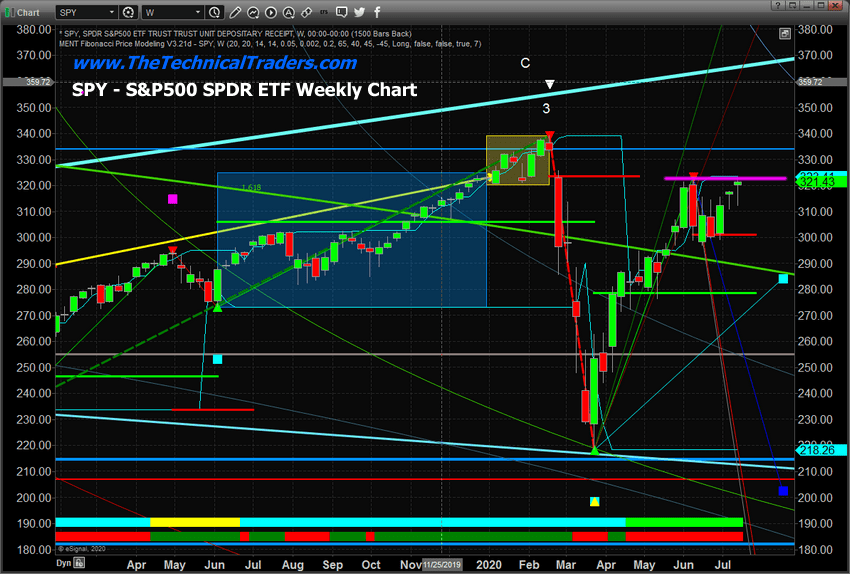
This SPY ETF Weekly chart highlights the similar Double-Top pattern that has setup with further indicates strong resistance near $322 – which aligns with the original Fibonacci Bearish Trigger Level from the February peak levels (the solid RED line).  The Double-Top setup near the Fibonacci Bearish Trigger level suggests a very strong resistance level that exists near $322.  It is our opinion that this Double-Top setup near strong resistance will likely push the SPY into a downside price trend targeting $300 or lower.

Transportation Index Weekly Chart

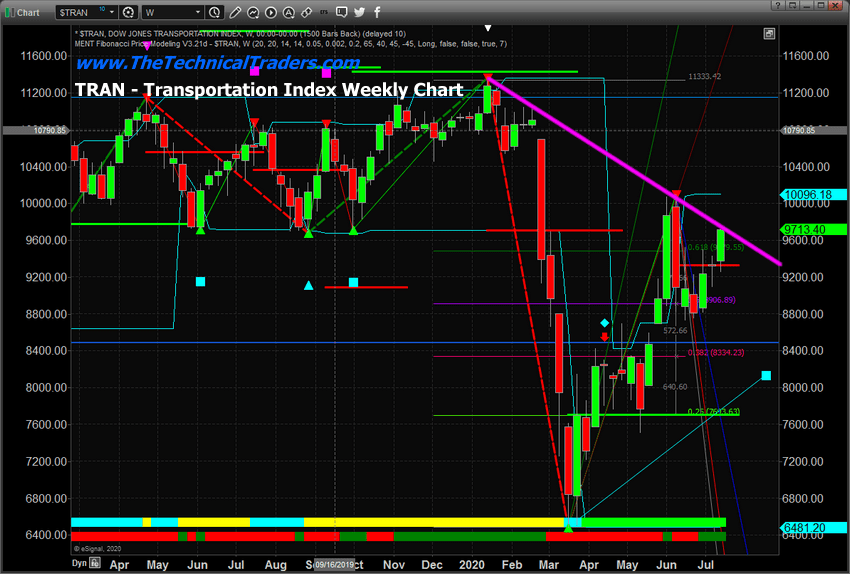
This Transportation Index Weekly chart highlights a different type of resistance price pattern – a downward sloping price channel peak.  Unlike a Double-Top pattern, when price creates unique high price peaks that align into a price channel, we can attempt to use this channel as a price resistance channel going forward.  In this case, the peak price level in February 2020 and the peak price level in June 2020 creates a very clear downward price channel that matches the current price peak perfectly.

It is our opinion that this peak level will act as strong price resistance in the Transportation Index and should prompt a downside price trend targeting $8900 to $9000 or lower.

As global traders and investors continue to trade the forward expectations and earnings data that will last another 4+ weeks, we have to be prepared, as skilled technical traders, to trade any decent price moves that initiate as a result of price reacting to this technical resistance and moving lower.  As technical traders, we will wait for confirmation of a trading signal before jumping into a trade from these levels.  This makes a big difference in terms of accuracy.  Once we receive a confirmation of the technical pattern, we believe the trade has a much higher accuracy ratio.

In closing, be prepared for bigger downside price trends as this technical resistance works through the markets. After the peak in June 2020 and the setup of this Double-Top pattern, our researcher team believes a downside price move from current levels is highly likely.

Get our Active ETF Swing Trade Signals or if you have any type of retirement account and are looking for signals when to own equities, bonds, or cash, be sure to become a member of my Passive Long-Term ETF Investing Signals which we are about to issue a new signal for subscribers.

Chris Vermeulen
Chief Market Strategies
Founder of Technical Traders Ltd.

NOTICE: Our free research does not constitute a trade recommendation or solicitation for our readers to take any action regarding this research.  It is provided for educational purposes only.  Our research team produces these research articles to share information with our followers/readers in an effort to try to keep you well informed.

TheTechnicalTraders.com


The EU Summit Is in the Spotlight. The Central Bank of China Has Kept its Key Interest Rate Unchanged.

by JustForex

The US dollar is losing ground against its main competitors. On Friday, the US dollar index (#DX) has updated local lows and closed in the negative zone (-0.45%). Investors are still concerned about an increase in the number of people infected with COVID-19. Last week, the United States reported a new anti-record. At the moment, the number of people infected with coronavirus worldwide has reached 14.5 million.

The EU summit in Brussels, where the leaders of the countries discuss the bloc’s budget for 2021-2027 and an anti-crisis economic recovery plan, is in the spotlight. In June, Japan’s exports fell by 26.2% (y/y). The central bank of China left its key rate unchanged at 3.85% for the third month in a row.

The “black gold” prices have been declining. At the moment, futures for the WTI crude oil are testing the $40.40 mark per barrel.

Market indicators

On Friday, there was a variety of trends on the US stock market: #SPY (+0.29%), #DIA (-0.27%), #QQQ (+0.12%).

The 10-year US government bonds yield is consolidating. At the moment, the indicator is at the level of 0.61-0.62%.

The news feed for 2020.07.20:
  • – Consumer price index in the Eurozone at 12:00 (GMT+3:00);
  • – Statistics on the US real estate market at 15:30 (GMT+3:00).

by JustForex

Forex Technical Analysis & Forecast 20.07.2020

Article By RoboForex.com

EURUSD, “Euro vs US Dollar”

EURUSD is moving not far from the upside border of a wide consolidation range. Possibly, today the pair may update 1.1455 and then fall towards the downside border at 1.1350. After that, the instrument may grow towards 1.1395. If later the price breaks this range to the upside, the market may resume trading upwards to reach 1.1550; if to the downside – start a new decline with the target at 1.1250.

EURUSD
Risk Warning: the result of previous trading operations do not guarantee the same results in the future

GBPUSD, “Great Britain Pound vs US Dollar”

GBPUSD is still consolidating around 1.2550. Today, the pair may trade downwards to reach 1.2477 and then resume growing to test 1.2550 from below. Later, the market may start a new decline with the target at 1.2450.

GBPUSD
Risk Warning: the result of previous trading operations do not guarantee the same results in the future

USDRUB, “US Dollar vs Russian Ruble”

After breaking 71.31 to the upside, USDRUB is expected to continue the correction towards 72.20. Possibly, today the pair may reach this level and then fall to break 71.28. Later, the market may continue trading downwards with the target at 70.00.

USDRUB
Risk Warning: the result of previous trading operations do not guarantee the same results in the future

USDJPY, “US Dollar vs Japanese Yen”

After finishing the ascending wave and reaching the target at 107.50, USDJPY is expected to continue growing towards 107.60 and then form a new descending structure to break 107.06. After that, the instrument may continue trading inside the downtrend with the target at 106.60.

USDJPY
Risk Warning: the result of previous trading operations do not guarantee the same results in the future

USDCHF, “US Dollar vs Swiss Franc”

USDCHF is still consolidating around 0.9444. Possibly, the pair may fall to reach 0.9370 and then grow to break 0.9444. Later, the market may continue trading upwards with the target at 0.9474.

USDCHF
Risk Warning: the result of previous trading operations do not guarantee the same results in the future

AUDUSD, “Australian Dollar vs US Dollar”

AUDUSD is still consolidating around 0.6982. Today, the pair may fall towards 0.6944 and then return to test 0.6982 from below. Later, the market may resume trading downwards to break 0.6944 and then continue falling with the target at 0.6900.

AUDUSD
Risk Warning: the result of previous trading operations do not guarantee the same results in the future

BRENT

Brent is still correcting towards 42.58. The main scenario suggests that the price may complete this correction and grow with the target at 43.23. After that, the instrument may start a new decline towards 42.95 and then form one more ascending structure to break 43.50. Later, the market may continue trading upwards to reach 44.44.

BRENT
Risk Warning: the result of previous trading operations do not guarantee the same results in the future

XAUUSD, “Gold vs US Dollar”

Gold is still consolidating around 1803.50. Possibly, today the pair may test this level from above and then form one more ascending structure towards 1812.97. Later, the market may start another decline to return to 1803.50 and then resume trading upwards with the target at 1819.22.

GOLD
Risk Warning: the result of previous trading operations do not guarantee the same results in the future

BTCUSD, “Bitcoin vs US Dollar”

After finishing the ascending wave at 9212.00, BTCUSD is trading downwards to reach 9136.00. After that, the instrument may resume trading upwards to complete this wave at 9300.00. Later, the market may resume falling to break 9000.00 and then continue moving inside the downtrend with the target at 8700.00.

BITCOIN
Risk Warning: the result of previous trading operations do not guarantee the same results in the future

S&P 500

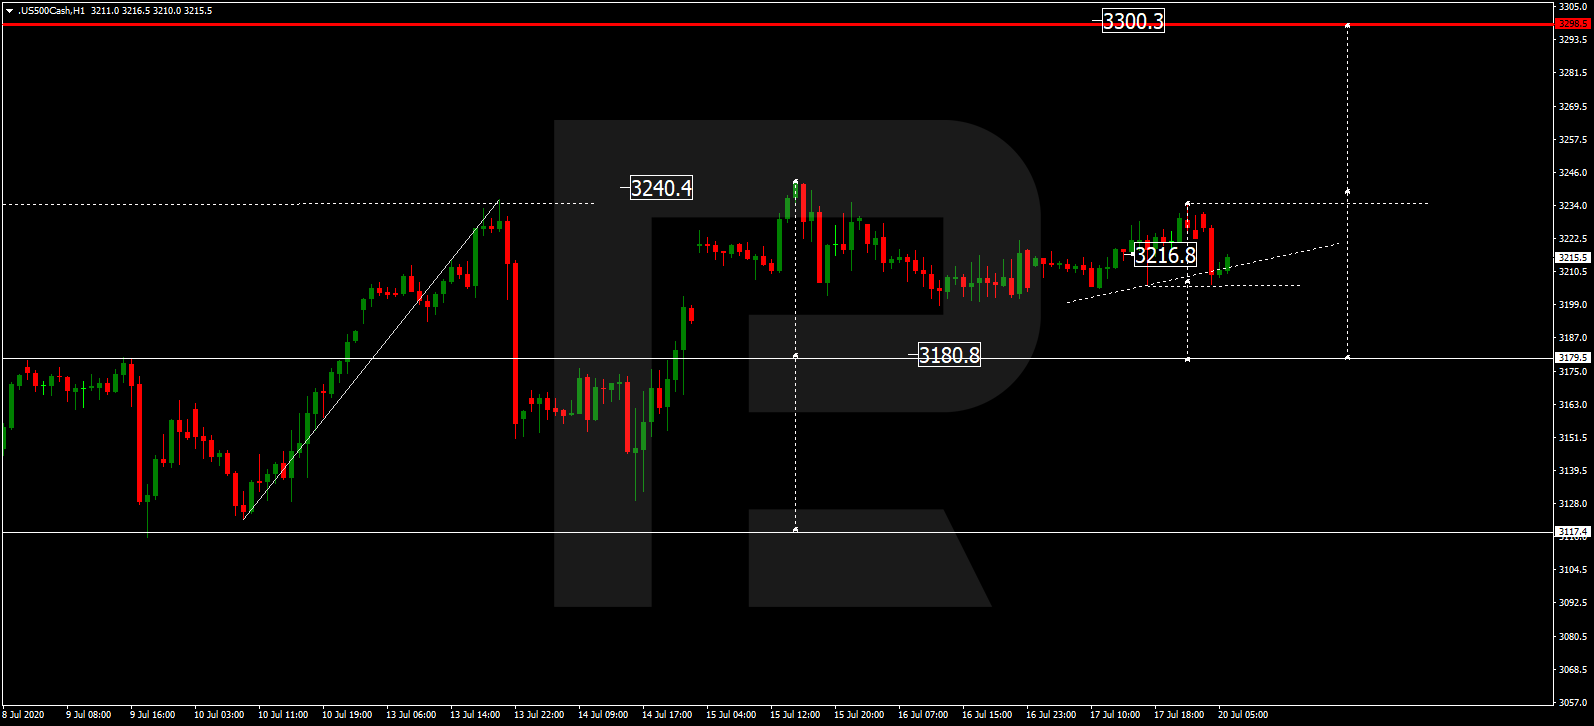
The S&P 500 Index is consolidating above 3200.5. Possibly, the asset may break this level to the downside and continue the correction towards 3111.1. However, if the price grows and breaks 3235.5, the market may continue trading upwards to reach 3300.3 and then start a new decline with the target at 3111.1.

S&P 500

Article By RoboForex.com

Attention!
Forecasts presented in this section only reflect the author’s private opinion and should not be considered as guidance for trading. RoboForex LP bears no responsibility for trading results based on trading recommendations described in these analytical reviews.