Author Archive for InvestMacro – Page 50

Bitcoin’s coming of age? May’s historic halving taking place in a new era

By George Prior

The Bitcoin price will hit ‘at least $10,000’ even before the four-yearly ‘halving’ event taking place in two weeks, predicts the CEO of one of the world’s largest independent financial advisory organizations.

The prediction from the chief executive and founder of deVere Group, Nigel Green, comes as the price of the world’s largest cryptocurrency suddenly soared by more than $1,500 on Thursday, moving it to its highest value since February.  It peaked at $9,400.

It comes ahead of May’s highly anticipated halving event. Occurring every four years, halving means that less and less Bitcoin – which is limited to 21 million units – will be mined.

In 2012, the number of new Bitcoins issued every 10 minutes fell from 50 to 25. In 2016, it went down from 25 to 12.5. Now, in the 2020 halving, it will drop from 12.5 to 6.25.

Mr Green says: “We see the cryptocurrency market already significantly picking up pace ahead of the historic event in May.

“Investors are now increasing their exposure to Bitcoin as the halving – only the third in its 11-year history – will push up prices sharply due to the dramatically lower supply combined with a steady demand and increasing awareness of digital currencies.”

Previous Bitcoin halving events have prompted impressive price climbs. The 2016 halving triggered a 300 per cent jump in the value of Bitcoin.

But the 2020 one could be even more remarkable, believes the deVere CEO.

He notes: “May’s event could herald Bitcoin’s coming of age.

“It will, of course, drive prices higher – but, in my opinion, the jump could be even more impactful due to these unprecedented times.

“The digitalisation of our lives is accelerating at a faster pace than ever before. We’re in an exciting new era driven by technology.

“This new world needs new ways of doing things to fit the new normal.  Clearly, one of those things which is needed now more than ever, as the world becomes ever-more digitalised and globalised, is digital and global currency, such as Bitcoin.

“This will not have gone unnoticed by investors who are increasingly piling into cryptocurrencies.”

Mr Green continues: “Also, these unusual times have forced central banks to increase monetary supply. By printing never-seen-before amounts of money, traditional currencies are devalued and inflation fears rise.

“This will also drive investors towards decentralised, non-sovereign digital currencies.”

Mr Green concludes: “The excitement of the forthcoming rare halving event, together with the new era we’re in, will drive the price of Bitcoin exponentially and sustainably.

“I believe we can expect it to hit at least $10,000 before the May event itself.

“Beyond that, we could see an explosion in the price of Bitcoin due to real-world issues it addresses and increasing adoption.”

About:

deVere Group is one of the world’s largest independent advisors of specialist global financial solutions to international, local mass affluent, and high-net-worth clients.  It has a network of more than 70 offices across the world, over 80,000 clients and $12bn under advisement.

V-shaped economic revival, fuelled by FOMO

By George Prior

The Fear Of Missing Out (FOMO) is likely to drive financial markets significantly higher in the coming weeks, predicts the CEO of one of the world’s largest independent financial advisory organizations.

The prediction from Nigel Green, founder and chief executive of deVere Group, which has $12bn under advisement, comes as global stocks scored significant gains on Wednesday.

Benchmark stock indexes in the U.S. – the world’s largest economy – gained 2.9 per cent on the day, bringing the total gains since the market bottomed out last month to an impressive 31 per cent for the S&P 500 index.

Elsewhere, the FTSE100 in London closed at its highest in seven weeks, echoing upswings on European and Asia-Pacific indexes.

Mr Green says: “We’re witnessing what is likely to become a powerful recovery in global stock markets as investors look ahead to the latter half of 2020 and into 2021.

“They are shrugging off the entirely expected current poor economic data – this has largely been priced in already.

“Instead, investor optimism is being reinforced by reports of major progress in the effort to develop coronavirus treatments. Also as central banks continue to roll out and further enhance their stimulus packages, and as crippling lockdown restrictions around the world begin to ease to revive economies.”

He continues: “With investors gaining confidence, a V-shaped post-pandemic economic revival is now being priced in.

“Investor exuberance is contagious. As the markets move steadily higher – unfazed by the recent poor economic data from the peak of the pandemic – it can be expected that the uptick will further sharpen due to that powerful investor sentiment: FOMO.

“The Fear Of Missing Out will drive many investors – including myself – off the sidelines.

“With a recovery on its way, they don’t want to miss out on the current value in the market long-term, with has the effect of driving markets higher.”

At Wednesday’s closing bell, the S&P 500 index, Wall Street’s benchmark, had clawed back 60 per cent of the losses suffered through February and March. This, says, Nigel Green, illustrates the trend he describes.

“Investors know that the closer we get to a covid-19 drug, and the more economies are reopened, and as trillions and trillions from stimulus packages kick in, the more the rebound will take hold  – and they don’t want to miss the boat.”

The deVere CEO concludes: “A bit like this invisible virus, we don’t know what’s going to happen day by day, but we do know ultimately economies adapt and so do people.

“This is why, as history teaches us, that over the longer-term the performance of stock markets is fairly predictable: they go up.”

About:

deVere Group is one of the world’s largest independent advisors of specialist global financial solutions to international, local mass affluent, and high-net-worth clients.  It has a network of more than 70 offices across the world, over 80,000 clients and $12bn under advisement.

Japanese Candlesticks Analysis 30.04.2020 (GOLD, NZDUSD, GBPUSD)

Article By RoboForex.com

XAUUSD, “Gold vs US Dollar”

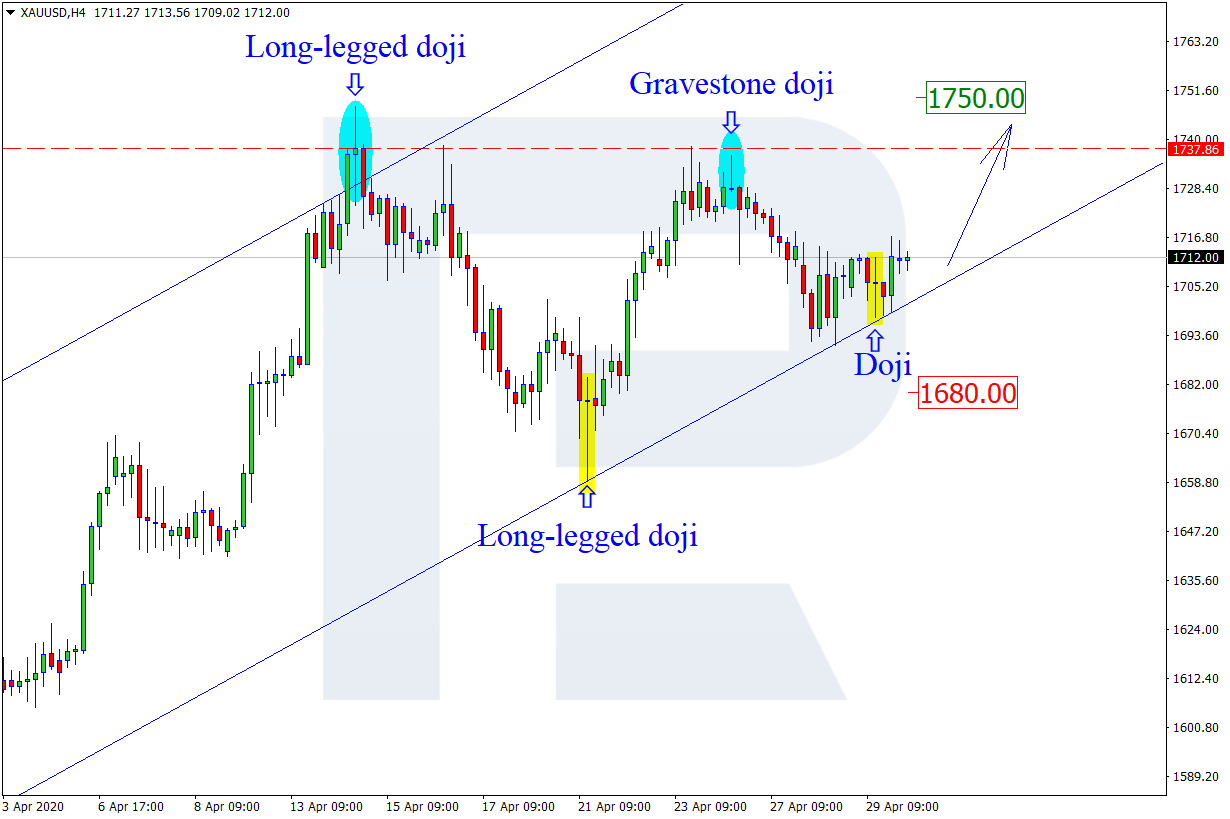
As we can see in the H4 chart, after testing the channel’s downside border, XAUUSD has formed several reversal patterns, such as Doji. At the moment, the pair is reversing. In this case, the upside target may be at 1750.00. At the same time, the instrument may choose an opposite scenario and continue trading upwards only after the correction towards 1680.00.

XAUUSD
Risk Warning: the result of previous trading operations do not guarantee the same results in the future

NZDUSD, “New Zealand vs. US Dollar”

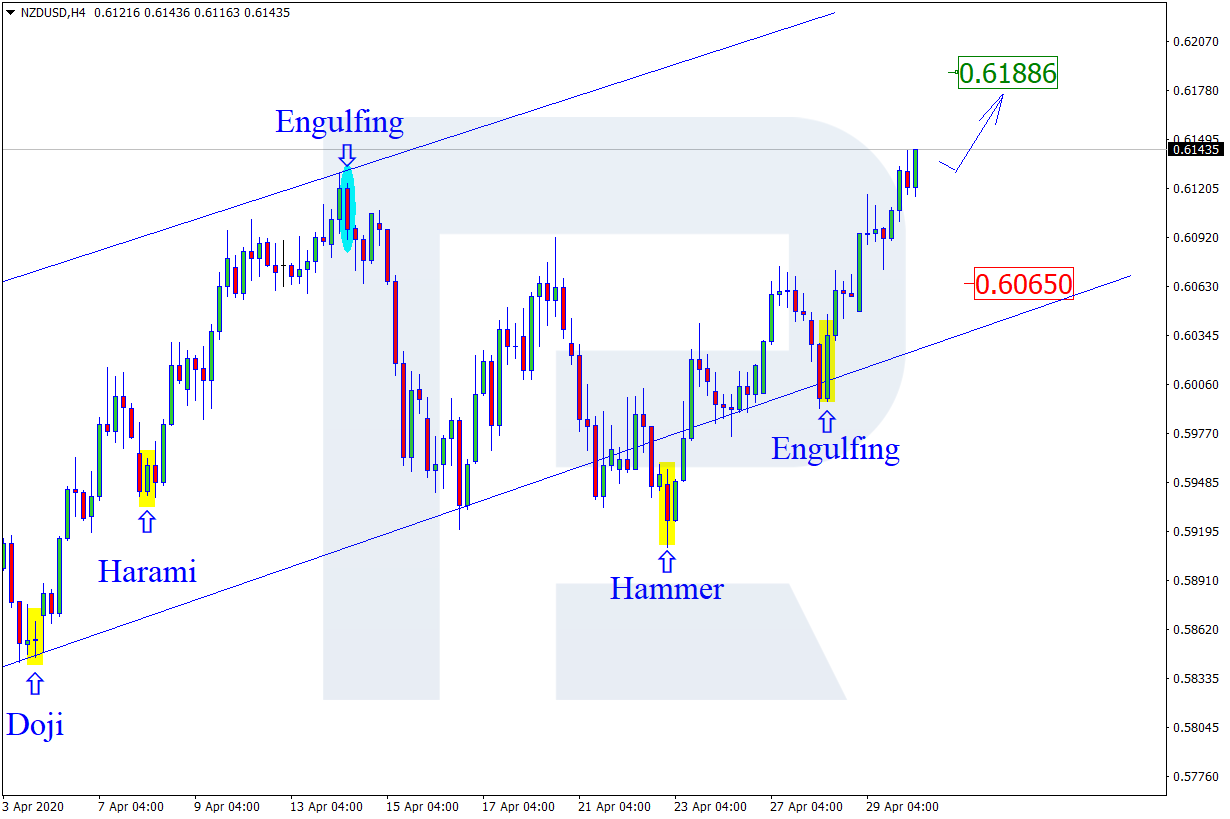
As we can see in the H4 chart, the price is still moving inside the rising channel. After finishing an Engulfing pattern, NZDUSD is reversing. In this case, the upside target may be at 0.6188. Still, one shouldn’t exclude another scenario, which says that the instrument may continue the ascending tendency only after finishing the correction towards 0.6065.

NZDUSD
Risk Warning: the result of previous trading operations do not guarantee the same results in the future

GBPUSD, “Great Britain Pound vs US Dollar”

As we can see in the H4 chart, after testing the channel’s downside border, GBPUSD has formed several reversal patterns, such as Inverted Hammer. At the moment, the pair is moving inside the rising channel and reversing. Later, the market may resume the ascending tendency with the target at 1.2555. However, there is another scenario, which implies that the instrument may correct towards 1.2400 before resuming its growth

GBPUSD

Article By RoboForex.com

Attention!
Forecasts presented in this section only reflect the author’s private opinion and should not be considered as guidance for trading. RoboForex LP bears no responsibility for trading results based on trading recommendations described in these analytical reviews.

Ichimoku Cloud Analysis 30.04.2020 (GBPUSD, USDJPY, USDCAD)

Article By RoboForex.com

GBPUSD, “Great Britain Pound vs US Dollar”

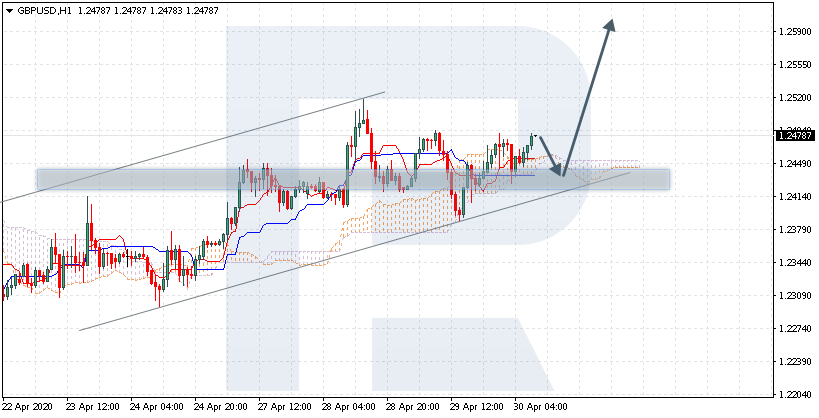
GBPUSD is trading at 1.2478; the instrument is moving above Ichimoku Cloud, thus indicating a bullish tendency. The markets could indicate that the price may test the cloud’s downside border at 1.2445 and then resume moving upwards to reach 1.2595. Another signal in favor of further ascending movement is the price’s rebounding from the rising channel’s downside border. However, the scenario that implies further growth may no longer be valid if the price breaks the cloud’s downside border and fixes below 1.2405. In this case, the pair may continue falling towards 1.2315.

GBPUSD
Risk Warning: the result of previous trading operations do not guarantee the same results in the future

USDJPY, “US Dollar vs Japanese Yen”

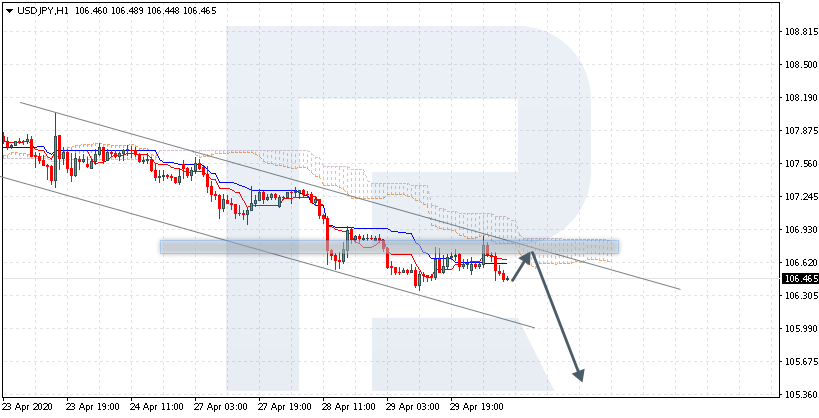
USDJPY is trading at 106.46; the instrument is moving below Ichimoku Cloud, thus indicating a descending tendency. The markets could indicate that the price may test the cloud’s downside border at 106.65 and then resume moving downwards to reach 105.65. Another signal to confirm further descending movement is the price’s rebounding from the descending channel’s upside border. However, the scenario that implies further decline may be canceled if the price breaks the cloud’s upside border and fixes above 107.15. In this case, the pair may continue growing towards 108.05.

USDJPY
Risk Warning: the result of previous trading operations do not guarantee the same results in the future

USDCAD, “US Dollar vs Canadian Dollar”

USDCAD is trading at 1.3865; the instrument is moving below Ichimoku Cloud, thus indicating a bearish tendency. The markets could indicate that the price may test the cloud’s downside border at 1.3930 and then resume moving downwards to reach 1.3735. Another signal to confirm further descending movement is the price’s rebounding from the descending channel’s upside border. However, the scenario that implies further decline may be canceled if the price breaks the cloud’s upside border and fixes above 1.4035. In this case, the pair may continue growing towards 1.4125.

USDCAD

Article By RoboForex.com

Attention!
Forecasts presented in this section only reflect the author’s private opinion and should not be considered as guidance for trading. RoboForex LP bears no responsibility for trading results based on trading recommendations described in these analytical reviews.

The Analytical Overview of the Main Currency Pairs on 2020.04.30

by JustForex

The EUR/USD currency pair

Technical indicators of the currency pair:
  • Prev Open: 1.08189
  • Open: 1.08704
  • % chg. over the last day: +0.51
  • Day’s range: 1.08515 – 1.08913
  • 52 wk range: 1.0777 – 1.1494

There is an ambiguous technical pattern on the EUR/USD currency pair. At the moment, the key support and resistance levels are 1.0845 and 1.0890, respectively. Investors assess the Fed meeting. The regulator, as expected, kept the key marks of monetary policy at the same level. The Central Bank expects a decline in key economic indicators in the second quarter. The greenback is under pressure due to weak data on US GDP in the first quarter. Financial market participants have taken a wait-and-see attitude before today’s ECB meeting. Positions should be opened from key levels.

The Economic News Feed for 30.04.2020

  • – German labor market report at 10:55 (GMT+3:00)
  • – Consumer price index in the Eurozone at 12:00 (GMT+3:00);
  • – ECB interest rate decision at 14:45 (GMT+3:00);
  • – Initial jobless claims in the US at 15:30 (GMT+3:00).
EUR/USD

Indicators signal the power of buyers: the price has fixed above 50 MA and 100 MA.

The MACD histogram is in the positive zone and continues to rise, indicating the bullish sentiment.

Stochastic Oscillator is in the neutral zone, the %K line is above the %D line, which also gives a signal to buy EUR/USD.

Trading recommendations
  • Support levels: 1.0845, 1.0810, 1.0785
  • Resistance levels: 1.0890, 1.0930

If the price fixes above 1.0890, the EUR/USD currency pair is expected to grow. The movement is tending to 1.0930-1.0960.

An alternative could be a decrease in the EUR/USD quotes to 1.0820-1.0790.

The GBP/USD currency pair

Technical indicators of the currency pair:
  • Prev Open: 1.24186
  • Open: 1.24667
  • % chg. over the last day: +0.35
  • Day’s range: 1.24290 – 1.24817
  • 52 wk range: 1.1466 – 1.3516

The GBP/USD currency pair is being traded in a flat. There is no defined trend. The British pound continues to test key support and resistance levels: 1.2425 and 1.2485, respectively. Financial market participants expect additional drivers. The greenback demand has weakened after the Fed meeting, as well as the release of a weak report on US GDP. We do not exclude the growth of GBP/USD quotes in the near future. We recommend opening positions from key support and resistance levels.

The news feed on the UK economy is calm.

GBP/USD

Indicators do not give accurate signals: the price has crossed 50 MA.

The MACD histogram is in the positive zone, indicating the bullish sentiment.

Stochastic Oscillator is in the neutral zone, the %K line is below the %D line, which gives a signal to sell GBP/USD.

Trading recommendations
  • Support levels: 1.2425, 1.2385, 1.2315
  • Resistance levels: 1.2485, 1.2515, 1.2570

If the price fixes above the resistance level of 1.2485, GBP/USD quotes are expected to rise. The movement is tending to 1.2525-1.2550.

An alternative could be a decrease in the GBP/USD currency pair to 1.2390-1.2370.

The USD/CAD currency pair

Technical indicators of the currency pair:
  • Prev Open: 1.39942
  • Open: 1.38792
  • % chg. over the last day: -0.83
  • Day’s range: 1.38583 – 1.38983
  • 52 wk range: 1.2949 – 1.4668

The USD/CAD currency pair shows a steady downtrend. The trading instrument has updated local lows again. The loonie is currently consolidating near the support level of 1.3860. The 1.3915 mark is the nearest resistance. The Canadian dollar is supported by the recovery of oil quotes. The USD/CAD currency pair has the potential for further decline. We expect the publication of important economic releases. Positions should be opened from key levels.

At 15:30 (GMT+3:00), Canada’s GDP data will be published.

USD/CAD

Indicators signal the power of sellers: the price has fixed below 50 MA and 100 MA.

The MACD histogram is in the negative zone, indicating the bearish sentiment.

Stochastic Oscillator is in the neutral zone, the %K line is above the %D line, which gives a signal to buy USD/CAD.

Trading recommendations
  • Support levels: 1.3860, 1.3800
  • Resistance levels: 1.3915, 1.3960, 1.4005

If the price fixes below the support level of 1.3860, a further drop in the USD/CAD quotes is expected. The movement is tending to the round level of 1.3800.

An alternative could be the growth of the USD/CAD currency pair to 1.3940-1.3970.

The USD/JPY currency pair

Technical indicators of the currency pair:
  • Prev Open: 106.855
  • Open: 106.574
  • % chg. over the last day: -0.15
  • Day’s range: 106.405 – 106.876
  • 52 wk range: 101.19 – 112.41

USD/JPY quotes have become stable. There is no defined trend. The trading instrument is testing the following key support and resistance levels: 106.40 and 106.80, respectively. In the near future, a technical correction is not ruled out. We recommend paying attention to economic releases, as well as to the dynamics of US government bonds yield. Positions should be opened from key levels.

USD/JPY

Indicators do not give accurate signals: the price has crossed 50 MA.

The MACD histogram is in the negative zone, indicating the bearish sentiment.

Stochastic Oscillator is in the neutral zone, the %K line is above the %D line, which gives a signal to buy USD/JPY.

Trading recommendations
  • Support levels: 106.40, 106.00
  • Resistance levels: 106.80, 107.00, 107.35

If the price fixes below 106.40, a further drop in the USD/JPY quotes is expected. The movement is tending to the round level of 106.00.

An alternative could be the growth of the USD/JPY currency pair to 107.00-107.30.

by JustForex

EURUSD: euro-bulls preparing an assault on 1.0900

By Alpari.com

On Wednesday the 29th of April, trading on the euro closed 52 pips up at 1.0871. The pair even reached 1.0885 at one point in the day. While the euro made gains against the dollar, the pair remained within Tuesday’s range (1.0810 – 1.0889).

The dollar declined as a result of the rally on stock indices and an increased appetite for risk. The US stock market surged after reports of successful early trials for the Remdesivir drug from Gilead Sciences. The company is hoping to get a better idea of the drug’s effectiveness by the end of May.

The recovery of stock indices failed to mitigate the disappointment of US GDP figures, which posted a decline of 4.8% for Q1 against a forecasted drop of 4%. This is the biggest downturn seen since the financial crisis of 2009. These figures are indicative of an impending recession. Moreover, the figures for Q2 are expected to be even worse, as the full extent of the coronavirus’ impact will be felt.

The Federal Reserve left interest rates unchanged at 0 – 0.25% on Wednesday. The regulator announced that it expects the rate to stay there for the foreseeable future. US Fed Chair Jerome Powell has said that he expects unemployment to reach double figures.

Day’s news (GMT+3):

  • 10:55 Germany: unemployment rate (Apr).
  • 12:00 Eurozone: CPI (Apr), GDP (Q1), unemployment rate (Mar).
  • 14:45 Eurozone: ECB interest rate decision.
  • 15:30 Eurozone: ECB press conference.
  • 15:30 Canada: GDP (Feb).
  • 15:30 US: consumer spending (Mar), initial jobless claims (24 Apr).
  • 16:45 US: Chicago PMI (Apr).

Pic. 1Current situation:

The pair traded above the balance line on Wednesday. Now it’s around the 1.0900 resistance. Trader focus today will be on Eurozone GDP for Q1 and the ECB monetary policy meeting. The pricing model points towards a rise to 1.0965. There should be a lot of market activity in the US session as ECB President Christine Laagarde takes centre stage. There are support levels at 1.0852 (LB) and 1.0810.

By Alpari.com

Q1 GDP Data Masking The True Global Economic Future?

By TheTechnicalTraders 

– As Q1 GDP data is released on Wednesday, April 29, which will reflect the first three months of 2020 in terms of total economic output, we believe the number will skew the current true global economic conditions to a large degree.  The pandemic shutdowns started in the US on March 15th – nearly 2 weeks before the end of Q1:2020.  Thus, we had a fairly normal Q1 in terms of economic activity, production, and consumer engagement. Everything changed after March 15th, 2020.

Skilled traders need to watch the current economic data and “week over week” data that is presented.  Skilled traders also need to pay attention to the news items that are being pushed out to the public.  Larger and larger corporations and sectors are moving towards bankruptcy or screaming for a bailout. Airlines, Hotels, Car Rental, and dozens of other sectors have all collapsed over the past 5+ weeks.  We expect real estate activity and pricing to collapse as well.  The results of the last 5+ weeks, after the March 15th shutdown started, have been anything but normal.

We continue to believe the current data and news, which is still representative of the Q1 (pre-shutdown) economic activity may lull investors/traders into believing the global economy will rebound fairly quickly from this virus event.  Traders/investors are looking at this current data and thinking, “well, this isn’t so bad”.  But they are failing to understand the true scope of the economic contraction event and what the longer-term outcome is likely to be in terms of recovery.

Total World GDP Output

The total world GDP output was approximately $190 trillion.  An estimated 15% to 20% global GDP contraction as a result of the Covid-19 virus event would shave $28.5 to $38.0 trillion right off the top of the 2020 global economic output.  Should the global shutdown last through the end of May 2020 (or beyond in some form), we believe the contraction in global GDP could become even more severe.

The complicated issues that arise from this global contraction in GDP also bleed over into supply-side economics.  As the world attempts to “shelter in place” to avoid spreading the virus and risking more lives, demand collapses. Once demand collapses enough (resulting in price level collapses as we’ve seen in Oil) the result in production/supply issues becomes even more complicated.  Unlike Eggs or Milk, one simply can’t bury or destroy other types of supply.  The destruction of certain industries, resources, and capabilities will become very real over time as a result of any extended contraction event.  The longer-term results of this type of event are sometimes called “stagflation” – where price levels rise as income and economic output stay moderately flat.

BEFORE WE CONTINUE, BE SURE TO OPT-IN TO MY FREE MARKET TREND SIGNALS SO YOU DON’T MISS OUR NEXT SPECIAL REPORT!

Custom Smart Stock Market Index

Our Custom Smart Cash Index highlights the “new price channel” that setup recently and why all traders/investors should really start to pay attention to how the global markets have transitioned into a new phase or price cycle.  You can see from the chart, below, that the global markets broke below an upward price channel that has been in place since 2012 recently and has established a new downward price channel spanning the December 2018 lows to the February 2020 highs.

We believe the current upward price trend on this chart is nothing more than a “bullish retracement in a bearish trend” and that the global markets will begin another downside price move within 5 to 10+ days.  As we’ve been trying to share with you over the past few weeks, the longer-term global economic disruption is just getting started.

US Dollar Daily Chart

We believe the US Dollar will enter a new phase of increasing demand throughout the world as global economies begin to feel the pressures of the demand-side collapse.  We believe the US dollar is uniquely positioned to benefit from the global economic crisis simply because the US economy is the biggest and most capable economies on the planet in terms of the ability to recover from this virus event.  As foreign nations attempt to deal with weakening currencies and economies related to the collapse in demand and continued virus-related economic transitions, we believe the US economy will be one of the first global economies to regain any real growth over the next 2 to 3+ years.

Thus, we believe the US Dollar may attempt another quick downside valuation move, similar to what happened in February/March 2020, then rally to levels above 102 again as continued economic data hit the markets.  Remember, valuation levels of currencies are often based on future expectations of economic stability and capability for any nation.  The US Dollar is a bit different because it is also the “currency of choice” in terms of global economic activity.  We believe the US Dollar could begin a moderate “melt-up” process as the virus data continues to scorch the world’s economic output.

Concluding Thoughts:

These longer-term economic expectations are key to understanding how the recovery process will create opportunities for skilled traders and investors.  We believe the world will survive this virus event.  Yet, we also believe the global economic landscape will likely change over the next 3+ years as this virus event could very easily push many foreign nations away from economic relationships or projects they have engaged in over the past 10+ years.  This virus event is really a “big game-changer” in terms of how and what the future of the global economic world will look like for many.

As we’ve warned many times, it is not the localized “one-off” economic event that presents a real problem for the global economy – central banks can simply patch the economy up with an infusion of cash.  The bigger problems for the global economy happen when a fundamental shift takes place that lasts 6 to 12+ months and disrupts the “systems” in place throughout the globe.  We believe this virus event could start a process that disrupts supply, demand, consumer engagement, and true valuation levels of almost all commodities and assets throughout the globe over the next 24+ months.

In Part II of this article, we’ll attempt to share more data and highlight where opportunities may present real profit objectives for skilled investors and traders.

The next few years are going to be full of incredible opportunities for skilled traders and investors.  Huge price swings, incredible revaluation events, and, eventually, an incredible upside rally will start again.

I’ve been trading since 1997 and I’ve lived through numerous market events.  The one thing I teach my members is that risk is always a big part of trading and that’s why I structure all of my research and trading signals around “finding profits while reducing overall risks”.  Sure, there are fast profits to be made in these wild market swings, but those types of trades are extremely risky for most people – and I don’t know many successful traders that want to risk their hard-earned money when daily price swings in various assets are moving 10% to 95%.

I’m offering you the chance to learn to profit, as I do with my own money from market trends that I hand-pick for my own trading.  These are not wild, crazy trades – these are simple, effective, and slower types of trades that consistently build wealth.  I issue about 2 to 4+ trades a month for my members and adjust trade allocation based on my proprietary allocation and risk algo – the objective is to gain profits while managing overall risks.

You don’t have to spend days or weeks trying to learn my strategy.  You don’t have to try to learn to make these decisions on your own or follow the markets 24/7 – I do that for you.  All you have to do is follow my research and trading signals and start benefiting from my trading experience.  My new mobile apps make it simple – download the app, sign in and everything is delivered to your phone, tablet, or desktop – updates, videos, education, and trade alerts.

I offer membership services for active traders, long-term investors, and wealth/asset managers.  Each of these services is driven by my own experience and my proprietary trading and risk modeling systems.  I have a small team of dedicated researchers and developers that do nothing but research and find trading signals for us to take advantage of together. Our objective is to help you protect and grow your wealth.

Please take a moment to visit TheTechnicalTraders.com to learn more.  I cannot say it any better than this…  I want to help you create success while helping you protect and preserve your wealth – it’s that simple.

Chris Vermeulen
Chief Market Strategist


How this “Popular Bull-Market Strategy” Can Backfire — Big Time

By Elliott Wave International

– “Buying the dip” might work in a rip-roaring bull market, but it can cost you your shirt in a severe downturn.

Even so, this March 23 Wall Street Journal quote represents the mindset of many global investors:

I’m Scared. That’s a Reason to Buy.
The true contrarian only buys when it makes him feel physically sick to press the buy key.

This was a more dramatic version of the clarion call from a number of financial websites in late February to “hang in there.”

But, “hanging in there” and “buy the dip” are much more dangerous propositions in a ferocious bear market — especially for the “buy and hold” crowd.

Elliott Wave International’s April Global Market Perspective provides a history lesson with this chart of Germany’s main stock index during the bear market years from 2000 to 2003:

Over the course of a financially catastrophic 73% decline, the index experienced at least eight countertrend bounces of 10% or more. The largest rally — a 54% behemoth that followed the World Trade Center attacks in the United States in September 2001 — petered out by March 2002. Any dip buyers who got lured back in went on to suffer a disastrous 60% sell-off into the final bottom. And even the few investors who perfectly timed the September 2001 low lost 38% over the next 18 months.

Now, some market observers may say that investors who “hold” or “buy the dip” throughout a deep bear market will eventually come out ahead during the next bull phase.

Probably. Except, it may be years away. Japan’s NIKKEI, for example, famously topped in 1989 and has not revisited that high since. China’s Shanghai Composite topped in 2007 and has similarly stayed subdued. How many years will most investors wait before they “throw in the towel”?

Moreover, badly battered investors are afraid to commit to a new uptrend just when it’s the most advantageous time to do so. At this point, shaken investors believe up days in the market are “head-fakes.”

Indeed, the market has a way of fooling most investors at key market junctures.

By contrast, learning the rules and guidelines of Elliott wave analysis can help an investor anticipate significant trend turns in financial markets.

Read this quote from the Wall Street classic book, Elliott Wave Principle: Key to Market Behavior, by Frost & Prechter:

By knowing what Elliott rules will not allow, you can deduce that whatever remains is the proper perspective, no matter how improbable it may seem otherwise. By applying all the rules of extensions, alternation, overlapping, channeling, volume and the rest, you have a much more formidable arsenal than you might imagine at first glance. Unfortunately for many, the approach requires thought and work and rarely provides a mechanical signal. However, this kind of thinking, basically an elimination process, squeezes the best out of what Elliott has to offer and besides, it’s fun! We sincerely urge you to give it a try.

And, there’s no better time to give it a try than now.

Indeed, Elliott Wave International is now offering a 1-hour course (through May 15) on how to identify an Elliott wave pattern on a price chart. Plus, you’ll get insights on how to develop a trading plan to take advantage of your new-found knowledge.

The title of the course is The Wave Principle Applied and it’s free to Club EWI members. Joining Club EWI is also free. Join now to take advantage of this limited-time offer.

US Stock Market Enters Twilight Zone

By TheTechnicalTraders 

– The US stock market has rallied substantially since the bottom on March 23, 2020.  Our Adaptive Fibonacci Price Modeling system is showing us just how fragile the US stock market and certain sectors of the markets really are right now.  What’s going to happen next and how should you prepare for the next big move?  Let us try to explain our beliefs.

First, the US stock market bottom just as the US Senate and Fed announced major stimulus packages designed to support the collapsing markets.  Everything done prior to the March 23 date was “fodder” as the risk to the global markets was far greater than anything the US Fed or global central banks could muster.  On March 23, the US Fed initiated an unlimited asset purchase program to support the failing markets.  This changed the perspective of traders/investors immediately – but it also created a massive risk factor that few even considered. For a complete timeline on the US Fed actions, review this link.

Our own research team was calling for a breakdown in the US and global markets many months in advance of this move – even before the world knew about the Chinese/Wuhan virus event.  Take a look at some of our research posts from the past

January 26, 2020: The Black Swan Event Begins

January 29, 2020: Are We Setting Up For A Waterfall Selloff?

February 18, 2020: Is The Technology Sector Setting Up For A Crash? Part II

Less than 3 days prior to the massive selloff event, we posted this:

February 24, 2020: Has The Equities Waterfall Event Started Or A Buying Opportunity?

Today, we are posting this research article to highlight the unique setup in many of the major US stock indexes and sectors.  Using our Adaptive Fibonacci Price Modeling system, two things become clearly evident in the charts…

A.  Price must hold above support levels (the upper TRIGGER ZONE level and/or the GREEN Fibonacci Trigger level on the right side of the chart) in order for the uptrend to continue.

B.  Price has already reached (in most cases) the CYAN Fibonacci projected target level and this level may turn into major resistance pushing the price back into a downtrend.

Before we continue, be sure to 
opt-in to my free market trend signals 
so you don’t miss our next special report!

Daily SPY Chart

This first Daily SPY chart clearly highlights the setup we are describing.  First, take a look at the CYAN line on the chart near the 282.97 level.  This Fibonacci target level becomes support when price moves above it and becomes resistant when price moves below it.  Currently, the SPY is trading very near to the 283 level and we believe this level may turn into massive resistance over the next 5 to 10+ days.

Secondly, take a look at the TRIGGER ZONE on this chart (a price zone drawn between the Bullish and Bearish Fibonacci price trigger levels).  This zone represents a very dangerous price area where the overall price trend may change directions and where volatility could explode. As long as the price stays above this zone, then moderate bullish price activity should be expected.

If the price falls below this zone, then moderate to strong bearish price activity should be expected.  The reason why the downside risk is much greater than the upside potential is because of the recent downtrend in the market that sets up a “recent higher high” near 295.50.

Monthly SPY Chart

This Monthly SPY chart highlights the longer-term Fibonacci price analysis.  The extreme breakdown in price has already broken below the RED Fibonacci Bearish price trigger level near $300 and broken through the BLUE initial target level near $279.00.  The next downside price target levels are GREY, near $173.40, and RED, near $128.00.  Currently, the SPY price has rallied back above the BLUE target level and is stalling near $282~285.  This price level is already below the $300 Bearish Trigger level – which suggests further downside price activity in our future.

Additionally, pay attention to the “arcs” that are on this Monthly chart.  These are our proprietary Fibonacci Price Amplitude Arcs that show us where price may target based on a theory that each price trend creates “price amplitude waves” into the past and future.  Currently, the “4D” area on this chart is our most likely bottom area.  There is also a “1.618” GREEN price arc that is just above the current price level (near $292).  We believe this Green 1.618 level is acting as major resistance and that price will reverse back to the downside within a 5 to 10-day window.

Weekly Transportation Index Chart

This Weekly TRAN, Transportation Index, chart highlights a similar pattern but also shows how much downside pricing pressure is still evident across different sectors of the markets.  Even though the ES, NQ, and YM have rallied to near 50% to 61% of the initial downside price move, the Transportation Index has only recovered to the 38.2% Fibonacci Retracement level.  This suggests that the US Fed and global central banks have poured capital into the blue chips and technology sectors while leaving much of the broader market bloodied and on the sidelines.

A similar type of setup is appearing in this TRAN chart.  The CYAN target level has been reached and the price has stalled just above this level.  The TRIGGER ZONE is clearly evident on the chart and the price is slightly above that level right now.  Very clear downside price targets are evident (RED, Blue and GREY) and any price move below $7565 will likely prompt a much bigger downside price move.  What we are seeing in the markets is that any substantial downside price rotation will potentially set up a much bigger downside price collapse in the US and global markets.

Weekly XLF Chart

This Weekly XLF chart, the Financial Sector SPDR ETF, sets up almost identical to the TRAN chart.  Deeper price targets, the price has already reached the CYAN target level and stalled recent downside price rotation, and a very real possibility that any downside price move could breach the Fibonacci Bearish Price Trigger Level near $21.

What happens if, suddenly, the US and global markets roll lower by 5% to 10% and a new wave of selling panics the markets?

Concluding Thoughts:

The answer is that the US and global markets will attempt to reach the most recent low price levels, or one of the deeper Fibonacci bearish target levels on these charts, and attempt to find support (or true market value) before attempting any move higher.  One must understand that until price shows us that it is capable of rallying above all-time highs, there is still a very real risk that another downside price move could take place.

These TRIGGER ZONES are key to understanding where the fragile balance in price is located on these symbols. As long as price stays above this zone, then continued bullish price action should be expected. If the price falls below this zone, then more downside price activity should be expected.

If you pay very close attention to almost all of these charts, you’ll notice that the next Fibonacci upside price targets (above the CYAN level) are well above the most recent all-time high levels.  This suggests that price will have to rally well above these all-time high levels to qualify the next bullish price target.  It could happen if the global markets recover much quicker than we expect and the earnings/GDP damage is minimal.  But given what we believe is really happening throughout the world right now, the downside targets seem more realistic outcomes (unless the US Fed and global banks absorb $40 to $50 Trillion in global risk assets over the next 60 days.

Watch how the markets react to these price levels and how the longer-term price pivots setup on these Weekly/Monthly charts.  The price will tell us where it wants to go.  We just have to be on the right side of the move so we don’t get slaughtered by a sudden price move.

As a technical analyst and trader since 1997, I have been through a few bull/bear market cycles in stocks and commodities. I believe I have a good pulse on the market and timing key turning points for investing and short-term swing traders. 2020 is an incredible year for traders and investors.  Don’t miss all the incredible trends and trade setups.

Subscribers of my ETF Swing Trading Newsletter had our trading accounts close at a new high watermark. We not only exited the equities market as it started to roll over in February, but we profited from the sell-off in a very controlled way with TLT bonds for a 20% gain. This week we closed out SPY ETF trade taking advantage of this bounce and entered a new trade with our account is at another all-time high value.

Ride my coattails as I navigate these financial markets and build wealth while others watch most of their retirement funds drop 35-65% during the next financial crisis.

Just think of this for a minute. While we all have trading active trading accounts, what is even more important are our long-term investment and retirement accounts. Why? Because they are, in most cases, our largest store of wealth other than our homes, and if they are not protected during the next bear market, you could lose 25-50% or more of your net worth. The good news is we can preserve and even grow our long term capital when things get ugly like they are now and ill show you how and one of the best trades is one your financial advisor will never let you do because they do not make money from the trade/position.

If you have any type of retirement account and are looking for signals when to own equities, bonds, or cash, be sure to become a member of my Long-Term Investing Signals which we issued a new signal for subscribers.

Chris Vermeulen
Chief Market Strategies
TheTechnicalTraders.com


Over-action or inaction – both could hit your wealth, warns deVere CEO

By George Prior

Stress in the financial markets is prompting a growing number of people to make extreme investment decisions that could ultimately hit their wealth, warns the CEO of one of the world’s largest independent financial advisory organizations.

The warning from Nigel Green, chief executive and founder of deVere Group, comes as all major markets are in bear territory and are highly susceptible to coronavirus-related developments.

Mr Green comments: “It’s been our experience in recent weeks that, driven by the current unusual circumstances, a growing number of people are becoming more extreme in their investment decisions.

“The world has changed since the pandemic and this has, of course, directly impacted the investment landscape.

“Therefore, it is sensible that the fast-changing situation is closely and carefully monitored by investors.

“However, the unprecedented, emotional and all-encompassing nature of it is leading many into two distinct camps: over-action or inaction. Both could spell disaster for people’s long-term investment strategies.”

He continues: “Those in the over-action category are seeing anything and everything – regardless of the tried and tested benchmarks and criteria – as a massive buying opportunity.

“Being over confident and over-leveraging can lead to bad investment choices.  This was shown by the dramatic market sell-offs following the bursting of the dot com bubble in 2000, and the 2008 global financial crash.”

The deVere CEO goes on to say that on the other end of the scale there are those whose investment decision-making is now overtaken fear.

“On the flipside, an overly pessimistic attitude is leading too many investors to do little or nothing to create and build their wealth.

“They’ve become paralysed by the fear that a global recession will hurt corporate earnings, and that this means that there’s no value in the market currently. As such, they sit inactively on the sidelines, potentially missing major opportunities in the process.”

Mr Green adds: “Too many investors are being led by their emotions which can lead to over-action or inaction.

“Now more than ever, emotions should not be centre-stage in the investment decision-making process.

“Cool heads and a long-term strategy are the best way to handle market shocks.”

He concludes: “There’s always a better way than emotions to make investment decisions.

“This is why many investors prefer to use strategies that lock them into an investment approach that overrides their changing moods.”

About:

deVere Group is one of the world’s largest independent advisors of specialist global financial solutions to international, local mass affluent, and high-net-worth clients.  It has a network of more than 70 offices across the world, over 80,000 clients and $12bn under advisement.