Author Archive for InvestMacro – Page 49

Oil price: futures markets warn it won’t recover after coronavirus

By Mark Shackleton, Lancaster University

West Texas Intermediate (WTI) crude went negative for the first time in history this month as oil traders got stuck between a mammoth oversupply and lack of places to store it. The international price of “black gold” remains at the bottom of the barrel.

Oil producers are struggling to shut down their units or to find environmentally acceptable alternatives to dumping product. Sea tankers are finding it difficult to offload and are readjusting routes in their hunt for potential takers, but it’s not easy: COVID-19 has killed demand for oil everywhere.

WTI is trading at about US$17, while the Brent equivalent is around US$25, still the sort of levels where much global oil production is not profitable. Brent and WTI are the two main grades of oil that are used to benchmark prices around the world, with Brent found offshore and being of slightly higher quality than its onshore American counterpart.

More tolerable prices may return soon if the oversupply levels off and then global demand rises as lockdown restrictions are relaxed. But what are the longer term prospects for the price of oil, and how have they been affected by COVID-19?

Energy prices and time periods

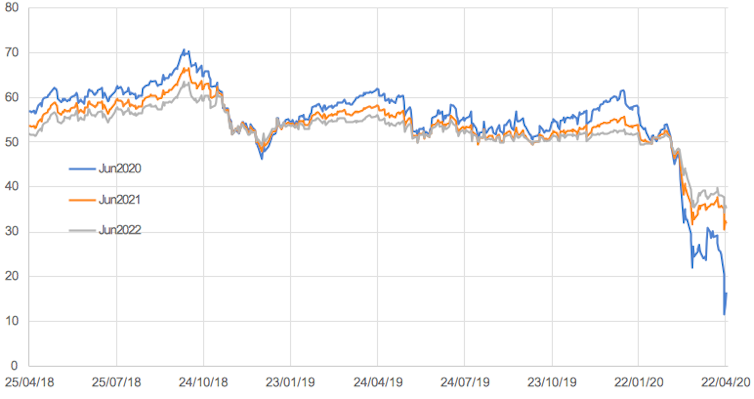
The future price of oil is normally cheaper than the current, or “spot”, price. This reflects the fact that those willing to underpin future oil production with early orders usually get a discount. This can be seen in the graph below, which shows the prices of trading contracts over the past couple of years for oil for delivery in June 2021 (orange) and 2022 (grey) compared to the “spot” price, which is currently June 2020. This year, the normal order from least to most expensive has reversed.

WTI price in US$ for delivery, June 2020-22
Contango and cash.
Intercontinental Exchange

This crossover of spot and future prices is known as a contango, or short-term glut. This is certainly not the first contango in energy trading – electricity markets have periods of overgeneration in which producers pay consumers to take power that would damage the generating station otherwise.

Indeed, these events are becoming more common because of the world’s transition from types of energy that can be stored, such as oil, to those that cannot, such as wind and solar power. We’re seeing these events not just in the UK but across the world.

In the present case, the reason for the oil contango is basically that investors think that prices will improve in future as economies recover. The contango is greater than during the financial crisis of 2007-09. Incidentally, there’s no equivalent shift in the price of gas (LNG). The gas price has been supported by the fact that electricity demand has been higher because of everyone being at home during lockdown.

After COVID-19

The previous graph also tells us that investors don’t think the price of oil is going to recover to anywhere near pre-coronavirus levels by June 2022. Two years from now, they think the price will be somewhere between US$30 and US$40.

Even when we look at data for the mid-2020s, the sort of timescale in which you would hope COVID-19 has ceased to be a problem, the markets still don’t foresee a return to previous levels. Contracts for WTI oil in December 2026 are currently trading at slightly under US$46, compared to US$50 to US$55 historically. This time last year, they were trading at US$54.

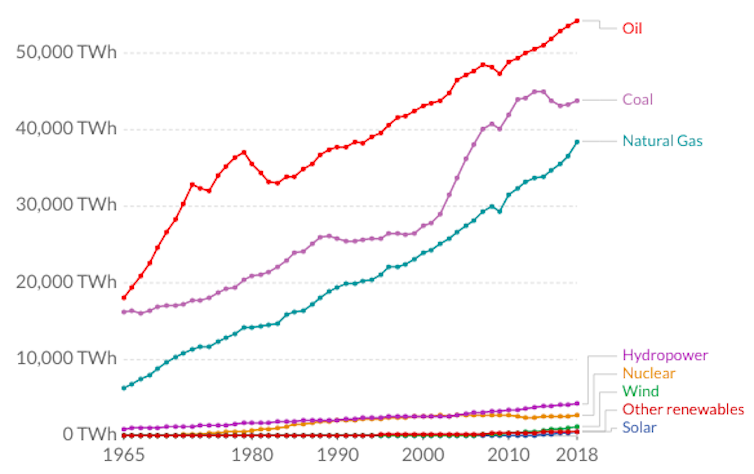
It was already likely to be the case that demand for fossil fuels would decline in the coming years as they face increasing competition from renewable electricity powering everything from home central heating to cars and buses. Coal consumption has peaked, though oil has had at least one advantage. Its high energy density and portability make it hard to replace in aviation, assuming the airline industry becomes viable again. On the other hand, increased tele-working during the pandemic may spur the decline of the daily commute and possibly business trips too.

World energy consumption (TWh) 1965-2018
Our World in Data

This change is reflected in the share prices of the oil majors. Operators such as Exxon and Shell, which have historically been seen as very safe investments, are down 40% since January compared to an overall stock market decline of about 15%.

These are traditionally high dividend payers, though Shell just cut its dividend for the first time since the second world war. Yet even if the current supply glut costs these companies one or two years of reduced earnings and lost dividends, this can’t account for the magnitude of their declines.

Share prices of top five oil majors vs S&P500
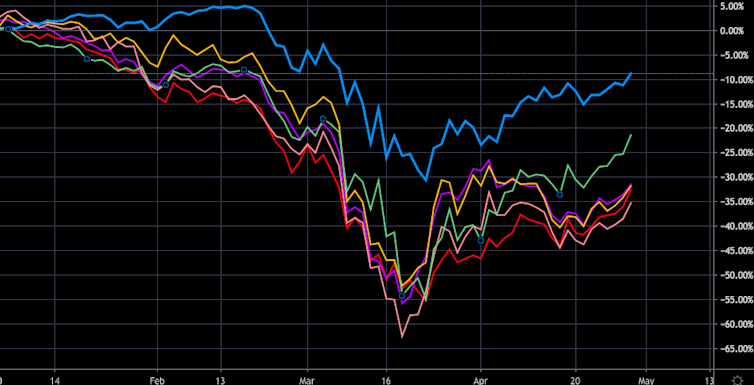
S&P500 = blue; Shell = pink; BP = yellow; Chevron = green; Total = purple; Exxon = red.
Trading View

The fact that Saudi Arabia has been trying to sell part of its assets by listing Saudi Aramco, the world’s largest oil owner, on the stock market, was itself a signal that they may think the most lucrative years are behind this industry. It had been hoping for a US$2 trillion listing on one of the world’s leading stock markets, but this is now looking less likely. Aramco has scaled down to the local Riyadh Tawadul exchange, with an implied valuation of US$1.5 billion.

The firm had promised to pay total dividends of US$75 billion this year, but this looks a tall order from company cash flows at the current oil price. The signals about future prices will be doing little to reassure investors about buying shares, since they had been holding these stocks for their high dividend yield and now that is getting cut.

So while the transition from oil was already underway, the global COVID-19 lockdown appears to have accelerated it. Oil remains essential for transport, but not as much as before – and gas and renewables continue to increase their share of energy generation. It could well be that COVID-19 has done more for the green revolution than any climate summit.The Conversation

About the Author:

Mark Shackleton, Professor of Finance, Lancaster University

This article is republished from The Conversation under a Creative Commons license. Read the original article.

Gold and Silver: Pay Attention to This Noteworthy Record High

Here’s what usually occurs in related financial markets when “big changes in social mood are afoot”

By Elliott Wave International

Related financial markets tend to move together. For example, gold and silver.

Or, consider stocks. When the Dow Industrials are up on a given trading day, the NASDAQ is usually in the green too. The same applies when the Dow is down. Other major stock indexes tend to close in negative territory as well.

However, when a trend is near exhaustion — whether bullish or bearish — “non-confirmations” often happen. A non-confirmation occurs when one market makes a new high (or low), but a related market does not.

Let’s stick with the example of stocks as we look at this chart and commentary from Elliott Wave International’s November 2019 Global Market Perspective:

Notice that while the FTSE 100 is off 6% since its May 2018 high, the Small-Cap index and the AIM 100 are down 9% and 23%, respectively. These non-confirmations are important, because markets almost always splinter when big changes in social mood are afoot. … It’s only a matter of time before the broad indexes abandon the bull-market party.

As we all know, abandon it they did — in a very dramatic way.

Now, let’s look at what’s going on with gold and silver.

Here’s a chart and commentary from EWI’s April 27, 2020 U.S. Short Term Update:

Gold is massively overvalued relative to physical commodities and the ratio of gold-to-silver recently jumped to a record high. There remains a large non-confirmation between gold and silver.

Even so, here’s an April 21 headline (CNBC):

Bank of America raises gold forecast by a whopping $1,000 to $3,000 because of zero rates

Well, this major bank’s outlook for gold might turn out to be correct.

On the other hand, it’s obvious — as you’ve just seen — that the gold and silver markets are significantly splintered.

Plus, the Elliott wave model is also providing clues about the next big moves in the gold and silver markets.

And, speaking of Elliott wave analysis, EWI has just made available a 1-hour course titled: The Wave Principle Applied. You can access this valuable resource 100% free through May 15, 2020.

How?

Simply join Club EWI. Membership is also free.

When you avail yourself of The Wave Principle Applied, you will learn how to spot Elliott wave patterns on a price chart. Plus, you’ll acquire trading insights.

As Frost & Prechter’s Elliott Wave Principle: Key to Market Behavior noted:

After you have acquired an Elliott “touch,” it will be forever with you, just as a child who learns to ride a bicycle never forgets. Thereafter, catching a turn becomes a fairly common experience and not really too difficult. Furthermore, by giving you a feeling of confidence as to where you are in the progress of the market, a knowledge of Elliott can prepare you psychologically for the fluctuating nature of price movement and free you from sharing the widely practiced analytical error of forever projecting today’s trends linearly into the future. Most important, the Wave Principle often indicates in advance the relative magnitude of the next period of market progress or regress.

Simply follow the link for your free membership into Club EWI, and then you can access The Wave Principle Applied — 100% free — through May 15 (EWI normally sells the course for $99).

This article was syndicated by Elliott Wave International and was originally published under the headline Gold and Silver: Pay Attention to This Noteworthy Record High. EWI is the world’s largest market forecasting firm. Its staff of full-time analysts led by Chartered Market Technician Robert Prechter provides 24-hour-a-day market analysis to institutional and private investors around the world.

Fed Cut Equities Stimulus 86% This Week and Stocks Are Falling

By TheTechnicalTraders

What happens to the global markets when the US Fed begins to weaken stimulus activity and when the global markets must begin to function on their own?  Are the global markets capable of sustaining current price levels without the Fed supporting them?

A recent news article suggests the US Fed has drastically slashed stimulus activity over the past 5+ days.  From a peak level of nearly $600 Billion a week to current levels near $83 Billion per week – a -86% decrease.  How will this reflect in the market’s ability to sustain current price levels in the face of disastrous Q2 expectations? Yup, markets are falling fast and hard going into the weekend as expected!

Before closing this page, be sure to opt-in to our free market trend signals, so you don’t miss our next special report!

Buffet Indicator

Another common tool for skilled traders is the Buffet Indicator which helps us understand stock market valuation levels and measures extreme trends by measuring Standard Deviation ranges. Currently, the Buffet Indicator is near the highest levels ever recorded over the past 60+ years.  Additionally, a “detrended” version of the Buffet Indicator suggests a broader global recession would require a further devaluation before a true bottom is likely to complete.

This first Buffet Indicator chart shows the current market value to GDP and highlights the recent peak as being the highest level ever recorded.  Notice how this level is much higher than the peak in 2000.  This indicates that the stock market valuation level is excessive compared to historical norms.

Detrended Buffet Indicator

This Detrended Buffet Indicator suggests the recent peak may not reflect the same excessive valuation levels as we experienced in 2000, yet are historically near the upper range of extended valuation levels.  Notice how price devalues as a process of setting up a valuation advance throughout time. When prices become overvalued (think of simple supply/demand theory), demand typically collapses – sending prices lower. At this time, we have the global Covid-19 virus event disrupting the demand-side of this equation.  When demand collapses, where do prices go?

Our research team believes the current trend will eventually end and global stock market prices will collapse again as a much deeper price low/bottom sets up.  Skilled traders need to understand that as long a the US Fed was pouring $600 Billion a week into the credit/stock market, the recovery in price was going to be substantial.  Once that stimulus ends and the markets are left to function on their own, the aspects of the demand collapse become more evident.

In a way, the Fed acted as a “demand supplement” for the US and global markets.  Buying up assets and supporting the credit markets in an effort to transition us past the crisis event that took place in late February and March 2020.  How quickly will the global markets transition back into a declining mode in the continues to stay passive?

Custom US Stock Market Index – Weekly Index

Our original targets where price may attempt to form a deeper bottom near the 2015~2016 price range is still very valid.  Near the peak of the recent selloff, price levels reached these predicted levels just before the US Fed began the stimulus programs. Now, price levels are nearly 35%+ above these low price levels.

Chart By: TradingView.com

Custom SmartCash Index – Weekly Chart

It seems obvious to our research team that continued lack of consumer demand and lack of central bank intervention will likely result in the US stock market moving lower in the near future and attempting to establish a true price bottom.  We believe that bottom will likely happen near July or August 2020 and will likely reach levels near, or below, the 2015~2016 price range but this analysis will change as we progress forward with new events and analysis.

You can see our predicted price bottom on this Weekly Smart Cash Index chart.  The lines we’ve drawn into the future show where we believe the first attempt at a true price bottom may take place near July or August 2020.

Chart By: TradingView.com

Concluding Thoughts:

Remember, this type of price rotation is very healthy for the US and global markets.  The price must rotate through these types of trends to eliminate excessive risk/froth and to secure a proper price equilibrium where valuation levels can begin to appreciate again.  This process is almost cathartic in a sense.  The ability to regain a “true valuation base/bottom” in price (consider Fibonacci Price Theory) allows the future appreciation cycle to function more efficiently (having eliminated excessive risk valuations).

We will get through this and the global economy will continue to function.  We just have to get through the next 6+ months and the relative economic disaster of Q2 and Q3 (likely) before we’re going to see any real chance at true price appreciation.

At this point, when the Fed-induced upside trend breaks – watch out below.

As a technical analyst and trader since 1997, I have been through a few bull/bear market cycles in stocks and commodities. I believe I have a good pulse on the market and timing key turning points for investing and short-term swing traders. 2020 is an incredible year for traders and investors.  Don’t miss all the incredible trends and trade setups.

Subscribers of my Active Swing Trading Newsletter had our trading accounts close at a new high watermark. We not only exited the equities market as it started to roll over in February, but we profited from the sell-off in a very controlled way with TLT bonds for a 20% gain. This week we closed out SPY ETF trade taking advantage of this bounce and entered a new trade with our account is at another all-time high value.

Ride my coattails as I navigate these financial markets and build wealth while others watch most of their retirement funds drop 35-65% during the next financial crisis.

Just think of this for a minute. While most of us have active trading accounts, what is even more important are our long-term investment and retirement accounts. Why? Because they are, in most cases, our largest store of wealth other than our homes, and if they are not protected during the next bear market, you could lose 25-50% or more of your net worth. The good news is we can preserve and even grow our long term capital when things get ugly like they are now and ill show you how and one of the best trades is one your financial advisor will never let you do because they do not make money from the trade/position.

If you have any type of retirement account and are looking for signals when to own equities, bonds, or cash, be sure to become a member of my Passive Long-Term Investing Signals which we issued a new signal for subscribers.

Chris Vermeulen
Chief Market Strategies
TheTechnicalTraders.com


How Apple and Google will let your phone warn you if you’ve been exposed to the coronavirus

By Johannes Becker, Boston University and David Starobinski, Boston University

On April 10, Apple and Google announced a coronavirus exposure notification system that will be built into their smartphone operating systems, iOS and Android. The system uses the ubiquitous Bluetooth short-range wireless communication technology.

There are dozens of apps being developed around the world that alert people if they’ve been exposed to a person who has tested positive for COVID-19. Many of them also report the identities of the exposed people to public health authorities, which has raised privacy concerns. Several other exposure notification projects, including PACT, BlueTrace and the Covid Watch project, take a similar privacy-protecting approach to Apple’s and Google’s initiative.

So how will the Apple-Google exposure notification system work? As researchers who study security and privacy of wireless communication, we have examined the companies’ plan and have assessed its effectiveness and privacy implications.

Recently, a study found that contact tracing can be effective in containing diseases such as COVID-19, if large parts of the population participate. Exposure notification schemes like the Apple-Google system aren’t true contact tracing systems because they don’t allow public health authorities to identify people who have been exposed to infected individuals. But digital exposure notification systems have a big advantage: They can be used by millions of people and rapidly warn those who have been exposed to quarantine themselves.

Bluetooth beacons

Because Bluetooth is supported on billions of devices, it seems like an obvious choice of technology for these systems. The protocol used for this is Bluetooth Low Energy, or Bluetooth LE for short. This variant is optimized for energy-efficient communication between small devices, which makes it a popular protocol for smartphones and wearables such as smartwatches.

Image by Gerd Altmann / Pixabay

Bluetooth LE communicates in two main ways. Two devices can communicate over the data channel with each other, such as a smartwatch synchronizing with a phone. Devices can also broadcast useful information to nearby devices over the advertising channel. For example, some devices regularly announce their presence to facilitate automatic connection.

To build an exposure notification app using Bluetooth LE, developers could assign everyone a permanent ID and make every phone broadcast it on an advertising channel. Then, they could build an app that receives the IDs so every phone would be able to keep a record of close encounters with other phones. But that would be a clear violation of privacy. Broadcasting any personally identifiable information via Bluetooth LE is a bad idea, because messages can be read by anyone in range.

Anonymous exchanges

To get around this problem, every phone broadcasts a long random number, which is changed frequently. Other devices receive these numbers and store them if they were sent from close proximity. By using long, unique, random numbers, no personal information is sent via Bluetooth LE.

Apple and Google follow this principle in their specification, but add some cryptography. First, every phone generates a unique tracing key that is kept confidentially on the phone. Every day, the tracing key generates a new daily tracing key. Though the tracing key could be used to identify the phone, the daily tracing key can’t be used to figure out the phone’s permanent tracing key. Then, every 10 to 20 minutes, the daily tracing key generates a new rolling proximity identifier, which looks just like a long random number. This is what gets broadcast to other devices via the Bluetooth advertising channel.

When someone tests positive for COVID-19, they can disclose a list of their daily tracing keys, usually from the previous 14 days. Everyone else’s phones use the disclosed keys to recreate the infected person’s rolling proximity identifiers. The phones then compare the COVID-19-positive identifiers with their own records of the identifiers they received from nearby phones. A match reveals a potential exposure to the virus, but it doesn’t identify the patient.

Most of the competing proposals use a similar approach. The principal difference is that Apple’s and Google’s operating system updates reach far more phones automatically than a single app can. Additionally, by proposing a cross-platform standard, Apple and Google allow existing apps to piggyback and use a common, compatible communication approach that could work across many apps.

No plan is perfect

The Apple-Google exposure notification system is very secure, but it’s no guarantee of either accuracy or privacy. The system could produce a large number of false positives because being within Bluetooth range of an infected person doesn’t necessarily mean the virus has been transmitted. And even if an app records only very strong signals as a proxy for close contact, it cannot know whether there was a wall, a window or a floor between the phones.

However unlikely, there are ways governments or hackers could track or identify people using the system. Bluetooth LE devices use an advertising address when broadcasting on an advertising channel. Though these addresses can be randomized to protect the identity of the sender, we demonstrated last year that it is theoretically possible to track devices for extended periods of time if the advertising message and advertising address are not changed in sync. To Apple’s and Google’s credit, they call for these to be changed synchronously.

But even if the advertising address and a coronavirus app’s rolling identifier are changed in sync, it may still be possible to track someone’s phone. If there isn’t a sufficiently large number of other devices nearby that also change their advertising addresses and rolling identifiers in sync – a process known as mixing – someone could still track individual devices. For example, if there is a single phone in a room, someone could keep track of it because it’s the only phone that could be broadcasting the random identifiers.

Another potential attack involves logging additional information along with the rolling identifiers. Even though the protocol does not send personal information or location data, receiving apps could record when and where they received keys from other phones. If this was done on a large scale – such as an app that systematically collects this extra information – it could be used to identify and track individuals. For example, if a supermarket recorded the exact date and time of incoming rolling proximity identifiers at its checkout lanes and combined that data with credit card swipes, store staff would have a reasonable chance of identifying which customers were COVID-19 positive.

And because Bluetooth LE advertising beacons use plain-text messages, it’s possible to send faked messages. This could be used to troll others by repeating known COVID-19-positive rolling proximity identifiers to many people, resulting in deliberate false positives.

Nevertheless, the Apple-Google system could be the key to alerting thousands of people who have been exposed to the coronavirus while protecting their identities, unlike contact tracing apps that report identifying information to central government or corporate databases.

About the Authors:

Johannes Becker, Doctoral student in Electrical & Computer Engineering, Boston University and David Starobinski, Professor of Electrical and Computer Engineering, Boston University

This article is republished from The Conversation under a Creative Commons license. Read the original article.

COVID-19 is a dress rehearsal for entrepreneurial approaches to climate change

By Jeffrey York, University of Colorado Boulder

As the U.S. struggles to control the COVID-19 pandemic, some experts have suggested that we can learn something about how to address climate change from this crisis.

Climate and social policy experts are recommending green stimulus packages to restart the economy. As a professor of sustainability and entrepreneurship, I see COVID-19 bringing the predicted future human health implications of climate change to horrifying life. Like COVID-19, climate change could increase respiratory illness and strain infrastructure.

However, just as with COVID-19, entrepreneurship can offer solutions to these challenges.

Searching for a solution

Saving small businesses is a central part of recovering from the pandemic. At the same time, entrepreneurs are innovating to preserve their business and help address the challenges of COVID-19.

The same thing is already happening with climate change. When entrepreneurs offer solutions that create simultaneous ecological and economic benefits, it is called “environmental entrepreneurship.” My research shows that such entrepreneurship happens in three ways.

First, successful environmental entrepreneurs tend to see themselves as both environmentalists and businesspeople. Because of this, they often recruit investors, employees and customers from a broader group than traditional startups. Some offer a hope of reducing carbon emissions through new technologies. Others are small business heroes, creating jobs and building new industries.

Second, environmental entrepreneurs are attuned to different signals than large firms are.

While they are encouraged by environmentalist beliefs, we have also found that the importance of family can predict the number of environmental entrepreneurs in a state. Our research shows that solar energy companies are more likely to form in states that value not only the environment, but also family relationships.

Further, while large firms tend to respond to government-driven policy and economic indicators, environmental entrepreneurs respond to more subtle signals, such as local values. In the green building industry, environmental entrepreneurs ignore economic indicators, but are encouraged by local beliefs and activism. In short, they move first, taking on risk before the evidence is in.

Third, environmental entrepreneurs make a difference. We looked at the effect of various policies, activism and business practices on the adoption of new technologies like green building and renewable energy. We then divided the U.S. into more politically conservative and liberal regions to see whether policies, activism or business practices mattered more under different norms.

We found that the only consistent factor that increased green building adoption in both types of political environments was the number of environmental entrepreneurs. These findings suggest that when a critical mass of entrepreneurship occurs, the political divide on climate change fades away, and we see a rapid uptick in adoption of environmentally beneficial practices.

Image by 272447 / Pixabay

Climate conclusions

A variety of proposals before Congress would encourage a green recovery by focusing on policy to simultaneously address climate change and the recession, but these plans will likely become mired in the political debate that entangled the Green New Deal.

Here’s what I’d suggest. Laser-focus on the creation of new small businesses as a way to rebuild, offering consulting, technical training and tax incentives.

By focusing on new ventures, those on both sides of the political aisle can rebuild an economy focused on long-term environmental sustainability and economic stability.

About the Author:

Jeffrey York, Associate Professor of Strategy and Entrepreneurship, University of Colorado Boulder

This article is republished from The Conversation under a Creative Commons license. Read the original article.


Ichimoku Cloud Analysis 01.05.2020 (XAUUSD, GBPUSD, EURUSD)

Article By RoboForex.com

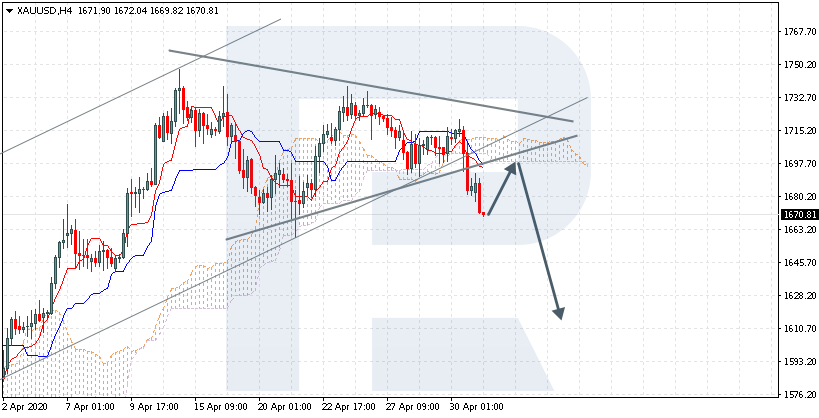
XAUUSD, “Gold vs US Dollar”

XAUUSD is trading at 1670.00; the instrument is moving below Ichimoku Cloud, thus indicating a bearish tendency. The markets could indicate that the price may test the cloud’s downside border at 1697.00 and then resume moving downwards to reach 1610.00. Another signal to confirm further descending movement is the price’s rebounding from the downside border of the Triangle pattern. However, the scenario that implies further decline may be canceled if the price breaks the cloud’s upside border and fixes above 1720.00. In this case, the pair may continue growing towards 1765.00.

XAUUSD
Risk Warning: the result of previous trading operations do not guarantee the same results in the future

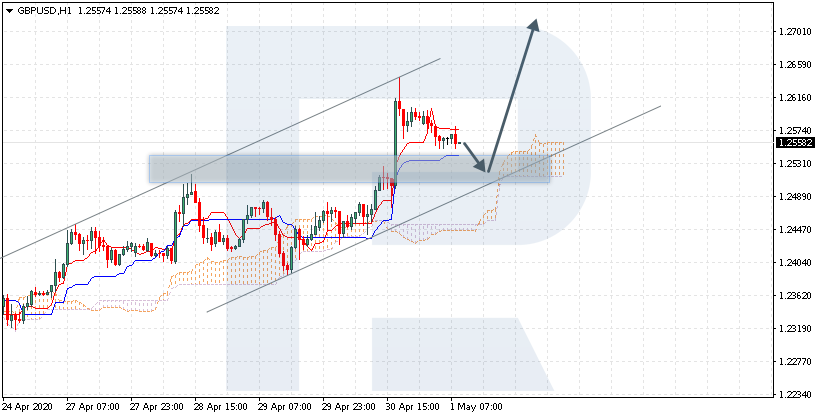
GBPUSD, “Great Britain Pound vs US Dollar”

GBPUSD is trading at 1.2558; the instrument is moving above Ichimoku Cloud, thus indicating a bullish tendency. The markets could indicate that the price may test the cloud’s upside border at 1.2530 and then resume moving upwards to reach 1.2705. Another signal in favor of further ascending movement is the price’s rebounding from the rising channel’s downside border. However, the scenario that implies further growth may no longer be valid if the price breaks the cloud’s downside border and fixes below 1.2425. In this case, the pair may continue falling towards 1.2335.

GBPUSD
Risk Warning: the result of previous trading operations do not guarantee the same results in the future

EURUSD, “Euro vs US Dollar”

EURUSD is trading at 1.0951; the instrument is moving above Ichimoku Cloud, thus indicating a bullish tendency. The markets could indicate that the price may test the cloud’s upside border at 1.0890 and then resume moving upwards to reach 1.1025. Another signal to confirm further ascending movement is the price’s rebounding from the rising channel’s downside border. However, the scenario that implies further growth may be canceled if the price breaks the cloud’s downside border and fixes below 1.0825. In this case, the pair may continue falling towards 1.0745.

EURUSD

Article By RoboForex.com

Attention!
Forecasts presented in this section only reflect the author’s private opinion and should not be considered as guidance for trading. RoboForex LP bears no responsibility for trading results based on trading recommendations described in these analytical reviews.

Fibonacci Retracements Analysis 01.05.2020 (BITCOIN, ETHEREUM)

Article By RoboForex.com

BTCUSD, “Bitcoin vs US Dollar”

As we can see in the H4 chart, the asset is forming a stable rising tendency and has already reached 76.0% fibo. At the same time, the MACD indicator is forming a divergence, which hints at possible reversal or a pullback. The support is 61.8% fibo at 8000.00. A breakout of this level will be another signal in favor of the trend reversal. However, if the current tendency continues, the next rising impulse may be heading towards the fractal resistance at 10505.60.

BTCUSD
Risk Warning: the result of previous trading operations do not guarantee the same results in the future

In the H1 chart, the descending impulse has reached 50.0% fibo and may yet continue towards 61.8% fibo at 8266.20. If the pair continues moving upwards, the next short-term target will be the high at 9471.10.

BITCOIN
Risk Warning: the result of previous trading operations do not guarantee the same results in the future

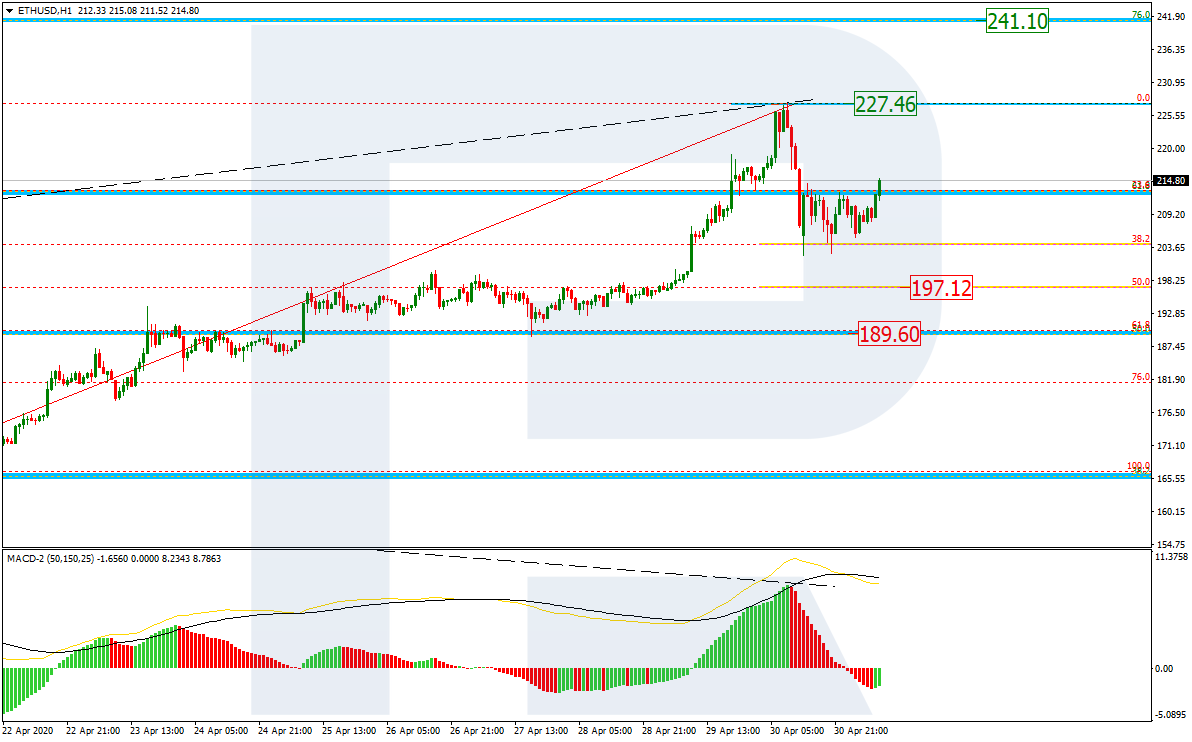
ETHUSD, “Ethereum vs. US Dollar”

As we can see in the H4 chart, after breaking the previous high, another rising impulse has reached 61.8% fibo. The next upside target is 76.0% fibo at 241.10. However, considering the divergence on MACD, the pair may reverse soon. The support is 50.0% fibo at 189.60. A breakout of this level will be the key signal in favor of the trend reversal.

ETHUSD
Risk Warning: the result of previous trading operations do not guarantee the same results in the future

In the H1 chart, the price is correcting downwards to reach 38.2% fibo and may later form a new descending impulse towards 50.0% fibo at 197.12. Still, the target of the next rising impulse will be the high at 227.46.

ETHEREUM

Article By RoboForex.com

Attention!
Forecasts presented in this section only reflect the author’s private opinion and should not be considered as guidance for trading. RoboForex LP bears no responsibility for trading results based on trading recommendations described in these analytical reviews.

Q1 GDP Data Will Likely Mask True Global Economic Future, Part II

By TheTechnicalTraders 

– This portion of our continued research into the Covid-19 virus event, one of the greatest disruptions to the global economy over the past 50+ years, concludes in this article.  In Part I of this article, we highlighted how price factors and economic data continue to suggest the US and the global stock market will likely attempt to retest recent lows or fall further, as the extent of the virus event continues to play out.  In this second portion, we’ll highlight some of this data and present the opposite aspect of the technical/data-driven research we’ve been providing to you.

Recently, something very important has happened in the US stock market – a breakout of sorts.  The weakness we expected to see last week prior to the new $500 billion in new stimulus appeared to end this past week.  Not only have the markets opened a bit higher this week, but they have continued to push higher over the past 3+ days.  From a technical standpoint, as long as the support channels and current trends do not falter, the US stock market may continue to push higher before breaking this uptrend.

Before we continue, be sure to opt-in to our free market trend signals 
before closing this page, so you don’t miss our next special report!

NASDAQ 100 Daily Chart

This NASDAQ 100 Daily chart highlights the upside price trend that originated a bottom just as the US Fed initiated a massive stimulus program.  Weakness in the market, from a technical perspective, is still the overall trend because of the move away from the February highs.  At this point, even if the markets continue to rally, we would need to see a substantially higher price move to establish a new bullish trend.  Yet, as long as price stays above the RSI price channel and the relatively low price channel on this chart, the upside potential is higher than the downside price trend we have been predicting.

SPY Daily Chart

This SPY Daily chart highlights the same type of setup.  We can easily see the minor rotation in price last week which prompted us to issue a warning that price may be turning lower near key Fibonacci levels.  Yet, early this week stock prices pushed higher – even as far weaker global economic data was published.  As long as this upward trend holds, price should continue to move higher.  If it breaks below these price channels we’ve highlighted on this chart – look out below.

At this point, it appears the market is more about a battle between the US Fed and the global central bankers dumping capital into the market to prevent a greater price collapse vs. the data that is starting to support a global economic collapse that may be bigger than the 2008-09 credit crisis.  Currently, it appears global traders and investors are banking on the central bank’s capacity to pour capital into the markets to suppress risks that appear to be growing.

The next series of charts highlight the US economic data as we are just entering a reporting period that reflects the contraction in the US and global economies.  Pay attention to this data and the scope of the collapse compared to the 2008-09 crisis event.

Redbook Retail Sales Index (WoW)

This first chart is the Redbook Retail sales index (WoW) data.  The collapse this week and last is far greater than the lowest levels in 2008~09.

https://www.investing.com/economic-calendar/redbook-911

Richmond Manufacturing Index

This next chart is the Richmond Manufacturing Index – again, the newest data is near twice as deep as the 2008-09 credit crisis levels at their deepest levels. Remember, we are just starting to see the data from the Covid-19 virus event.

https://www.investing.com/economic-calendar/richmond-manufacturing-shipments-1510

US Quarterly GDP Data

This next chart is the US Quarterly GDP data.  The -4.8% level is deep, but still a bit away from the -6.3% level that happened in the 2008-09 credit crisis.  Yet, we believe the Q2 GDP data could offer a number below -8~10%.

https://www.investing.com/economic-calendar/gdp-375

Pending Home Sales Chart

This Pending Home Sales chart confirms a very broad contraction in home buying activity.  In the midst of the 2008-09 crisis, this data printed a -29.9% data point in July 2010 – well after the bottom in the markets had completed.  We believe the next few months will present even deeper sales data.

https://www.investing.com/economic-calendar/pending-home-sales-232

Real consumer spending

Real consumer spending has collapsed.  Consumer engagement makes up a large portion of all global GDP numbers.  As long as consumers stay away from normal activities, the global GDP levels will continue to contract.

https://www.investing.com/economic-calendar/real-consumer-spending-914

Concluding Thoughts:

From a technical standpoint, at this point, as long as price continues to track within the upward sloping price trend, the bullish trend may continue for a bit longer.  Once price breaks below this channel though, look out below.

Our longer-term price modeling systems continue to suggest price is still in a Bearish price trend and this move is a bullish price recovery in a bearish price trend.  Time will tell if the markets have enough resilience to push higher even further.  We believe the data is pointing to a very real potential for a new bearish price trend to emerge.

As a technical analyst and trader since 1997, I have been through a few bull/bear market cycles in stocks and commodities. I believe I have a good pulse on the market and timing key turning points for investing and short-term swing traders. 2020 is an incredible year for traders and investors.  Don’t miss all the incredible trends and trade setups.

Subscribers of my Active Swing Trading Newsletter had our trading accounts close at a new high watermark. We not only exited the equities market as it started to roll over in February, but we profited from the sell-off in a very controlled way with TLT bonds for a 20% gain. This week we closed out SPY ETF trade taking advantage of this bounce and entered a new trade with our account is at another all-time high value.

Ride my coattails as I navigate these financial markets and build wealth while others watch most of their retirement funds drop 35-65% during the next financial crisis.

Just think of this for a minute. While most of us have active trading accounts, what is even more important are our long-term investment and retirement accounts. Why? Because they are, in most cases, our largest store of wealth other than our homes, and if they are not protected during the next bear market, you could lose 25-50% or more of your net worth. The good news is we can preserve and even grow our long term capital when things get ugly like they are now and ill show you how and one of the best trades is one your financial advisor will never let you do because they do not make money from the trade/position.

If you have any type of retirement account and are looking for signals when to own equities, bonds, or cash, be sure to become a member of my Passive Long-Term Investing Signals which we issued a new signal for subscribers.

Chris Vermeulen
Chief Market Strategies
TheTechnicalTraders.com


The Risks Are Extreme – Are you ready for what’s next?

By TheTechnicalTraders

I’ve been trading the markets since 1997, and I’ve never seen anything like what is happening right now. Sure, I’ve seen numerous market events where risks appeared to be excessive, and there were incredible opportunities, but nothing compares to what is happening right now.

My research team has poured through months of data and run our advanced predictive modeling systems. The alignment of major super-cycles, minor cycles, global economic credit expansion, and the COVID-19 virus event, has created a once-in-a-lifetime for traders/investors using our market research and trade signals.

The US Federal Reserve and many global central banks continue to take massive stimulus actions to support the world’s economies while the COVID-19 virus event plays out. The timing of these central bank actions could not have been timed any better, in our opinion, yet we believe the fallout from the global economic collapse is very far-reaching and may last many months or years. Many skilled traders, investors, and analysts have failed to see the bigger picture and how the world may transition from pre virus to a new post virus economic world.

The major and minor super-cycles are a big part of our research and expectations. Far too many people simply don’t know about these cycles and what they mean for future market trends. If they did know about these massive cycle events, their expectations would be completely different than they are now.

A massive super-cycle event is currently taking place that may not end until 2030~35. Minor cycle events have aligned with this super-cycle event that will prompt massive price swings over the next 15+ years. When these cycle events end, another huge market trend will emerge that will be one of the biggest events to happen over the last century.

Right now is when you want to start preparing for these events and these super-cycles. This is truly a once-in-a-life event if you understand what is really happening to the global markets. The opportunities for you and your family are incredible – if you know how to play these cycle events. If you don’t, then you will likely experience extreme difficulty in navigating the next 15+ years successfully.

Please visit TheTechnicalTraders.com to learn more about myself and my team of researchers. We are attempting to help you create massive opportunities from these major cycle/economic events and to help you preserve and protect your wealth.

It’s just started: we’ll need war bonds, and stimulus on a scale not seen in our lifetimes

By James Morley, University of Sydney and Richard Holden, UNSW

Governments are being asked to do the near impossible: to deliver on both health and the economy. In many circumstances doing both at the same time would be completely impossible. But fortunately in Australia we have separate instruments we can use to target separate goals.

The health objective is to minimise the number of lives lost and keep the spread of the virus low enough to not overwhelm the health care system. Until there is a vaccine we will need to keep in place many of the current restrictions, including bans on large gatherings and international travel.

Tally boards publicising the contributions of different suburbs during the second world war.
Australian War Memorial

The economic objective can be assisted by relaxing other restrictions, such as those on the maximum number of people who can gather in one place, alongside careful monitoring and a readiness to reimpose them where needed. But any relaxing of restrictions won’t be anywhere near enough to restore the economy to its full health.

Why we’ll need more stimulus

That’s where Australia’s two separate tools come in. Restrictions are (for now) the primary means of maintaining health.

Huge government spending is the primary means of fending off massive unemployment and a recession worse than any since the Great Depression.

Treasury Secretary Stephen Kennedy acknowledged the scale of what we are facing on Tuesday, telling a Senate committee Australia had “never seen an economic shock of this speed, magnitude and shape.”

Even if we lifted all of its restrictions right now, demand for our exports would remain at global recession levels, pushing our economy backwards.

Adding to the case for enormous extra spending is the additional reality that business cycles are almost always asymmetric: the output lost in a recession isn’t regained in the recovery.

To allow a big recession is to permanently alter our standard of living, and possibly our future growth path; all the more so in downturns caused by pandemics which have been linked to a long-lasting increase in precautionary saving.

Fortunately, fiscal stimulus has been shown to be at its most effective when the economy is massively under-utilising its resources, as it is now.

JobKeeper is a placeholder

The bridging measures undertaken by the government, including JobKeeper, will be critical for mitigating the severity of the recession and maintaining a platform for recovery.

But they will only mitigate the severity of the recession. They won’t avoid it. In common language, they are not “stimulus” measures, but measures that will merely maintain (some of) the status quo.

Even with them, it is entirely reasonable to expect the unemployment rate to climb into double digits as 15-20% of the workforce lose their jobs.

Australia is in the fortunate position of being able to spend big in part because of its prudent policy during the good times and in part because of its comparatively good trade prospects once the global recession is over.

And Australia is able to borrow at historically low levels. The Commonwealth government can issue 10 year bonds or longer at an annual interest rate well below 1%.

This means that even A$1 trillion of extra spending (more than one half of Australia’s annual gross domestic product) would carry a price tag of $10 billion a year or about $400 per person.

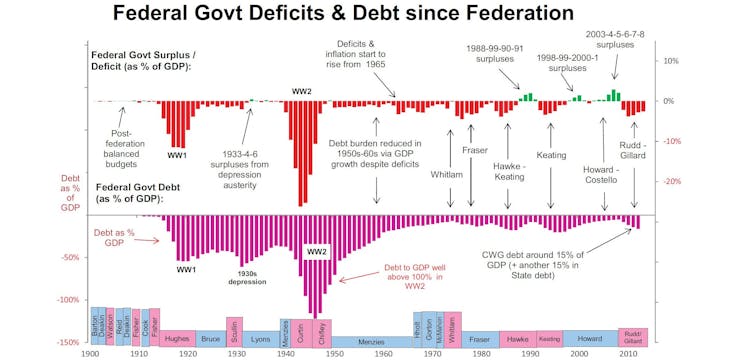
As the economy grows, partly as a result of this extra spending, net debt will shrink as a proportion of gross domestic product, just as it did after the second world war.


Source: Australian Federal Government deficits, debt and the stock market, Centric Wealth

Crucially, it won’t need budget surpluses to do this, just as net debt withered after the war, even though the budget remained in deficit.

Our government went into this crisis with ample capacity to conduct large scale fiscal stimulus, having one of the lowest net debt to GDP ratios in the developed world – just short of 20%.

Err on the high side

But the scale of the stimulus that will be needed is gargantuan, and it will be better to err on the high side – at least 15-20% of GDP per year, for two to three years.

Anything less runs the risk of a debt-default deflationary spiral of the kind seen in the Great Depression, when the ability of households and businesses to pay their debts decreased with deflation and the resulting defaults led to further deflation.

If stimulus is big enough to be successful, financial markets will understand that debt issued by the Commonwealth will ultimately be backed by a higher GDP.

It will be important to signal in advance that the stimulus measures will be in place by the time JobKeeper ends (currently September). The forward guidance should emphasise that the measures will remain well into the recovery and not end at the first sight of it.

The early measures should focus on boosting the capacity of the economy to make it better able to withstand future pandemics.

Examples include

  • improving the national broadband network, with a focus on reducing outages and building infrastructure that will allow homes to act as offices, especially in higher density areas
  • improving the ability of Australian Post to deliver physical items to households, and the ability of ports and road transport to get things to where they are needed
  • building and encouraging the use of the robust technologies that will be needed to ensure keeping the spread of this virus and others low
  • labour intensive programs that boost improve local environments, everything from tree planting and waterway cleanups to cycle path construction and dune repair
  • online delivery for universities, including investment in materials for overseas students who will be given a commitment to be allowed to travel to Australian campuses once restrictions are removed
  • making Australia a world leader in the remote delivery of arts in a way that makes Australian culture available worldwide, and also a world leader in the local delivery of art via labour-intensive public art works

The general point, more important than the specific examples, is that there is a lot of infrastructure that can be created even the under current circumstances.

And consider war bonds

In normal times it might make sense to develop this infrastructure privately or through public-private partnerships, but in the present crisis it can only be done publicly on the scale that is needed. The Australian government has the capacity to do it.

World War II war bonds advertisement.
Australian War Memorial

The best way to make that clear would be a set of separate accounts for the emergency, offset by the issuing of long-term “COVID bonds” at low interest rates, much like the war bonds Australia issued during the second world war.

The bonds would allow visibility into the extent to which the Commonwealth government remained prudent in other spending and would use a precedent already established in making a distinction between spending for investment and spending for consumption.

A broad take-up could also engender the political support needed to extend JobKeeper to more than one million casual workers, and temporary visa holders and students.

Denying people who could contribute to Australia’s economic recovery the opportunity to do it risks denying Australia the resources it will need when the crisis is over.

Announcing these programs as soon as possible and providing guidance on the scale and duration of the planned spending will help prevent further declines in economic activity right now.

The government is delivering an economic statement in a fortnight, on May 12. It would be the right day to start.The Conversation

About the Author:

James Morley, Professor of Macroeconomics, University of Sydney and Richard Holden, Professor of Economics, UNSW

This article is republished from The Conversation under a Creative Commons license. Read the original article.