Author Archive for InvestMacro – Page 48

What determines the value of cryptocurrencies?

By Michael Kuchar

When compared to fiat currencies, cryptocurrencies are not backed by central governments as a legal tender. Central governments state that their currency has a particular value, and the parties in a transaction trust the stated value. Most countries operate using a fiat currency system, with monetary reserves and central banks controlling their supply of money, indirectly controlling inflation. While both entities are supported by quite similar characteristics, there are some essential differences between the two.

Cryptocurrencies are purely digital in nature, and most on the other hand, have a fixed supply, therefore ensuring that the devaluation of a cryptocurrency due do inflation is non-existent. There is no middleman when it comes to transacting in cryptocurrencies, and they are fairly easy to acquire and easy. Being volatile in nature and limited in supply, the value of cryptocurrencies change frequently, making it an enticing investment opportunity to venture into for seasoned traders and amateurs alike. What exactly determines the value of cryptocurrencies though?

What are the biggest determinants of cryptocurrency prices?

As does the very basics of economics dictate, for an entity with a fixed supply possibility, and a fluctuating demand, if a cryptocurrency has a high surge in token supply at a time, but little demand for the same from users and traders, its value will drop. Similarly, if the supply of a cryptocurrency is less, but its demand is high, the value of the coin will rise.

A scarcity of supply will only end up driving up prices when the demand for that particular entity increases. This is one of the main reasons which saw the price of bitcoin soar. Bitcoin has a fixed cap of 21 million tokens, which when compared to other tokens is quite low, while its demand has soared exponentially over the years. To put it into perspective, on the 22nd of May, 2010, two Papa John’s pizzas sold for 10,000 bitcoins! As of the 30th of September, 2019, the price of bitcoin stands at $7,813.

Speculation, social media and media have a great impact on the price of cryptocurrencies as well. New developments in a particular cryptocurrency technology, a fork and an increase in popularity, all in turn may lead in the increases in value of a cryptocurrency. If a token receives negative publicity, its demand is likely to reduce, which in turn will lead to a dip in its price. If the same token were to receive good media coverage and high profile support, the price is all but certain to increase over time. To put it into perspective, cryptocurrency prices are heavily influenced by hype and emotion.

According to bitcoin CaptainAltcoin’s lending systems article, other factors that may end up having a big bearing on the eventual price of a cryptocurrency at any point of time are the usefulness of a token with respect to its utility and the underlying blockchain technology used, with respect to its usefulness in solving real-world problems. The mining difficulty of proof-of-work (PoW) tokens too could have a bearing in dictating its value. The higher the difficulty in mining, the harder it is to increase the supply of a token. This could eventually lead to upward pressure on its price when the demand for the coin is high.

Why do cryptocurrency prices fluctuate so often?

To put it into perspective, the cryptocurrency market is relatively new when compared to other trading institutions. Limited liquidity exists with respect to the cryptocurrency market when compared to other established markets. To put it into perspective, the value of all the money in the world is upwards of $90 trillion, while the cryptocurrency market cap is at $250 billion.

According to wallstrategies.com on a daily basis, cryptocurrency trading values hover at about $14 billion, while forex trades account for about $5 trillion. A major investment, or sale in the cryptocurrency world would lead to shockwaves, disrupting the market and maybe even causing it to crash, while the same would be but a mere ripple to other established trading institutions. Cryptocurrencies are sold and traded on exchanges, accounting for a single point of failure. If an exchange is hacked into and a large sum of money stolen, it can have a devastating effect on the tokens stolen, and lead to serious credibility issues. All these factors combine into fluctuating cryptocurrency prices, sometimes leading to huge surges in prices, while at other times leading to immense price dips.

Conclusion on what determines the value of cryptocurrencies

New possibilities, several options and a thin market with respect to depth makes it easy to fluctuate the price of an entity, thereby leading to its volatility. Nevertheless, the volatility of cryptocurrencies makes for interesting investing possibilities and the opportunity to earn quick money if you know what you are doing. The future holds great promise for the cryptocurrency world, with several established institutions opting for blockchain technology. Once touted a bubble waiting to burst, cryptocurrencies have taken the world by storm, and is hear for the long run.

About the Author:

Michael is an experienced financial trader using Forex, Commodities and Cryptocurrencies. In addition to trading, he runs businesses, trains traders and develops trading technology products. His other passions are boxing and traveling.


The Analytical Overview of the Main Currency Pairs on 2020.05.05

by JustForex

The EUR/USD currency pair

Technical indicators of the currency pair:
  • Prev Open: 1.09695
  • Open: 1.09046
  • % chg. over the last day: -0.48
  • Day’s range: 1.08851 – 1.09160
  • 52 wk range: 1.0777 – 1.1494

The EUR/USD currency pair has been declining. The trading instrument has updated local lows. The demand for safe assets has grown amid fears of a renewed trade war between Washington and Beijing. The ECB forecasts that Eurozone GDP in 2020 will fall by 5.5%. The single currency has a potential for further decline. At the moment, the local support and resistance levels are 1.0885 and 1.0925, respectively. We expect economic releases from the US. Positions should be opened from key levels.

The Economic News Feed for 05.05.2020

At 17:00 (GMT+3:00), the ISM non-manufacturing PMI will be published.

We also recommend paying attention to the speeches by FOMC representatives.

EUR/USD

Indicators do not give accurate signals: the price has fixed between 50 MA and 100 MA.

The MACD histogram is in the negative zone and continues to decline, which indicates the development of bearish sentiment.

Stochastic Oscillator is in the neutral zone, the %K line is below the %D line, which also gives a signal to sell EUR/USD.

Trading recommendations
  • Support levels: 1.0885, 1.0845
  • Resistance levels: 1.0925, 1.0970, 1.1015

If the price fixes below 1.0885, a further fall in the EUR/USD currency pair is expected. The movement is tending to 1.0850-1.0820.

An alternative could be the growth of EUR/USD quotes to 1.0950-1.0980.

The GBP/USD currency pair

Technical indicators of the currency pair:
  • Prev Open: 1.24823
  • Open: 1.24408
  • % chg. over the last day: -0.09
  • Day’s range: 1.24350 – 1.24740
  • 52 wk range: 1.1466 – 1.3516

There is an ambiguous technical pattern on the GBP/USD currency pair. The British pound is consolidating. There is no defined trend. Local support and resistance levels are still: 1.2425 and 1.2485, respectively. Financial market participants expect indicators of economic activity in the UK. A trading instrument is tending to decline. We recommend opening positions from key support and resistance levels.

At 11:30 (GMT+3:00), data on economic activity will be published in the UK.

GBP/USD

Indicators do not give accurate signals: the price has fixed between 50 MA and 100 MA.

The MACD histogram is near the 0 mark.

Stochastic Oscillator is in the neutral zone, the %K line is below the %D line, which indicates the bearish sentiment.

Trading recommendations
  • Support levels: 1.2425, 1.2385, 1.2315
  • Resistance levels: 1.2485, 1.2515, 1.2570

If the price fixes below the support level of 1.2425, a further drop in GBP/USD quotes is expected. The movement is tending to 1.2380-1.2350.

An alternative could be the growth of the GBP/USD currency pair to 1.2530-1.2560.

The USD/CAD currency pair

Technical indicators of the currency pair:
  • Prev Open: 1.40828
  • Open: 1.40862
  • % chg. over the last day: +0.02
  • Day’s range: 1.40315 – 1.40918
  • 52 wk range: 1.2949 – 1.4668

The USD/CAD currency pair has become stable. There is no defined trend. The loonie is currently testing support of 1.4030. The round level of 1.4100 is the key resistance. The Canadian dollar is supported by price recovery in the “black gold” market. We recommend paying attention to the news feed from the US. Positions should be opened from key levels.

At 15:30 (GMT+3:00), data on Canada’s trade balance will be published.

USD/CAD

Indicators do not give accurate signals: the price has fixed between 50 MA and 100 MA.

The MACD histogram has moved into the negative zone, which signals the power of sellers.

Stochastic Oscillator is near the oversold zone, the %K line has crossed the %D line. There are no signals at the moment.

Trading recommendations
  • Support levels: 1.4030, 1.4000, 1.3940
  • Resistance levels: 1.4100, 1.4150, 1.4200

If the price fixes below the support level of 1.4030, USD/CAD quotes will fall. The movement is tending to 1.3980-1.3960.

An alternative could be the growth of the USD/CAD currency pair to 1.4130-1.4160.

The USD/JPY currency pair

Technical indicators of the currency pair:
  • Prev Open: 106.800
  • Open: 106.723
  • % chg. over the last day: -0.02
  • Day’s range: 106.509 – 106.789
  • 52 wk range: 101.19 – 112.41

USD/JPY quotes are in a sideways trend. The technical pattern is ambiguous. At the moment, the trading instrument is testing local support and resistance levels: 106.55 and 106.80, respectively. The demand for safe-haven currencies has grown significantly. We expect economic releases from the US. We also recommend paying attention to the dynamics of US government bonds yield. Positions should be opened from key levels.

USD/JPY

Indicators do not give accurate signals: the price has crossed 50 MA.

The MACD histogram is in the negative zone, but above the signal line, which gives a weak signal to sell USD/JPY.

Stochastic Oscillator is in the neutral zone, the %K line has started crossing the %D line. There are no signals at the moment.

Trading recommendations
  • Support levels: 106.55, 106.40
  • Resistance levels: 106.80, 107.00, 107.35

If the price fixes below 106.55, USD/JPY quotes are expected to fall. The movement is tending to 106.30-106.00.

An alternative could be the growth of the USD/JPY currency pair to 107.00-107.30.

by JustForex

Coronavirus medical costs could soar into hundreds of billions as more Americans become infected

By Bruce Y. Lee, City University of New York

As states push to reopen businesses, arguing their economies are losing too much money under current coronavirus precautions, they can’t ignore the other side of the economic equation – the one involving human lives and potentially hundreds of billions of dollars in medical costs.

More than 20,000 new COVID-19 cases are still being reported in the U.S. every day, and the coronavirus that causes it is still spreading.

If the U.S. reopens its economy prematurely and COVID-19 cases surge again, medical expenses will surge, too. Someone has to pay those costs. If you own a business, pay for health insurance or pay taxes, that someone is you.

To get a better sense of what the nation’s COVID-19-related health care costs could be as more and more of the population is infected, our Public Health Informatics, Computational, and Operations Research team at the City University of New York (CUNY) Graduate School of Public Health and Health Policy developed a computer simulation of the entire United States.

It allows us to quantify what could happen depending on how the pandemic progresses and the resulting direct medical costs and health care resource needs. The results were published in the journal Health Affairs.

Building a Sim nation for COVID-19

Our team develops computer simulation models to help decision-makers better understand and address different infectious diseases, including MRSA, the flu, Zika and Ebola. During the 2009 H1N1 influenza pandemic, the team was embedded in the U.S. Department of Health and Human Services to help with the national response.

These models try to recreate all of the people, processes, resources and systems involved in a given health or public issue, such as a pandemic, to serve as virtual worlds to test different possible scenarios, policies and interventions and calculate the expected costs.

For this latest coronavirus model, we created virtual representations of the entire U.S. population.

Each virtual person had probabilities of becoming infected with the new coronavirus, SARS-CoV-2. Like a real person, the virtual person had chances of developing mild or severe symptoms, or having no symptoms at all during the course of the infection. No symptoms naturally meant no health costs.

How medical costs pile up

If the person developed symptoms, what happened next depended on how severe the symptoms became and what the person ended up doing.

For example, treating a child with only a mild illness requiring no more than a telephone call to a doctor would typically cost around US$32 (in most cases ranging from $19 to $56). The cost for an adult in the same situation would be about $17 (in most cases ranging from $16 to $67). Our model incorporated the variations in costs that occur, so that two people could have the exact same paths, yet still have different costs.

Not surprisingly, costs increased substantially if the person had more severe symptoms that required hospitalization.

The costs of a hospital bed, health care personnel, medications and potentially the use of medical equipment such as ventilators quickly add up, pushing up the median cost for a person hospitalized to $14,366.

Most COVID-19 patients don’t require hospitalization, so the median cost for any person with symptoms turned out to be $3,045 during the course of the person’s infection. But this is still over four times the typical cost of a symptomatic influenza case and around 5.5 times that of a symptomatic pertussis case. Consider this further evidence that COVID-19 is definitely not “just like the flu.”

Health care costs for the coronavirus don’t end when the patient leaves the hospital. Patients with severe illness may require follow-up visits to the doctor, imaging such as X-rays and CT scans, lab tests, medications or even additional hospitalizations. Those with significant lung damage, for example, may be more susceptible to subsequent infections.

The resulting health care costs over the year after the initial infection raise this median cost per patient by 30% to $3,994.

This shows that you can’t ignore what happens after the initial infection. That would be like walking out of a three-hour movie after just the second hour.

For some patients, the suffering and medical costs don’t end once the virus is no longer present. For example, those who experience lung damage may continue to have breathing problems. Those who managed to survive sepsis and organ failure can have a variety of persistent symptoms. Given these persistent problems, for some, COVID-19 may become more like a chronic condition.

Herd immunity and the high cost of viral spread

Our findings also shed light on what can happen when more and more of the population becomes infected.

We found that if 20% of the U.S. population gets COVID-19, it would mean about 11.2 million people would be hospitalized, and the sickest among them would spend a combined 13 million days on ventilators.

This would cost about $163.4 billion in direct medical expenses, and that’s before accounting for the costs incurred after the infection is over. It also does not include many other health-related costs, such as physician fees that can vary from doctor to doctor, the costs of public health measures such as widespread testing and the costs of protecting health care workers and other patients.

If half the population becomes infected before a vaccine is ready, the numbers jump to 27.9 million hospitalizations and 32.6 million ventilator days. The median cost: $408.8 billion, rising to $536.7 billion with a year of follow-up medical costs taken into account.

That’s getting close to what’s known as herd immunity, the point where enough people are immune that the disease no longer finds hosts to spread it. With the coronavirus, herd immunity is believed to be reach when at least 60% of the population has either been infected naturally or vaccinated.

If 80% of the population gets infected, the numbers rise to 44.6 million hospitalizations, 52.2 million ventilator days and $654 billion in direct medical expenses. With a year of follow-up medical expenses included, that median cost rises to $1.25 trillion.

All of this shows what could happen if the country allows more people to become infected by prematurely relaxing social distancing or trying “herd immunity strategies” that just allow people to get infected. The costs also go well beyond health care expenses when lives are at stake.

Good decision-making during this pandemic requires good science and data. Ultimately, not considering the potential associated medical costs can be like ignoring a large part of the field in a football game. And that could be a losing proposition.The Conversation

About the Author:

Bruce Y. Lee, Professor of Health Policy and Management, City University of New York

This article is republished from The Conversation under a Creative Commons license. Read the original article.


How a one-off tax on wealth could cover the economic cost of the coronavirus crisis

By Nick O’Donovan, Manchester Metropolitan University

The UK’s annual public deficit is predicted to balloon from a previously forecast £55 billion to £273 billion by the end of 2020. This increase is the product of higher government spending to contain the human and economic costs of the coronavirus pandemic, and lower tax revenues linked to the lockdown.

Understandably, there are already concerns about how to pay for this. Concerns about affordability could lead to a premature exit from lockdown, endangering lives. Or they could limit political appetite for economic stimulus measures once the lockdown is over, endangering livelihoods.

On the face of it, these concerns appear justified. There is little scope for further cuts to public services after a decade of austerity. Economic growth looks unlikely to come to the rescue of the public finances either – even before the pandemic, the UK’s prospects looked grim, courtesy of global economic stagnation coupled with the more localised fallout from Brexit.

The coming slump will reduce UK tax revenues, not increase them. Borrowing is viable so long as the UK can do so cheaply, though without rapid economic growth, debts may prove hard to shift. This would limit the ability of the UK state to respond to future needs. Under the circumstances, renewed interest in modern monetary theory – the idea that governments in control of their own currencies can directly create limitless money in order to fund their spending – is unsurprising.

Yet there is an alternative way in which the government could choose to pay for the pandemic once the recovery is well underway: a one-off windfall tax on the wealth of UK citizens and long-term residents. According to the most recent data released by the Office for National Statistics, UK households own almost £15 trillion worth of net assets. These include property, savings, investments, private pensions and vehicles, less all outstanding liabilities (for instance, mortgages, loans and credit card debts).

A small fraction of that total could cover the forecast fiscal costs of the crisis in their entirety. This would free the government to spend on health, social care, infrastructure, education and regional economic development – all of which the country desperately needed even before the latest crisis hit. Wealth is so unevenly distributed in the UK that the poorest 50% of UK households could be excluded from the tax entirely and the revenues would drop by less than 10%.

Implementing it

Even allowing for dramatic falls in asset values since the onset of the pandemic, and a modicum of tax dodging, I estimate that a relatively modest tax rate of around 3% on the net wealth of the top 50% of UK households could offset the estimated fiscal costs of the pandemic. Most people would pay significantly less, assuming a tax-free allowance equivalent to the average level of wealth.

For example, a couple that owns an average-priced UK home, with no outstanding mortgage and £100,000 of private pension savings, might face a bill of around £1,000 in a one-off wealth tax. And they could opt to have this money deducted directly from their pension savings. Where there is no cash available to pay the charge – for instance, for people who purchased their homes decades ago in neighbourhoods where property prices subsequently went through the roof – the tax could be deferred until the owners decide to sell up. Or the government might take an equity share in lieu of payment.

Some commentators have expressed concern that such a tax could prompt capital flight, as investors seek to shelter their wealth offshore. But that position confuses capital levies with wealth taxes. Capital levies involve charges on all capital held in a territory (all savings deposits held by domestic banks, for instance). A wealth tax targets the assets of a territory’s citizens and long-term residents, irrespective of where in the world those assets are located.

Admittedly, there are still risks that wealthier members of UK society might seek to relocate to avoid the tax charge. This is an objection commonly levelled against annually recurring wealth taxes, albeit an objection for which the empirical evidence is mixed.

Nonetheless, wealthy individuals may well deem the costs of uprooting their lives to be higher than the costs of a one-off tax charge. Practically speaking, they may struggle to rid themselves of UK residency before a one-off wealth tax takes effect. Other countries may introduce similar measures to tackle the costs of the pandemic, further complicating any avoidance strategies. The idea has already been mooted in Germany and the United States, for example.

Ethical reasons

There are strong ethical arguments in favour of a one-off wealth tax. If the costs of the pandemic were added to the public debt in their entirety, to be serviced out of conventional future tax revenues, we would essentially be saying that those who engage in economic activity after the crisis should pay for the emergency healthcare spending and economic bailout enjoyed by taxpayers today.

That is what happened following the financial crash of 2007-09: incomes earned in the long boom that preceded (and in many ways precipitated) that crisis contributed comparatively little towards the cost of the economic rescue package required in the wake of the crash. By contrast, those who sought to enter or progress in the labour market post-crisis bore the brunt of financing it.

COVID-19 has exposed the inadequacy of the medical and social insurance Britain had in place. The fiscal costs of the crisis would have been substantially lower if there had been proper investment in public services and welfare over the last ten years. We may not have been forced to purchase PPE and ventilators at panic prices to quite the same extent; a less dramatic lockdown would have been needed in order to ration limited NHS capacity; working-age households would have been better equipped to weather a short period of economic inactivity.

Today’s wealth is yesterday’s income and gains, earned while we were failing to make those critical investments. Like anyone who has failed to buy adequate insurance in the past, we face a bigger bill today as a result of our earlier inaction. A one-off wealth tax may prove the fairest way of paying down the costs of the pandemic.The Conversation

About the Author:

Nick O’Donovan, Senior Lecturer at the Future Economies Research Centre, Manchester Metropolitan University

This article is republished from The Conversation under a Creative Commons license. Read the original article.


Bitcoin Trades Like the S&P 500, and is Testing Resistance

By TheTechnicalTraders 

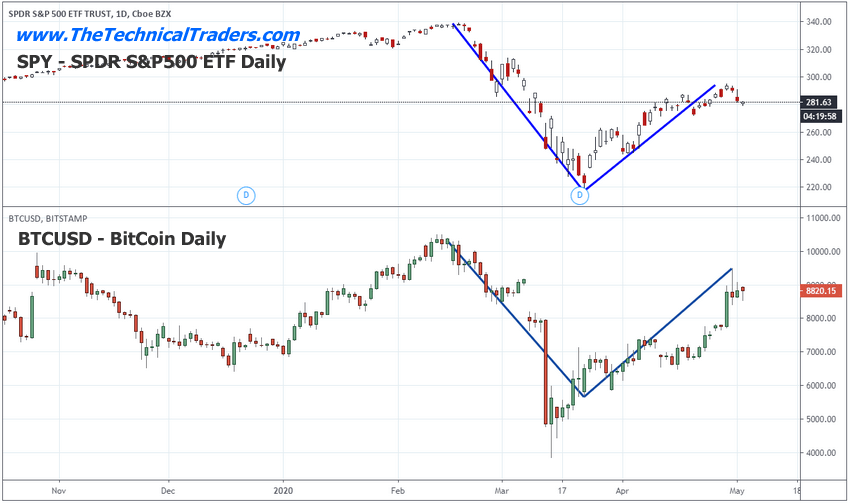
– If you pay attention to the trends taking place on the Weekly Bitcoin chart, you’ll notice that it has reacted to the global market Covid-19 trends almost exclusively since the beginning of 2020.  After the end of 2019, the US stock market rallied on Q4: 2019 data and so did Bitcoin.  The US Stock market peaked near February 20 and began a deeper selloff on February 25 – Bitcoin followed this pattern as well.  When the US Fed initiated the stimulus on March 23, Bitcoin prices had already started to bottom in anticipation of the Fed stimulus and really began to rally after the Fed began intervening.

Before you continue, be sure to opt-in to our free market trend signals
before closing this page, so you don’t miss our next special report!

Bitcoin VS S&P 500 Daily Chart Comparison

This is a bit unusual for Bitcoin, which in the past didn’t correlate to the US stock market trends all that well.  What changed?  We believe the sudden correlation of Bitcoin to the US Stock Market trends are related to investor psychology and the perceived efforts of the Central Banks in supporting the global economy.

We find it interesting that a decentralized cryptocurrency, which is supposed to be independent of global central banks and governments, suddenly aligns almost perfectly with the US stock market in correlation with the US Federal Reserve.  It is almost as if Bitcoin prices are much more aligned with the global economy and global central banks as this crisis event unfolds.  This suggests the true value of Bitcoin is not as an alternate, decentralized currency.  The true value of Bitcoin is a hyper-speculative alternate store of value – unrelated to any real asset or oversight process.

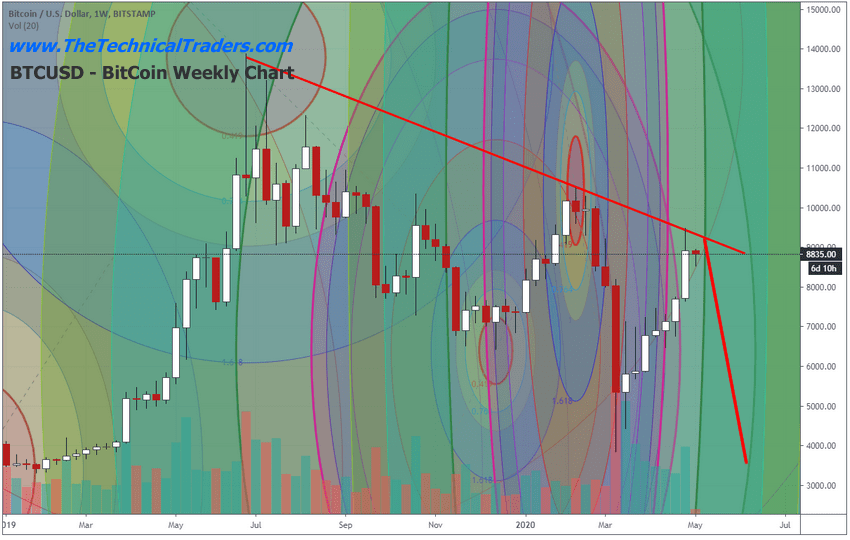
What’s Next for Bitcoin – Weekly Chart

If our research is correct, the current downside price channel (Resistance) originating from the June 2019 highs will prompt a massive breakdown in price over the next 5+ weeks – possibly longer.  There are two key factors that lead us to this conclusion.  First, the correlation to the US stock market, which we believe will continue to move lower until an ultimate bottom is reached near July or August 2020.  Second, the massive Fibonacci Price Amplitude Arc inflection point (the GREEN ARC) which will be reached in less than seven days.

If Bitcoin continues to mirror the US stock market price action and this inflection point does what we believe, then a massive breakdown in price may start to trend sometime between May 8 and May 14.

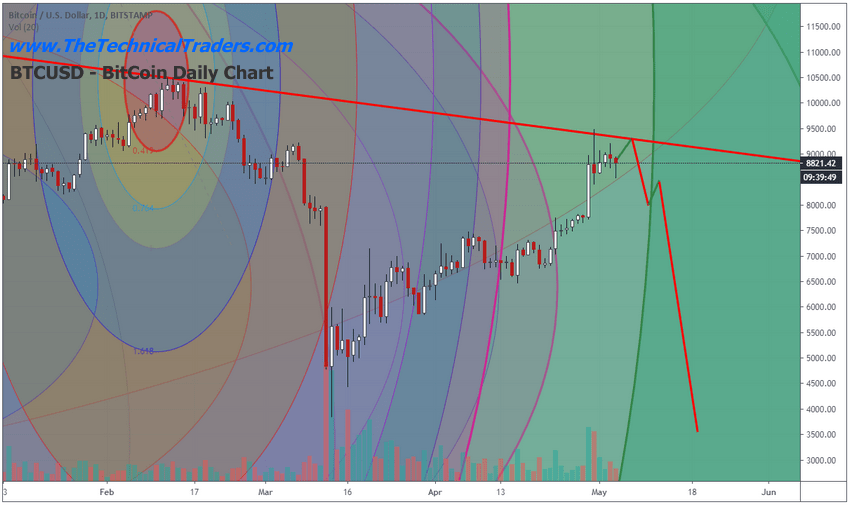
Daily Bitcoin Chart

This Daily Bitcoin Chart shows you what we believe to be the most likely outcome going forward.  A bit of upward price rotation to potentially retest the resistance level, then a moderate selloff, followed by a brief sideways trend before an even deeper selloff begins.  This may be a map of what the US stock market may do over the exact same span of time.

CONCLUDING THOUGHTS:

Our researchers believe the ultimate bottom will set up near the end of Q3: 2020.  We believe general weakness will push the US stock market price towards an ultimate low/bottom near July or August 2020.  After that bottom completes, Q4: 2020 may see a moderate upside price trend as the Santa Rally mode kicks in.  If Bitcoin mirrors this move, then it may attempt to move below the $3850 level and ultimately attempt to find a bottom below $3000.

Our researchers believe Bitcoin has recently aligned with the US stock market and the global central banks.  If this is the case, then the “alternate decentralized currency” aspect of cryptos becomes a useless component of the market.  If Bitcoin mirrors the SPY going forward, then it is just an expensive, highly volatile alternate measure of the US stock market and global central bank activities.

Watch for the price breakdown near May 10th or so.

As a technical analyst and trader since 1997, I have been through a few bull/bear market cycles in stocks and commodities. I believe I have a good pulse on the market and timing key turning points for investing and short-term swing traders. 2020 is an incredible year for traders and investors.  Don’t miss all the incredible trends and trade setups.

Subscribers of my Active ETF Swing Trading Newsletter had our trading accounts close at a new high watermark. We not only exited the equities market as it started to roll over in February, but we profited from the sell-off in a very controlled way with TLT bonds for a 20% gain. This week we closed out SPY ETF trade taking advantage of this bounce and entered a new trade with our account is at another all-time high value.

Ride my coattails as I navigate these financial markets and build wealth while others watch most of their retirement funds drop 35-65% during the rest of this financial crisis going into late 2020 and early 2021.

Just think of this for a minute. While most of us have active trading accounts, what is even more important are our long-term investment and retirement accounts. Why? Because they are, in most cases, our largest store of wealth other than our homes, and if they are not protected during the next bear market, you could lose 25-50% or more of your net worth. The good news is we can preserve and even grow our long term capital when things get ugly like they are now and ill show you how and one of the best trades is one your financial advisor will never let you do because they do not make money from the trade/position.

If you have any type of retirement account and are looking for signals when to own equities, bonds, or cash, be sure to become a member of my Passive Long-Term ETF Investing Signals which we issued a new signal for subscribers.

Chris Vermeulen
Chief Market Strategies
TheTechnicalTraders.com


Fibonacci Retracements Analysis 04.05.2020 (GOLD, USDCHF)

Article By RoboForex.com

XAUUSD, “Gold vs US Dollar”

As we can see in the H4 chart, after falling and reaching 23.6% fibo, XAUUSD is moving towards the high at 1747.77. If the price breaks it, the pair may continue its growth to reach the post-correctional extension area between 138.2% and 161.8% fibo at 1798.90 and 1858.60 respectively. At the same time, one should note that the rising impulse was slowed down as it was approaching the high. In this case, there is a high probability of a new descending wave with the targets at 38.2% and 50.0% fibo at 1634.40 and 1599.50 respectively.

GOLD_H4
Risk Warning: the result of previous trading operations do not guarantee the same results in the future

On H1, after a decline and another test of 23.6% Fibo, the quotations are heading for 1747.77, but this may be just a short-time pullback after a momentum of decline.

GOLD_H1
Risk Warning: the result of previous trading operations do not guarantee the same results in the future

USDCHF, “US Dollar vs Swiss Franc”

On H4, the last escape of the quotations from the upper border of the consolidation triangle was hardly a success. The quotations formed a strong momentum of a decline, hinting on possible extension of the correctional phase. The potential goal of the decline is 61.8% (0.9453) Fibo; after it is broken away, the decline may go on to 76.0% (0.9350).

USDCHF_H4
Risk Warning: the result of previous trading operations do not guarantee the same results in the future

On H1, there is a short-term pullback after a momentum of a decline to the local lows. The aim of the pullback may be at the current resistance level of 0.9672. After the correction is over, the quotations may go on declining. The next goals of the decline are in the post-correctional extension range of 138.2-161.8% (0.9512-0.9462) Fibo.

USDCHF_H1

Article By RoboForex.com

Attention!
Forecasts presented in this section only reflect the author’s private opinion and should not be considered as guidance for trading. RoboForex LP bears no responsibility for trading results based on trading recommendations described in these analytical reviews.

Forex Technical Analysis & Forecast 04.05.2020

Article By RoboForex.com

EURUSD, “Euro vs US Dollar”

The currency pair has broken the level of 1.0970 upwards, extending the consolidation area to 1.1000. Today, the market is pushed to the lower border of this range. We are waiting for the level of 1.0922 to be reached, followed by growth to 1. 0970 and its test from below. Then the pair may return to 1.0922. After breaking it downwards, it may further decline to 1.0875. The goal is local.

EURUSD
Risk Warning: the result of previous trading operations do not guarantee the same results in the future

GBPUSD, “Great Britain Pound vs US Dollar”

The currency pair reached the estimated goal of the decline at 1.2485. Today, the market has broken this level downwards. It may further decline to 1.2385. After this goal is reached, the pair may correct to 1.2515, testing this level from below. Then it may decline to 1.2310.

GBPUSD
Risk Warning: the result of previous trading operations do not guarantee the same results in the future

USDRUB, “US Dollar vs Russian Ruble”

The currency pair has corrected to 74.10. At the market opening, we are expecting a decline to 72.00, followed by growth to 73.50 and a decline to 71.30. The goal is local.

USDRUB
Risk Warning: the result of previous trading operations do not guarantee the same results in the future

USDJPY, “US Dollar vs Japanese Yen”

The currency pair goes on developing a correction. The market has returned to 106.60. At the moment, the market is trading in a consolidation range, which may extend to 106.52. Then the pair may grow to 107.07. Breaking this level upwards, it may further grow to 107.57.

USDJPY
Risk Warning: the result of previous trading operations do not guarantee the same results in the future

USDCHF, “US Dollar vs Swiss Franc”

The currency pair has broken the consolidation area downwards, extending it to 0.9590. Today, the market is trading in a momentum of growth to 0.9656. Then it may correct to 0.9622. At these levels, a new consolidation area may develop. If the pair growth and breaks away 0. 9660, it may then grow to 0.9733. The goal is the first one of the uptrend.

USDCHF
Risk Warning: the result of previous trading operations do not guarantee the same results in the future

AUDUSD, “Australian Dollar vs US Dollar”

The currency pair keeps developing a declining wave. The market has reached the estimated goal of the first wave at 0.6396. At the moment, the market is trading in the consolidation area at the lows. The pair may break 0.6400 upwards and correct to 0.6484. And if it declines and breaks the level of 0.6373 downwards, it may then decline to 0.6333.

AUDUSD
Risk Warning: the result of previous trading operations do not guarantee the same results in the future

BRENT

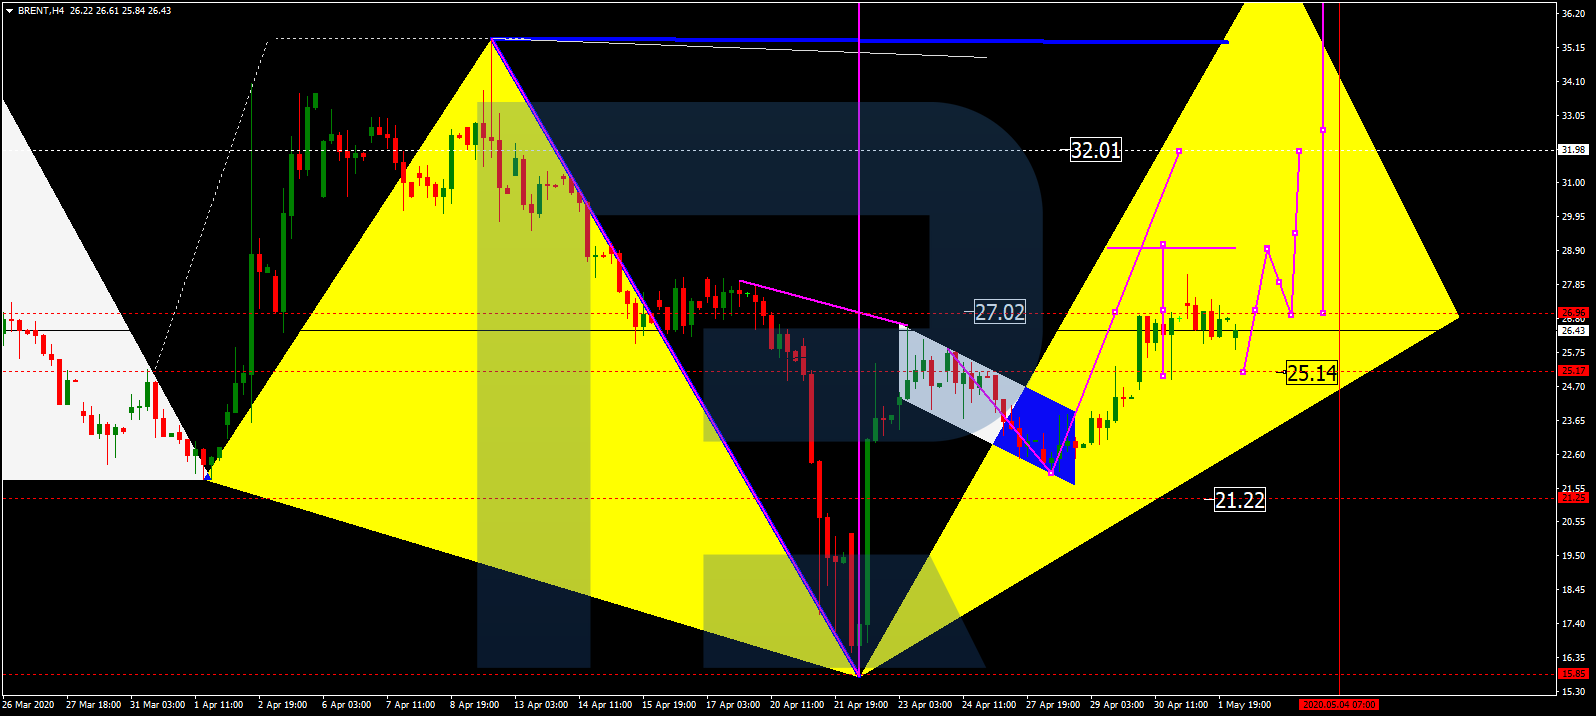
Oil keeps developing a consolidation area around 27.00. We are expecting it to extend to 29.00. Then the pair may decline to 27.00,testing it from above, and grow to 32.02. The goal is local.

BRENT
Risk Warning: the result of previous trading operations do not guarantee the same results in the future

XAUUSD, “Gold vs US Dollar”

Gold keeps developing a wave of growth to 1712.00. After this level is reached, the pair may correct to 1690.50 and grow to 1730.00. The goal is local.

GOLD
Risk Warning: the result of previous trading operations do not guarantee the same results in the future

Bitcoin

The market has demonstrated a wave of growth to 9180. The market today is trading in a wave of decline to 8618. Then a correction to 8919 is not excluded. A consolidation area is expected to develop at practically these levels. When the cryptocurrency escapes it downwards, it may further correct to 8470. Breaking this level downwards, too, the declining wave may develop to 7900. The goal is local.

BITCOIN
Risk Warning: the result of previous trading operations do not guarantee the same results in the future

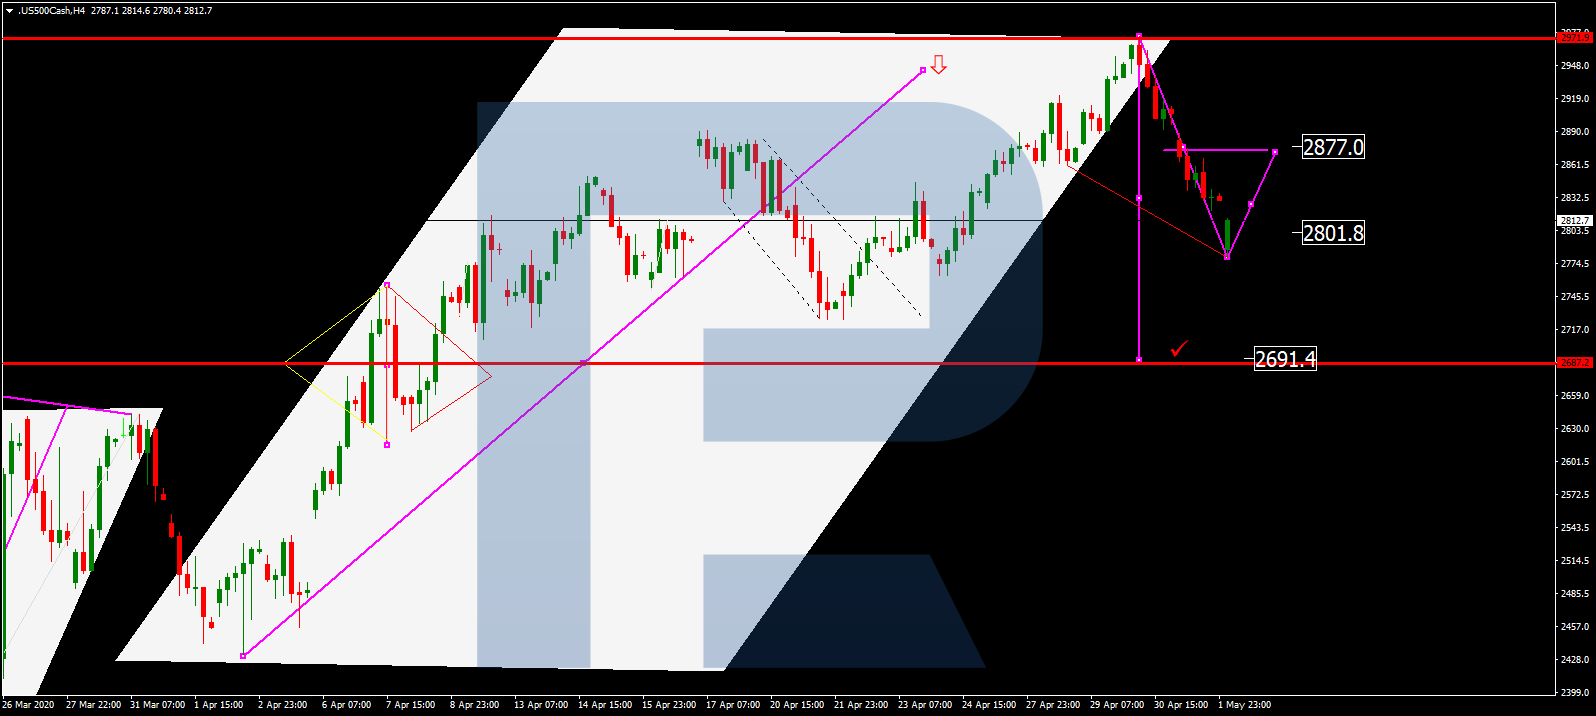
S&P 500

The index has performed a wave of decline to 2801.8. Today, the development of a consolidation range at these lows looks possible. However, it may grow to 2877.0 and then decline to 2691.4.

S&P500

Article By RoboForex.com

Attention!
Forecasts presented in this section only reflect the author’s private opinion and should not be considered as guidance for trading. RoboForex LP bears no responsibility for trading results based on trading recommendations described in these analytical reviews.

The Analytical Overview of the Main Currency Pairs on 2020.05.04

by JustForex

The EUR/USD currency pair

Technical indicators of the currency pair:
  • Prev Open: 1.09531
  • Open: 1.09695
  • % chg. over the last day: +0.26
  • Day’s range: 1.09251 – 1.09737
  • 52 wk range: 1.0777 – 1.1494

The EUR/USD currency pair has become stable after a sharp increase at the end of last week. The trading instrument has set new local highs. Washington is considering imposing new sanctions against Beijing, finding it guilty of the COVID-19 epidemic. The number of coronavirus infected in the world exceeded 3.5 million. At the moment, EUR/USD quotes are consolidating in the range of 1.0925-1.0970. The single currency has the potential for further growth. Positions should be opened from key levels.

The Economic News Feed for 04.05.2020

  • At 10:55 (GMT+3:00), German manufacturing PMI will be published.
EUR/USD

Indicators do not give accurate signals: the price has crossed 50 MA.

The MACD histogram has started declining, indicating the development of the correction movement.

Stochastic Oscillator is in the neutral zone, the %K line is above the %D line, which gives a signal to buy EUR/USD.

Trading recommendations
  • Support levels: 1.0925, 1.0890, 1.0845
  • Resistance levels: 1.0970, 1.1015

If the price fixes above the level of 1.0970, further growth of the EUR/USD currency pair is expected. The movement is tending to 1.1015-1.1040.

An alternative could be a decrease in the EUR/USD quotes to 1.0890-1.0860.

The GBP/USD currency pair

Technical indicators of the currency pair:
  • Prev Open: 1.25838
  • Open: 1.24823
  • % chg. over the last day: -0.71
  • Day’s range: 1.24242 – 1.24855
  • 52 wk range: 1.1466 – 1.3516

GBP/USD quotes have been declining. The British pound has updated local lows. The demand for risky assets has weakened. At the moment, the GBP/USD currency pair is consolidating. The local support and resistance levels are 1.2425 and 1.2485, respectively. Financial market participants expect additional drivers. A trading instrument has the potential for further decline. We recommend opening positions from key support and resistance levels.

The news feed on the UK economy is calm.

GBP/USD

Indicators do not give accurate signals: the price has fixed between 50 MA and 100 MA.

The MACD histogram is in the negative zone, indicating the bearish sentiment.

Stochastic Oscillator is in the neutral zone, the %K line has crossed the %D line. There are no signals at the moment.

Trading recommendations
  • Support levels: 1.2425, 1.2385, 1.2315
  • Resistance levels: 1.2485, 1.2515, 1.2570

If the price fixes below the support level of 1.2425, a further drop in GBP/USD quotes is expected. The movement is tending to 1.2380-1.2350.

An alternative could be the growth of the GBP/USD currency pair to 1.2530-1.2560.

The USD/CAD currency pair

Technical indicators of the currency pair:
  • Prev Open: 1.39385
  • Open: 1.40828
  • % chg. over the last day: +1.01
  • Day’s range: 1.40775 – 1.41524
  • 52 wk range: 1.2949 – 1.4668

The bullish sentiment prevails on the USD/CAD currency pair. The trading instrument has set new local highs. The loonie is currently consolidating in the range of 1.4075-1.4150. The demand for risky assets is still low. The Canadian dollar has the potential for further decline against the greenback. We recommend paying attention to the dynamics of oil quotes. Positions should be opened from key levels.

The news feed on Canada’s economy is calm.

USD/CAD

Indicators signal the power of buyers: the price has fixed above 100 MA.

The MACD histogram is in the positive zone, but below the signal line, which gives a weak signal to buy USD/CAD.

Stochastic Oscillator is in the neutral zone, the %K line has crossed the %D line. There are no signals at the moment.

Trading recommendations
  • Support levels: 1.4075, 1.4005, 1.3960
  • Resistance levels: 1.4150, 1.4200, 1.4255

If the price fixes above the resistance level of 1.4150, further growth of the USD/CAD quotes is expected. The movement is tending to 1.4200-1.4230.

An alternative could be a decrease in the USD/CAD currency pair to 1.4050-1.4010.

The USD/JPY currency pair

Technical indicators of the currency pair:
  • Prev Open: 107.118
  • Open: 106.800
  • % chg. over the last day: -0.22
  • Day’s range: 106.670 – 106.943
  • 52 wk range: 101.19 – 112.41

There is an ambiguous technical pattern on the USD/JPY currency pair. Quotes are in a sideways trend. There is no defined trend. The trading instrument is testing local support and resistance levels: 106.65 and 106.95, respectively. The USD/JPY currency pair is tending to decline. We recommend paying attention to the dynamics of US government bonds yield. Positions should be opened from key levels.

USD/JPY

Indicators do not give accurate signals: the price has crossed 50 MA.

The MACD histogram is in the negative zone, but above the signal line, which gives a weak signal to sell USD/JPY.

Stochastic Oscillator is in the neutral zone, the %K line is above the %D line, which indicates the bullish sentiment.

Trading recommendations
  • Support levels: 106.65, 106.40
  • Resistance levels: 106.95, 107.35, 107.60

If the price fixes below 106.65, USD/JPY quotes are expected to fall. The movement is tending to 106.40-106.20.

An alternative could be the growth of the USD/JPY currency pair to 107.20-107.40.

by JustForex

Disappointing ECB pushes the DAX30 back below 11,000 – further losses to come?

By Admiral Markets

Source: Economic Events May 4, 2020 – Admiral Markets’ Forex Calendar

After German DAX30 saw a short stint back above 11,000 points, it saw a sharp decline at the end of the last week of trading.

In fact, the bullish performance surprised us, given the US GDP data indicating shrinkage by an annualized 4.8% in Q1, ending the longest period of expansion in the country’s history, with the steepest pace of contraction in GDP since Q4/2008 and much worse than market consensus of a 4.0% slump.

The squeeze back above 11,000 points was driven mainly by rumours that Gilead Sciences is approaching early results of a coronavirus drug trial which has shown improvement with a shorter Remdesivir treatment, fuelling hopes that we might be headed towards an effective drug treatment against Covid-19.

Still, the DAX30 closed the week significantly below 11,000 points after the ECB disappointed on Thursday by announcing that it will keep the size of its €750 billion “PEPP” (Pandemic Emergency Purchase Program) and “only” make available, once again, cheaper liquidity for European banks as part of its TLTROIII program.

In our opinion, a rough translation of these ECB measures to promise cheaper and more liquidity for European banks, but keeping PEPP untouched for now could be: “As long as no European unity in regards to a massive economic package to counter the economic Corona-lockdown induced downturn is delivered, we are not increasing the size of our PEPP package.”

That in mind, it leaves room on the downside for the DAX30 CFD and even though we stay short-term and technically stay positive as long as the German index trades above 10,200 points, a sustainable drop back below 10,800 could trigger further weakness in the days to come:

Source: Admiral Markets MT5 with MT5-SE Add-on DAX30 CFD Hourly chart (between April 9, 2020, to May 1, 2020). Accessed: May 1, 2020, at 10:00pm GMT

Source: Admiral Markets MT5 with MT5-SE Add-on DAX30 CFD Daily chart (between January 16, 2019, to May 1, 2020). Accessed: May 1, 2020, at 10:00pm GMT – Please note: Past performance is not a reliable indicator of future results, or future performance.

In 2015, the value of the DAX30 CFD increased by 9.56%, in 2016, it increased by 6.87%, in 2017, it increased by 12.51%, in 2018, it fell by 18.26%, in 2019, it increased by 26.44% meaning that after five years, it was up by 34.2%.

Discover the world’s #1 multi-asset platform

Admiral Markets offers professional traders the ability to trade with a custom, upgraded version of MetaTrader 5, allowing you to experience trading at a significantly higher, more rewarding level. Experience benefits such as the addition of the Market Heat Map, so you can compare various currency pairs to see which ones might be lucrative investments, access real-time trading data, and so much more. Click the banner below to start your FREE download of MT5 Supreme Edition!

Download MetaTrader 5 and begin trading today!

Disclaimer: The given data provides additional information regarding all analysis, estimates, prognosis, forecasts or other similar assessments or information (hereinafter “Analysis”) published on the website of Admiral Markets. Before making any investment decisions please pay close attention to the following:

  1. This is a marketing communication. The analysis is published for informative purposes only and are in no way to be construed as investment advice or recommendation. It has not been prepared in accordance with legal requirements designed to promote the independence of investment research, and that it is not subject to any prohibition on dealing ahead of the dissemination of investment research.
  2. Any investment decision is made by each client alone whereas Admiral Markets shall not be responsible for any loss or damage arising from any such decision, whether or not based on the Analysis.
  3. Each of the Analysis is prepared by an independent analyst (Jens Klatt, Professional Trader and Analyst, hereinafter “Author”) based on the Author’s personal estimations.
  4. To ensure that the interests of the clients would be protected and objectivity of the Analysis would not be damaged Admiral Markets has established relevant internal procedures for prevention and management of conflicts of interest.
  5. Whilst every reasonable effort is taken to ensure that all sources of the Analysis are reliable and that all information is presented, as much as possible, in an understandable, timely, precise and complete manner, Admiral Markets does not guarantee the accuracy or completeness of any information contained within the Analysis. The presented figures refer that refer to any past performance is not a reliable indicator of future results.
  6. The contents of the Analysis should not be construed as an express or implied promise, guarantee or implication by Admiral Markets that the client shall profit from the strategies therein or that losses in connection therewith may or shall be limited.
  7. Any kind of previous or modeled performance of financial instruments indicated within the Publication should not be construed as an express or implied promise, guarantee or implication by Admiral Markets for any future performance. The value of the financial instrument may both increase and decrease and the preservation of the asset value is not guaranteed.
  8. The projections included in the Analysis may be subject to additional fees, taxes or other charges, depending on the subject of the Publication. The price list applicable to the services provided by Admiral Markets is publicly available from the website of Admiral Markets.
  9. Leveraged products (including contracts for difference) are speculative in nature and may result in losses or profit. Before you start trading, you should make sure that you understand all the risks.

By Admiral Markets

Stocks Hit Resistance and Fall, Transportation Sector Forms Topping Pattern

By TheTechnicalTraders 

– Recently, the Transportation Index and the S&P SPDR ETF setup topping patterns near the end of April 2020.  In terms of technical triggers, these patterns need to see additional downside price confirmation before we can confirm the true potential for these setups. If they do confirm, we could be starting a new downside price trend fairly soon.

The recent market upside price move is dramatically different on the TRAN chart vs. the SPY chart.  Even though the SPY price advance has mirrored the move in the ES and NQ, the TRAN upside price move has been more muted.  This is because global economic activity has continued to stall and is not translating into active shipping and trucking activity.  Remember, the Transportation Index helps us to understand the core levels of economic activity as parcels and products move around the globe.

Initially, the downside price break that occurred on Friday, May 1, 2020, which acts as a potential new downside price trend, yet we would want to see the recent lows from 8 days ago breached before we could consider this a truly confirmed trend.  Technical traders may choose how and when to enter new trades/trends – yet we like to teach our followers to wait for true confirmation. I posted a short video about how I analyze the index for new trades here.

Transportation Index (TRAN) Daily Chart

On the TRAN chart, the recent lows near 7,762 would qualify as a breakdown price move.  Thus, if the TRAN sells off below that level, then we would have a confirmed downside price trend expecting 6,500 to be reached again.

SPY Daily Chart

On this SPY chart, a similar type of Three River Evening pattern setup a nearly perfect top over the past four days.  A confirmation appears to be valid on Friday, May 1, 2020.  Yet, we would need to wait to see if the low price level near 272 is breached before we could confirm a true breakdown in this upward price trend.

Skilled traders should pay very close attention to what happens over the next five or more trading days as any new breakdown in price could be very volatile and aggressive.  Our researchers believe the 251.50 level on the SPY would be the next downside target (see the YELLOW ARROW on this chart).

The heavy GREEN Arcing line near the recent peak is our proprietary Fibonacci Price Amplitude Arc representing a very key resistance level (1.618x).  Notice how this level played a very key role in providing initial support in early March and is now acting as a major top/resistance area.

We could be in for a very big ride if a new breakdown begins soon.

SPY Weekly Chart – Reversal Candle

This 35% bounce in the SP500 I called many weeks showing how this very similar setup unfolded during the 2000 market top.

2000 STOCK MARKET TOP & BEAR MARKET THAT FOLLOWED

The chart may look a little overwhelming, but look at each part and compare it to the market psychology chart above. What happened in 2000 is what I feel is happening this year with the stock market sell-off.

In 2000, all market participants learned of at the same time was that there were no earnings coming from their darling .com stocks. Knowing they were not going to make money for a long time, everyone started selling these terrible stocks, and the market collapsed 40% very quickly.

What is similar between 2000 and 2020? Simple really. COVID-19 virus has halted a huge portion of business activity, travel, purchases, sporting events, etc. Everyone knows earnings are going to be poor, and many companies are going to go bankrupt. It is blatantly clear to everyone this is bad and will be for at least 6-12 months in corporate earnings; therefore, everyone is in a rush to sell their stock shares and are in a panic to unload them before everyone does.

Before you continue, be sure to opt-in to our free market trend signals
before closing this page, so you don’t miss our next special report!

2020 STOCK MARKET TOP IS UNFOLDING

As you can see, this chart below of this year’s market crash is VERY similar to that of 2000 thus far, it’s based on a similar mindset.

I posted this chart originally mid-March, expecting a 30+% rally from these lows before the market starts to fall and continue the new bear market, which I believe we are entering. Only the price will confirm the direction and major trend to follow, and since we follow price action and do not pick tops or bottoms, all we have to do is watch, learn, and trade when price favors new low-risk, high reward trade setups.

It does not matter which way the market crashes from here, we will either profit from the next leg down, or will miss/avoid it depending on if we get a tradable setup. Either cause is a win, just one makes money, while the worst-case scenario just preserves capital in a cash position, you can’t complain either way if you ask me.

I have issued an Important Trade and Investment Alert here because a new bear market is potentially just around the corner.

Concluding Thoughts:

As a technical analyst and trader since 1997, I have been through a few bull/bear market cycles in stocks and commodities. I believe I have a good pulse on the market and timing key turning points for investing and short-term swing traders. 2020 is an incredible year for traders and investors.  Don’t miss all the incredible trends and trade setups.

Subscribers of my Active ETF Swing Trading Newsletter had our trading accounts close at a new high watermark. We not only exited the equities market as it started to roll over in February, but we profited from the sell-off in a very controlled way with TLT bonds for a 20% gain. This week we closed out SPY ETF trade taking advantage of this bounce and entered a new trade with our account is at another all-time high value.

Ride my coattails as I navigate these financial markets and build wealth while others watch most of their retirement funds drop 35-65% during the next financial crisis.

Just think of this for a minute. While most of us have active trading accounts, what is even more important are our long-term investment and retirement accounts. Why? Because they are, in most cases, our largest store of wealth other than our homes, and if they are not protected during the next bear market, you could lose 25-50% or more of your net worth. The good news is we can preserve and even grow our long term capital when things get ugly like they are now and ill show you how and one of the best trades is one your financial advisor will never let you do because they do not make money from the trade/position.

If you have any type of retirement account and are looking for signals when to own equities, bonds, or cash, be sure to become a member of my Passive Long-Term ETF Investing Signals which we issued a new signal for subscribers.

Chris Vermeulen
Chief Market Strategies
TheTechnicalTraders.com