Article By RoboForex.com
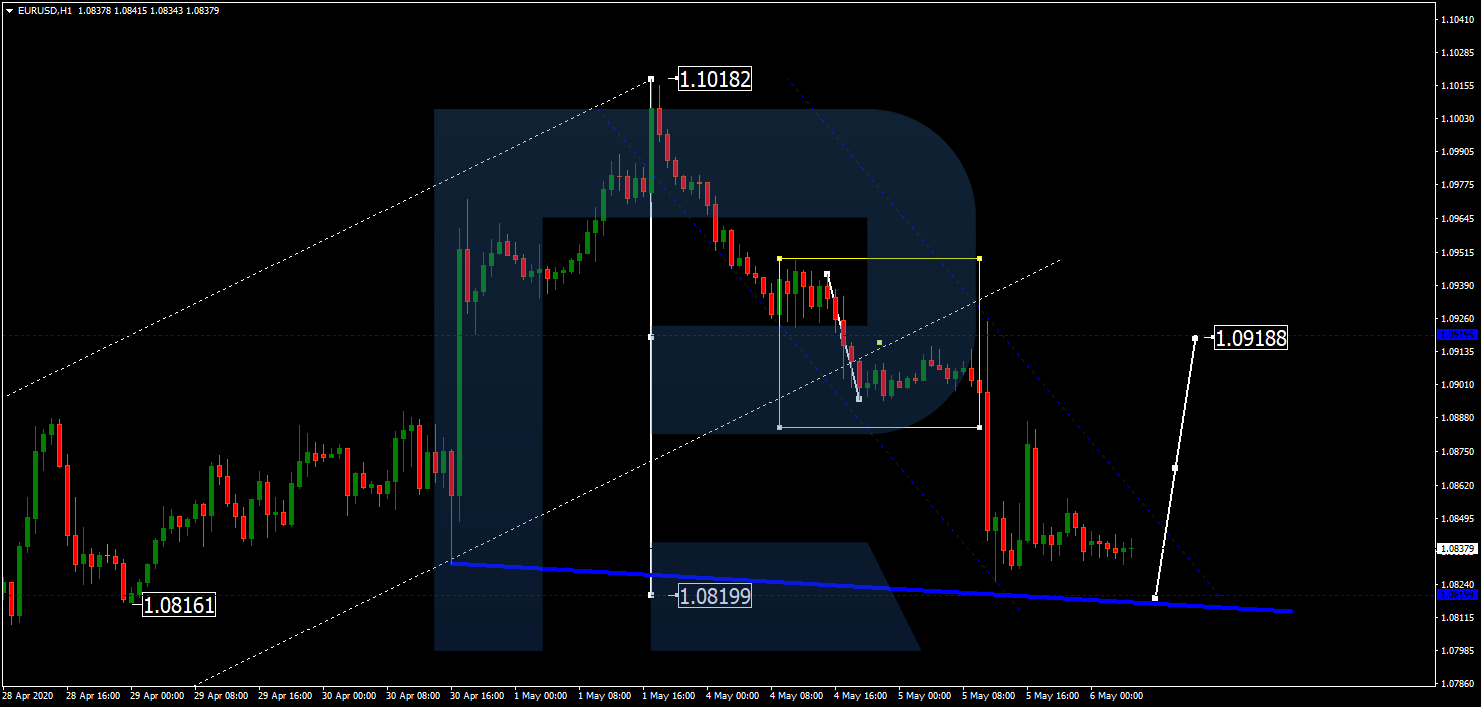
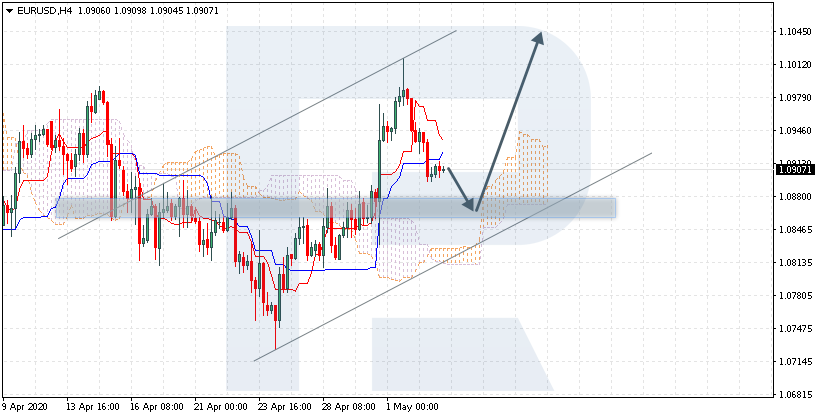
EURUSD, “Euro vs US Dollar”
After rebounding from 1.0900, EURUSD continues falling with the target at 1.0820. According to the main scenario, the price is expected to reach this level and then consolidate near these lows. After that, the instrument may break the range to the upside and start a new correction to return to 1.0900 and test it from below.

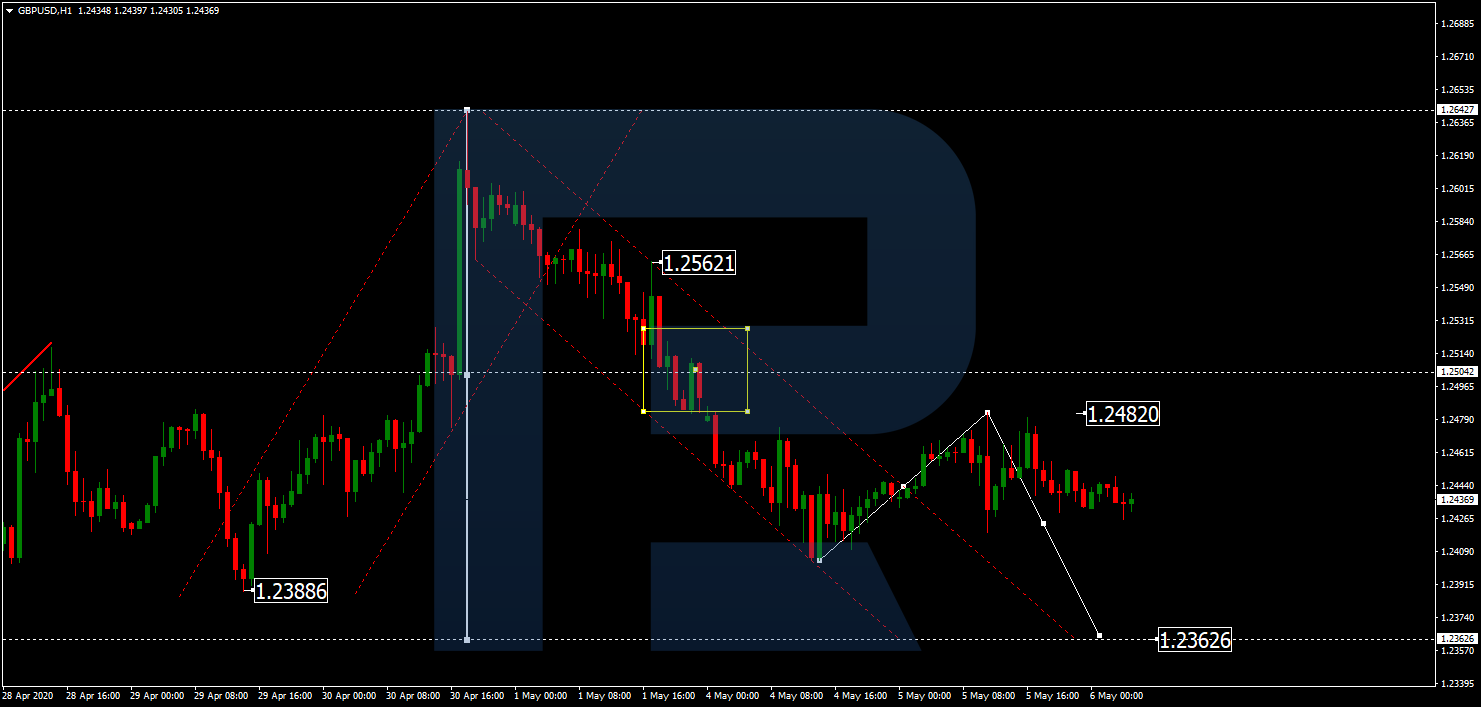
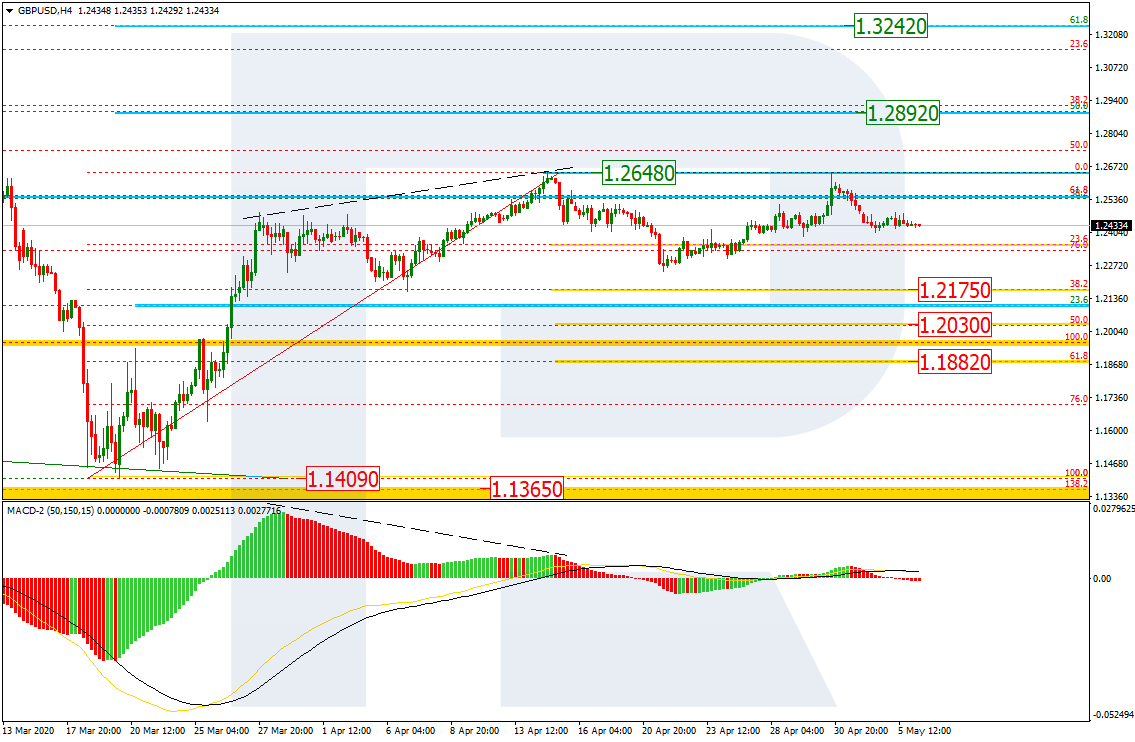
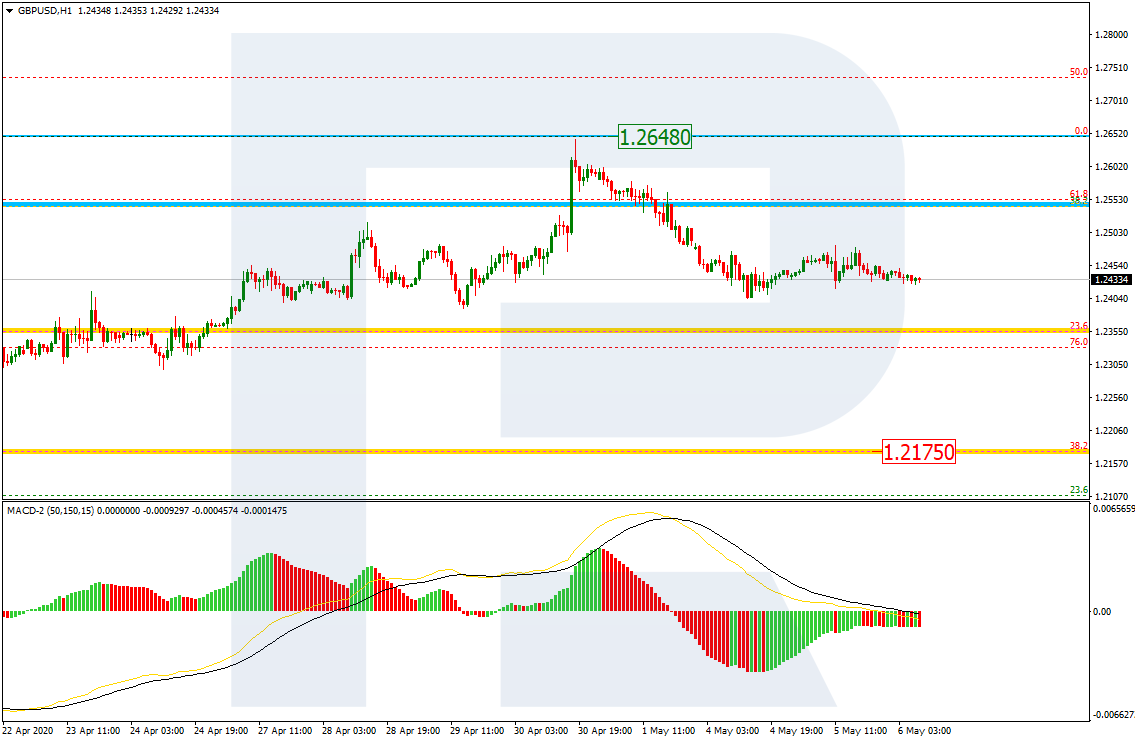
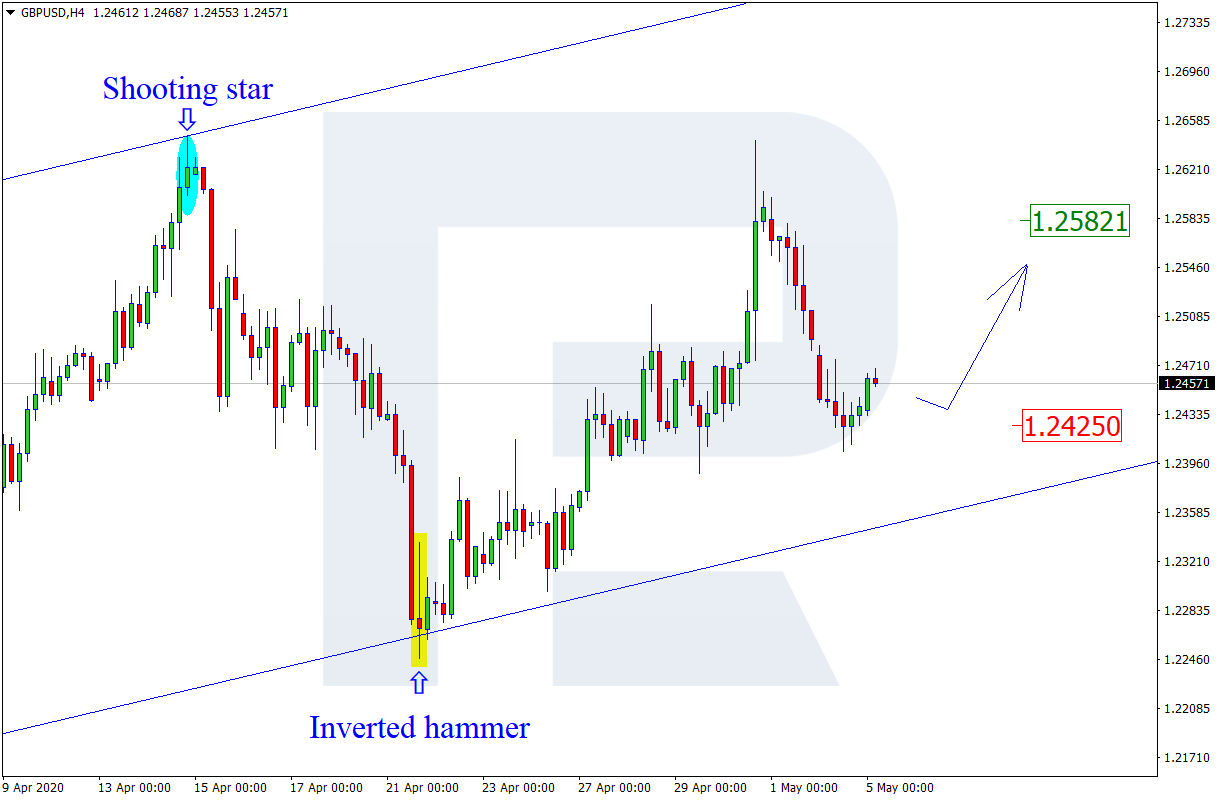
GBPUSD, “Great Britain Pound vs US Dollar”
After completing the correction at 1.2482, GBPUSD is forming a new descending structure with the first target at 1.2363. Later, the market may consolidate near these lows. After that, the instrument may break the range to the upside and start another correction towards 1.2500.
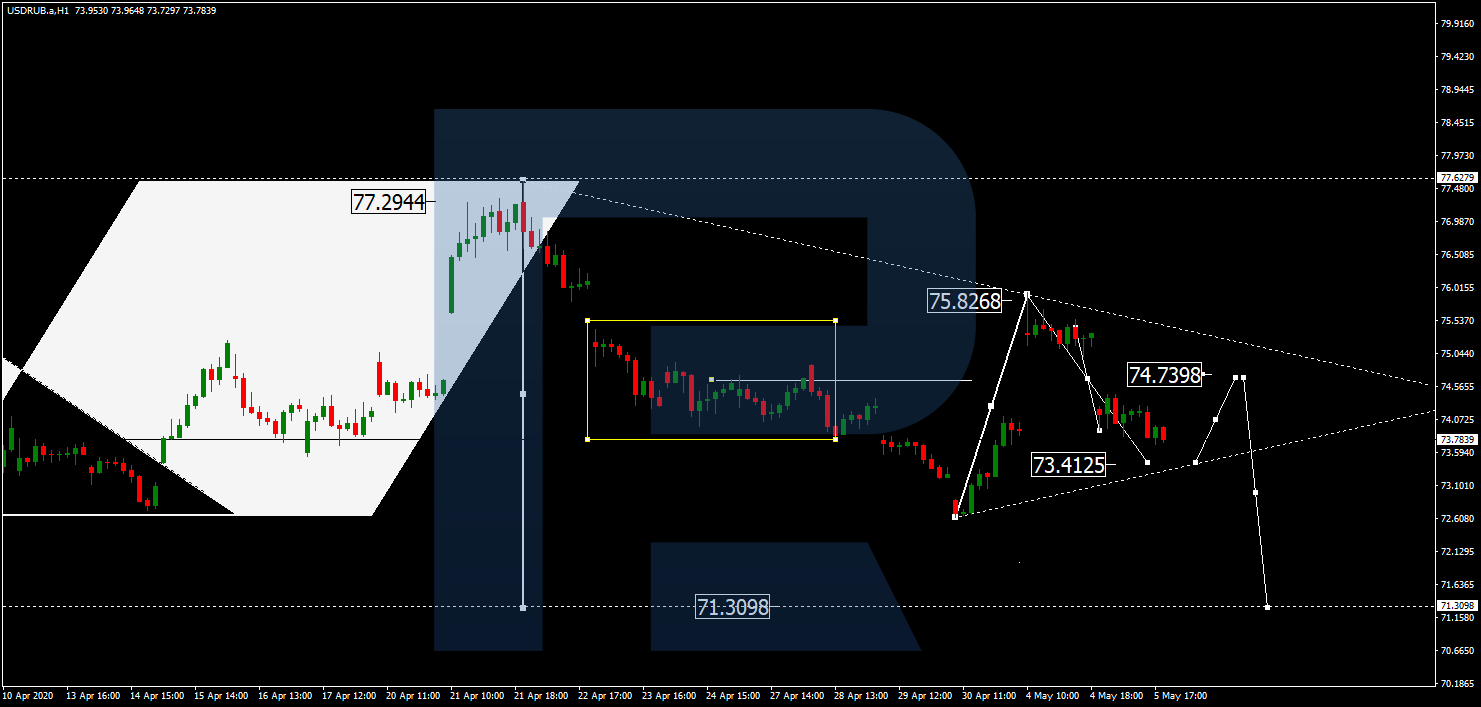
USDRUB, “US Dollar vs Russian Ruble”
USDRUB continues falling towards 73.41. After that, the instrument may start a new growth to reach 74.74 and then resume trading downwards with the short-term target at 71.30.
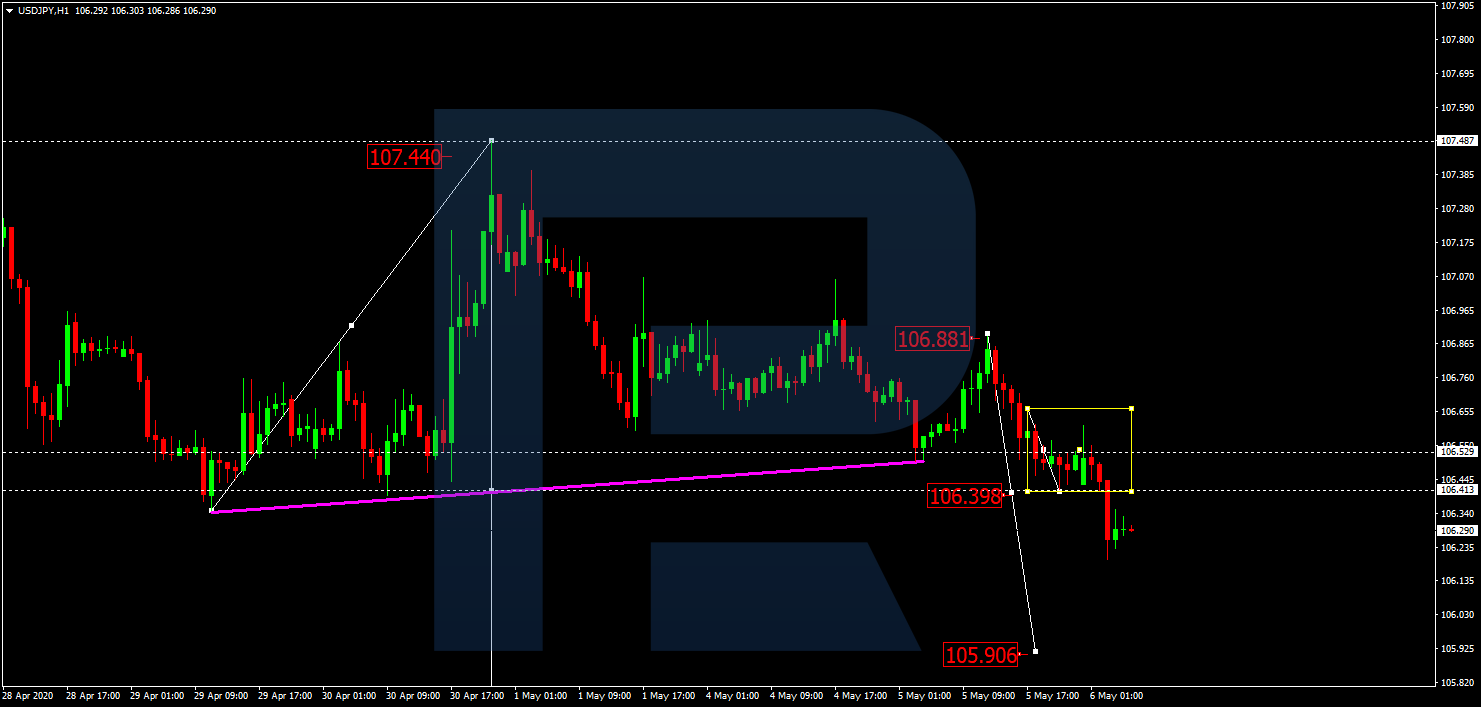
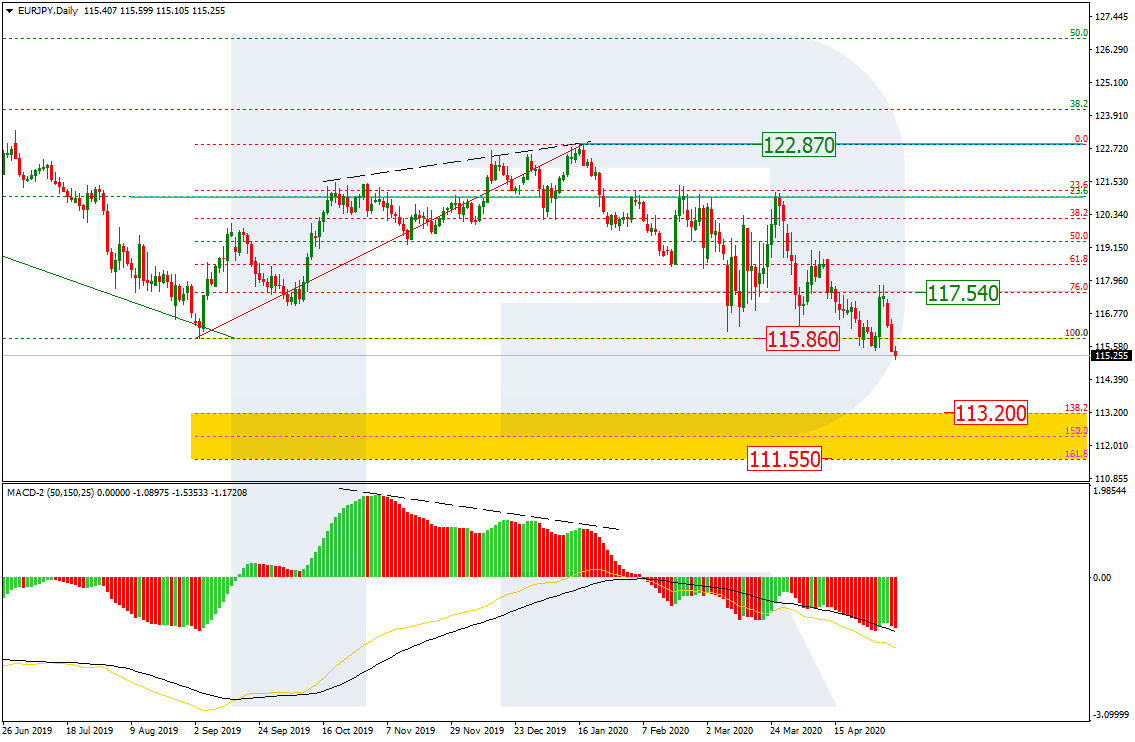
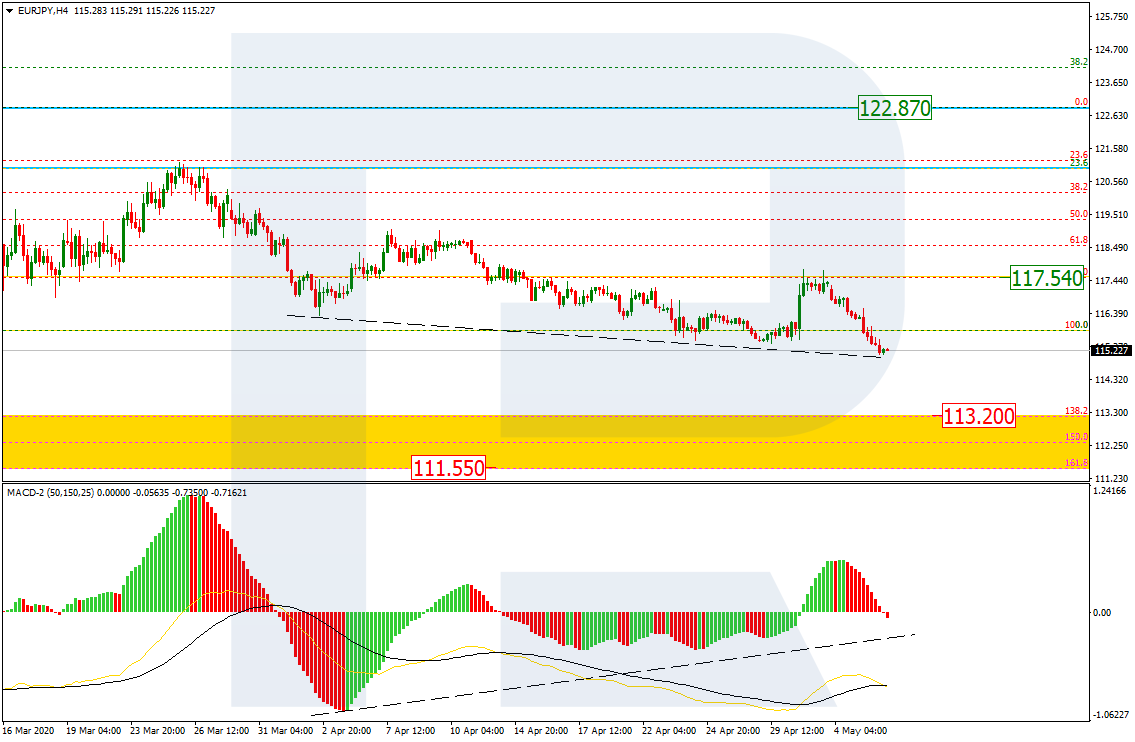
USDJPY, “US Dollar vs Japanese Yen”
After finishing the correction at 106.88 and then rebounding from this level to the downside, USDJPY has broken 106.60. The main scenario implies that the price may continue trading downwards with the short-term target at 107.55.
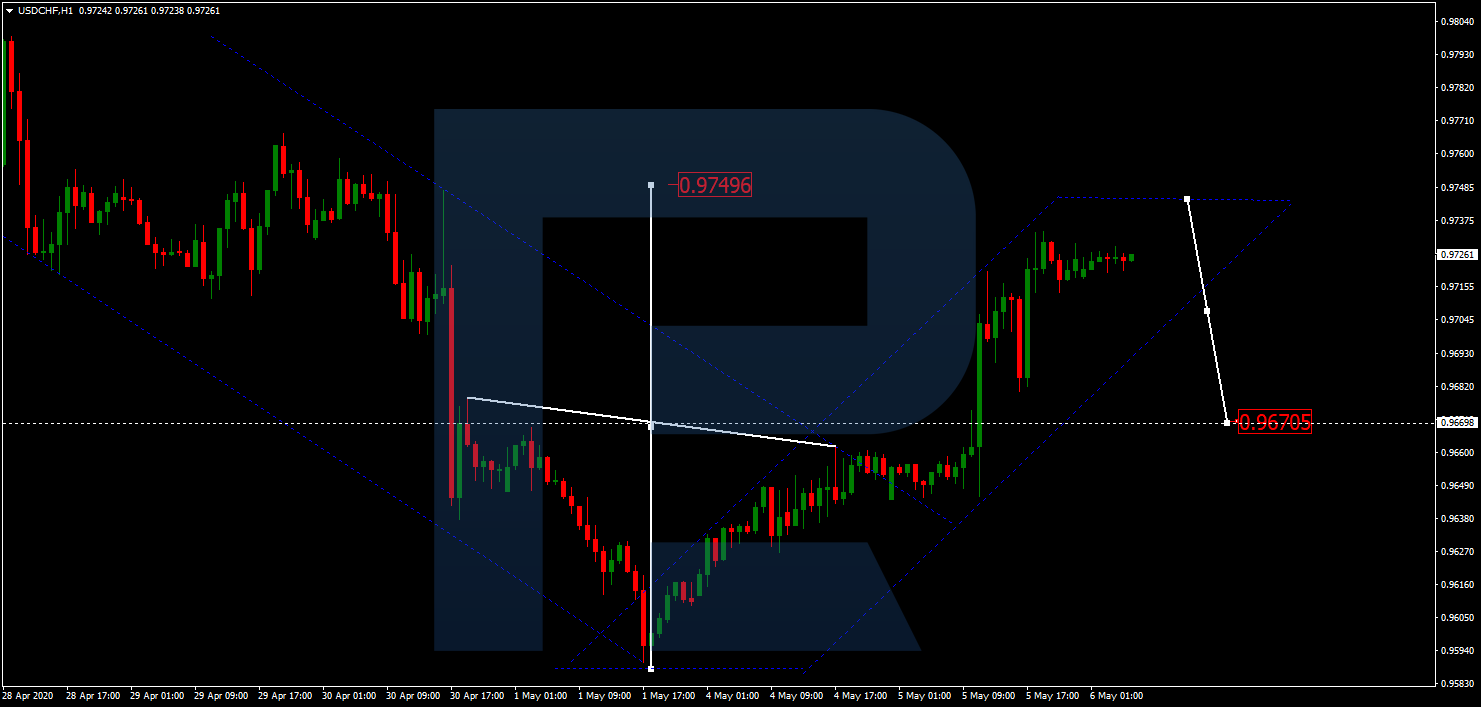
USDCHF, “US Dollar vs Swiss Franc”
After breaking 0.9670 to the upside, USDCHF is expected to continue growing towards 0.9750. Today, the pair may reach this level and then consolidate near these highs. Later, the market may break the range to the downside and start another correction to return to 0.9670.
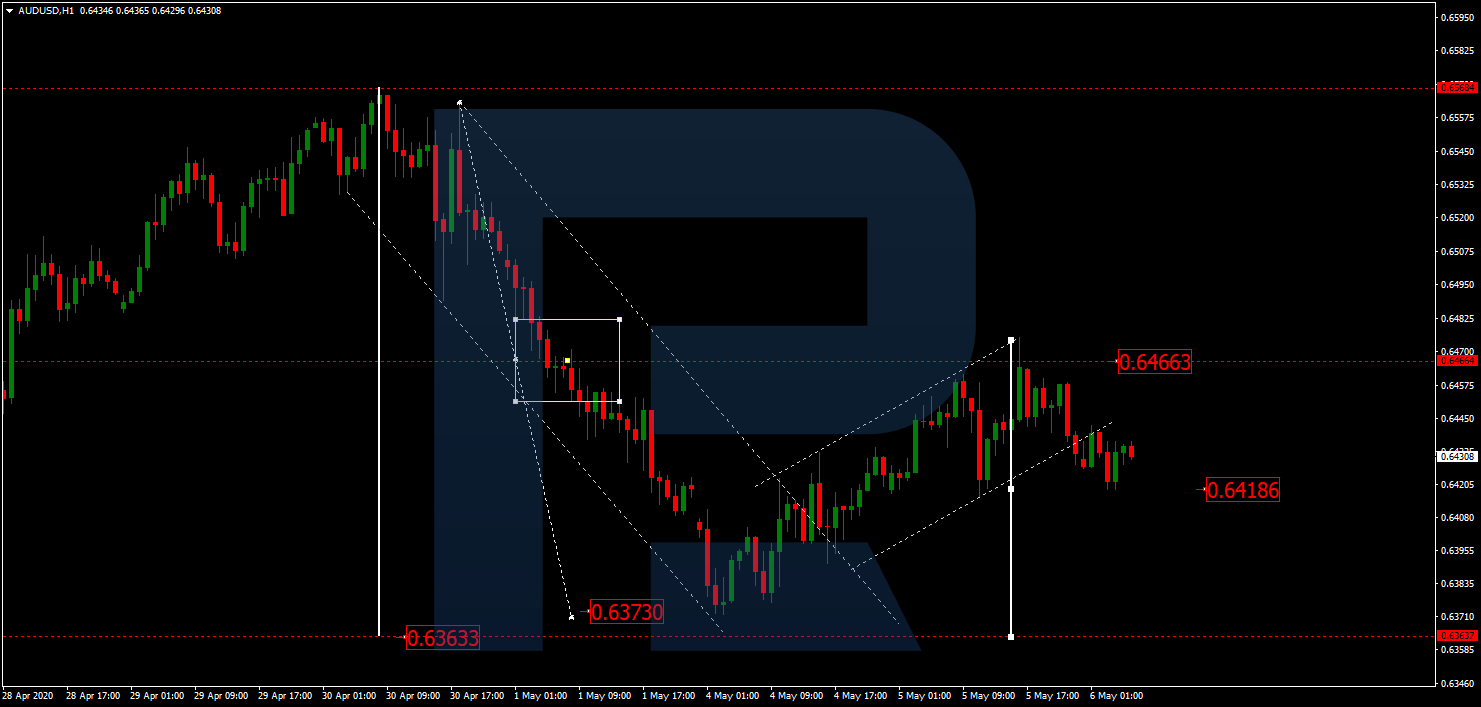
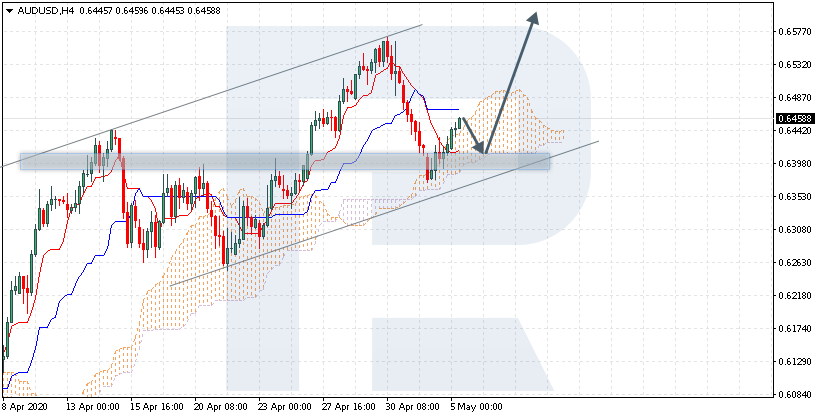
AUDUSD, “Australian Dollar vs US Dollar”
After completing the correction at 0.6466 and then forming a new consolidation range below this level, AUDUSD has broken it to the downside. Possibly, the pair may continue falling towards 0.6363 and then consolidate near these lows. After that, the instrument may break the range to the upside and form one more ascending correction with the target at 0.6464.
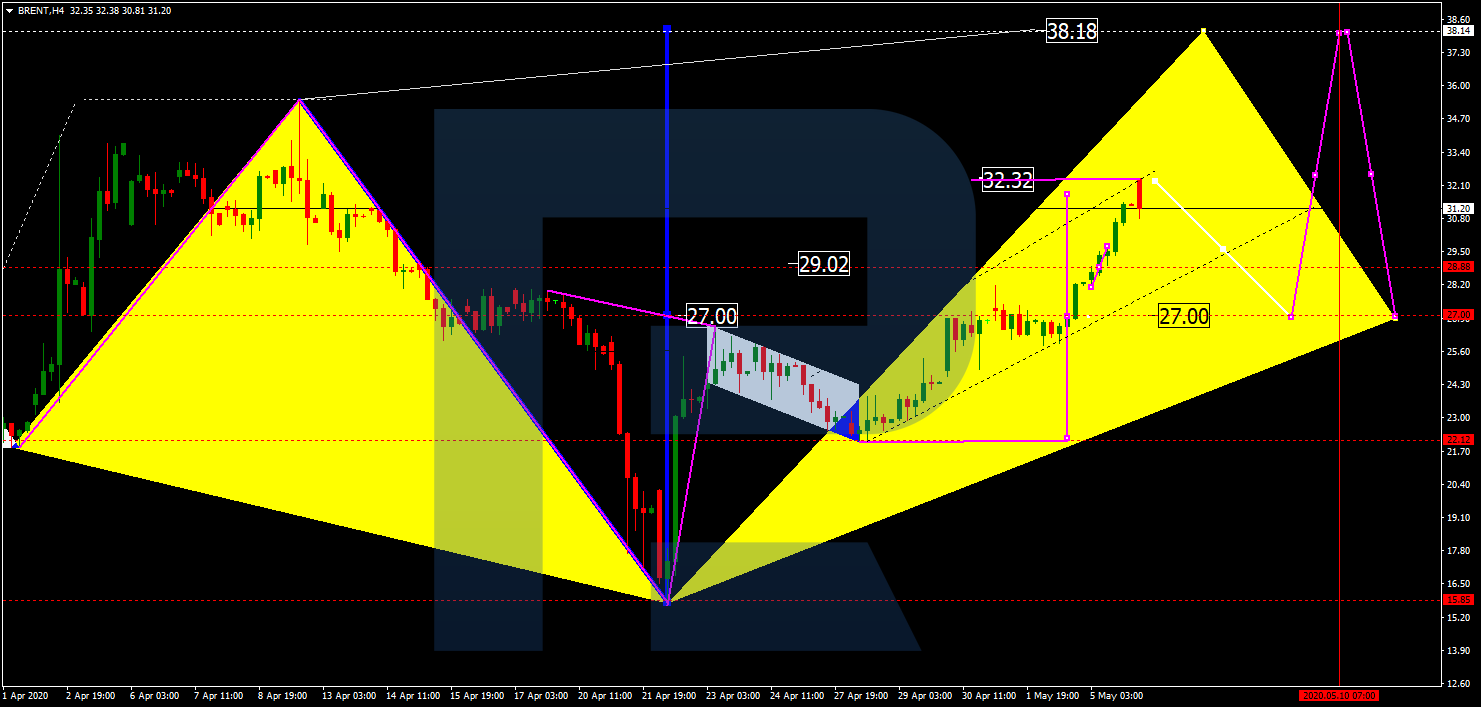
BRENT
After finishing the third ascending wave at 32.32, Brent is expected to consolidate close to these highs. After that, the instrument may break the range to the downside and correct towards 27.00. Later, the market may resume trading upwards with the first target at 38.20.
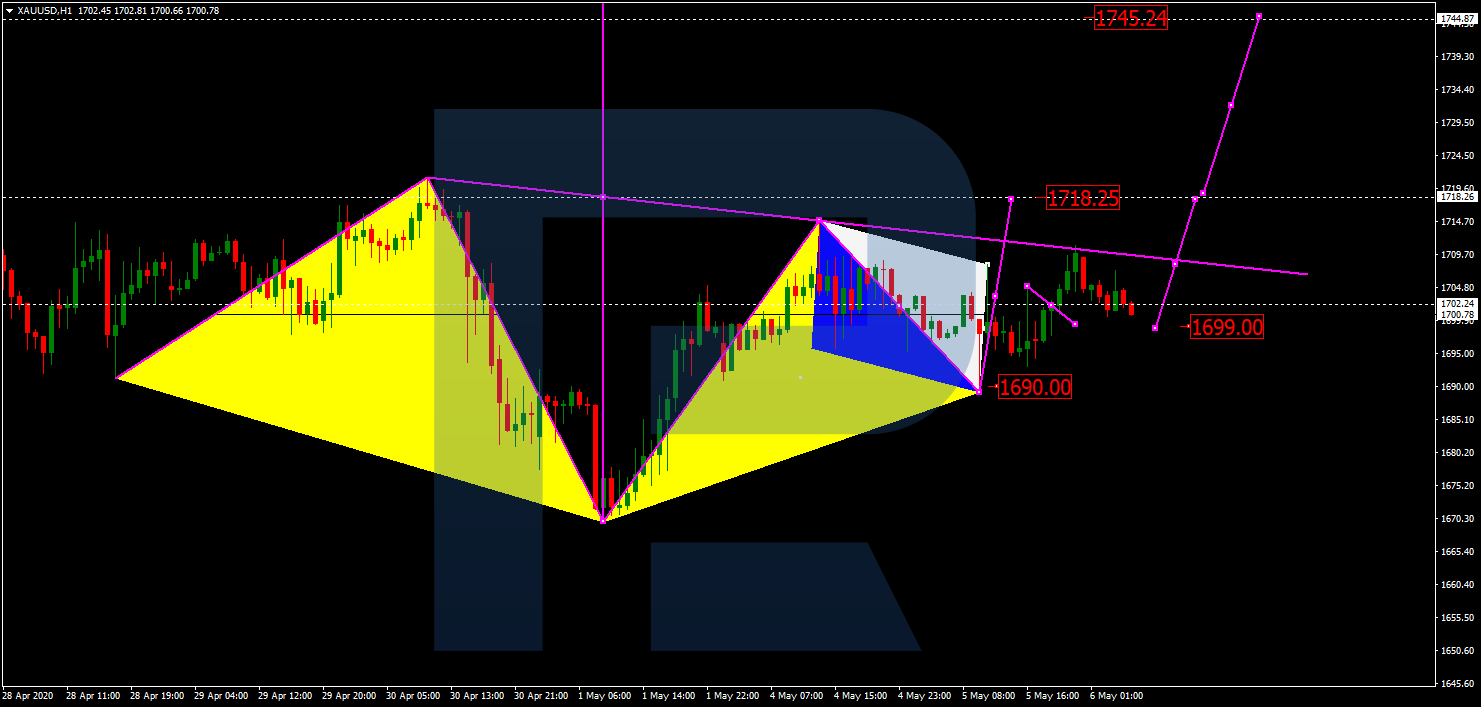
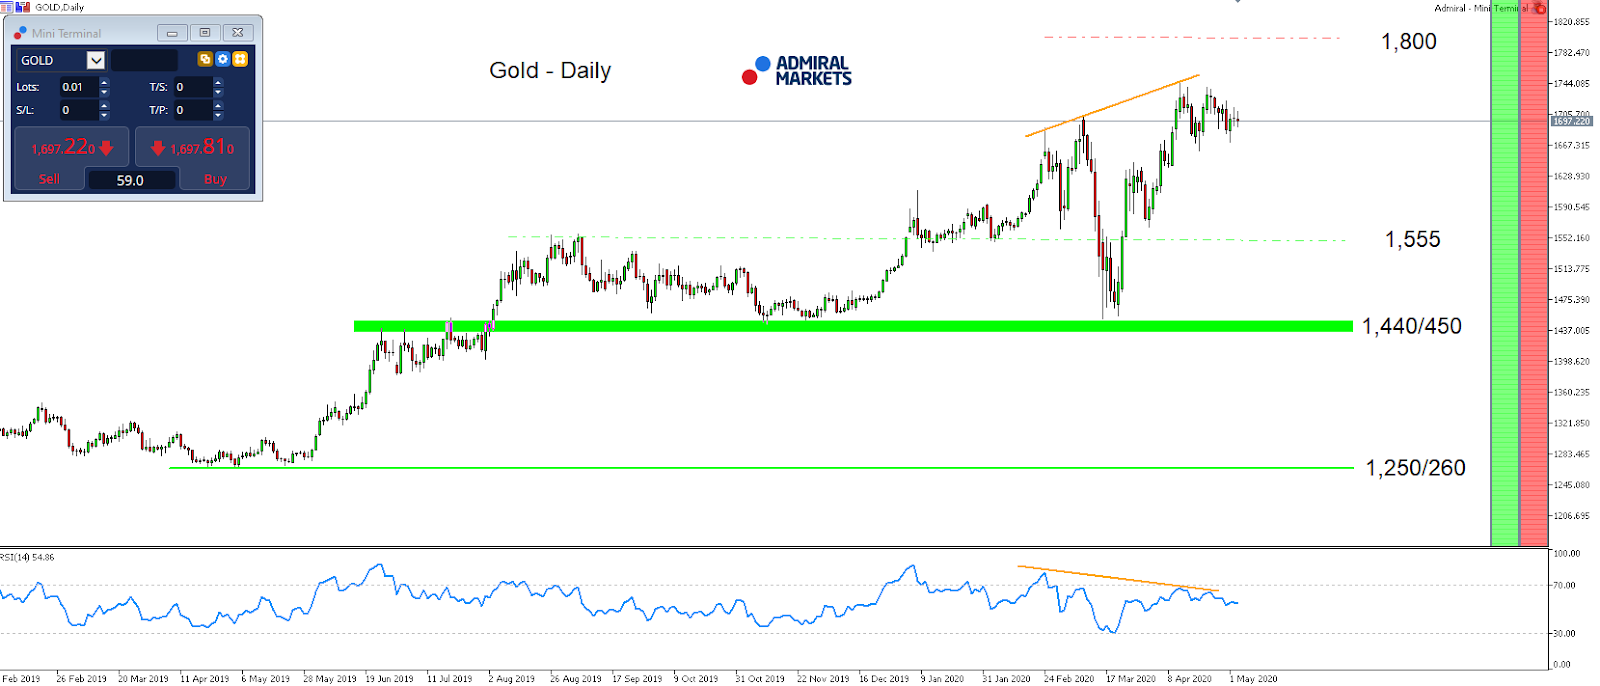
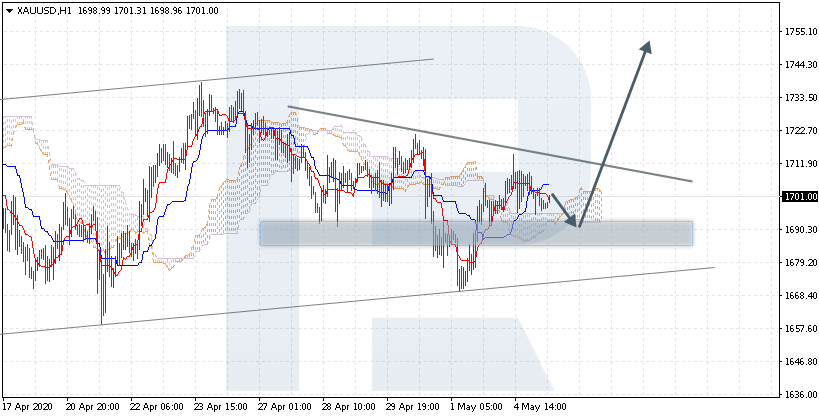
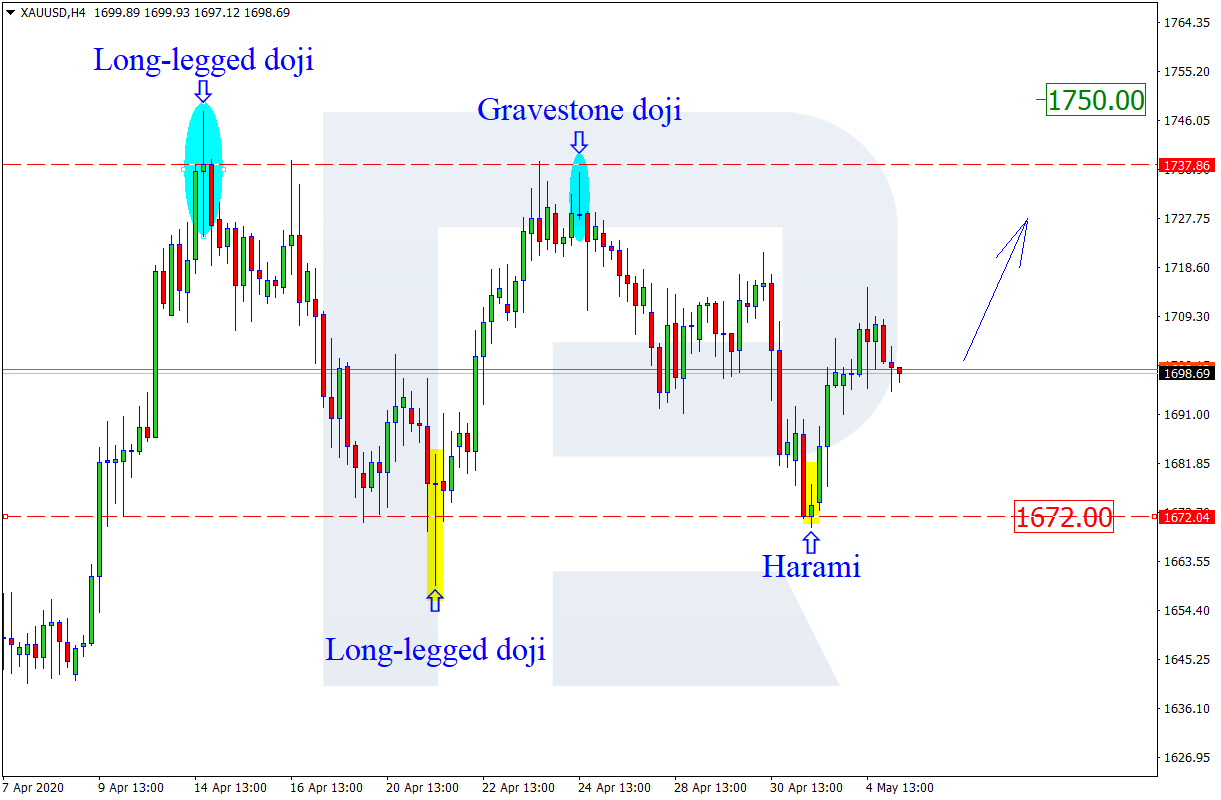
XAUUSD, “Gold vs US Dollar”
After reaching the correctional target at 1690.00, Gold is forming another ascending wave towards 1718.25. After that, the instrument may consolidate around this level. If later the price breaks the range to the upside, the market may continue growing with the short-term target at 1745.25.
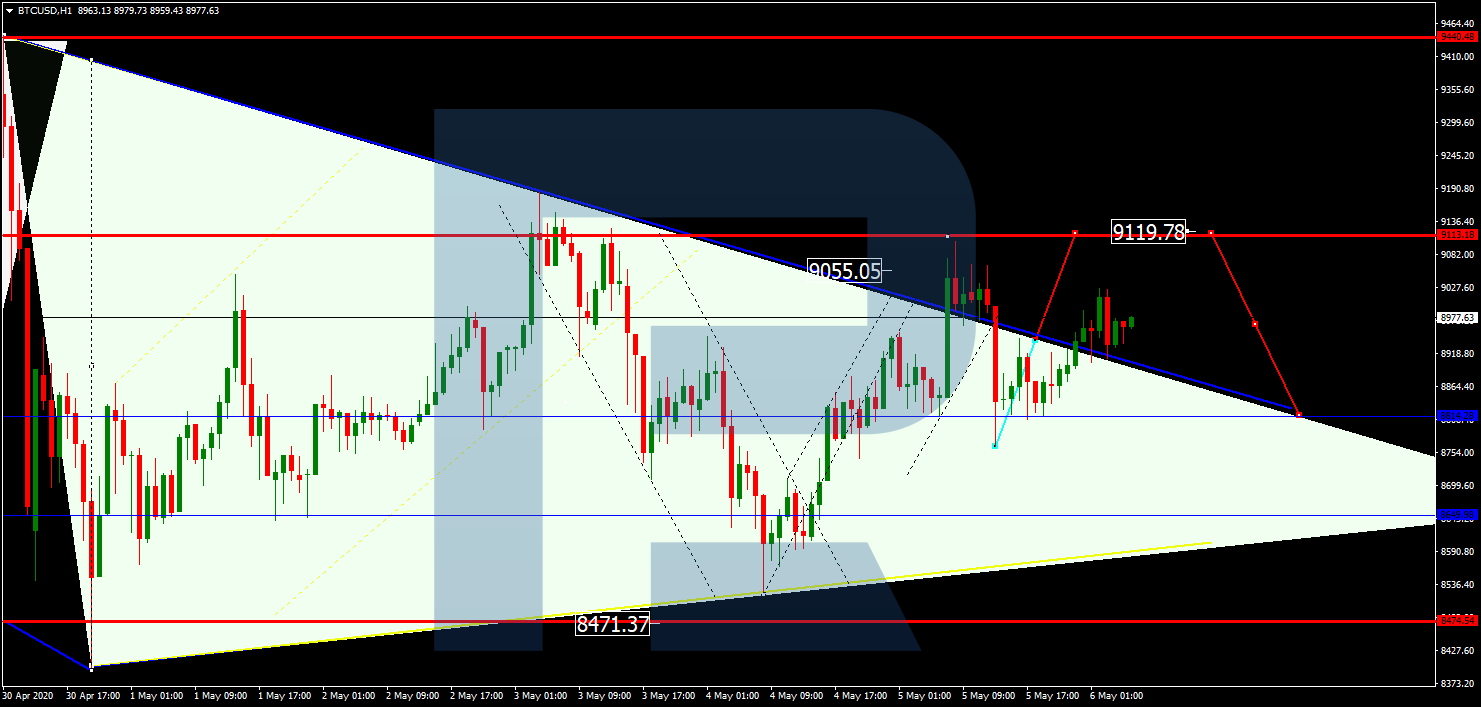
BTCUSD, “Bitcoin vs US Dollar”
After completing the correction at 8800.00 and rebounding from this level to the upside, BTCUSD is forming another ascending structure towards 9120.00. After that, the instrument may consolidate. If later the price breaks this range to the downside, the market may start a new correction to return to 8800.00; if to the upside – resume trading upwards with the target at 10000.00.
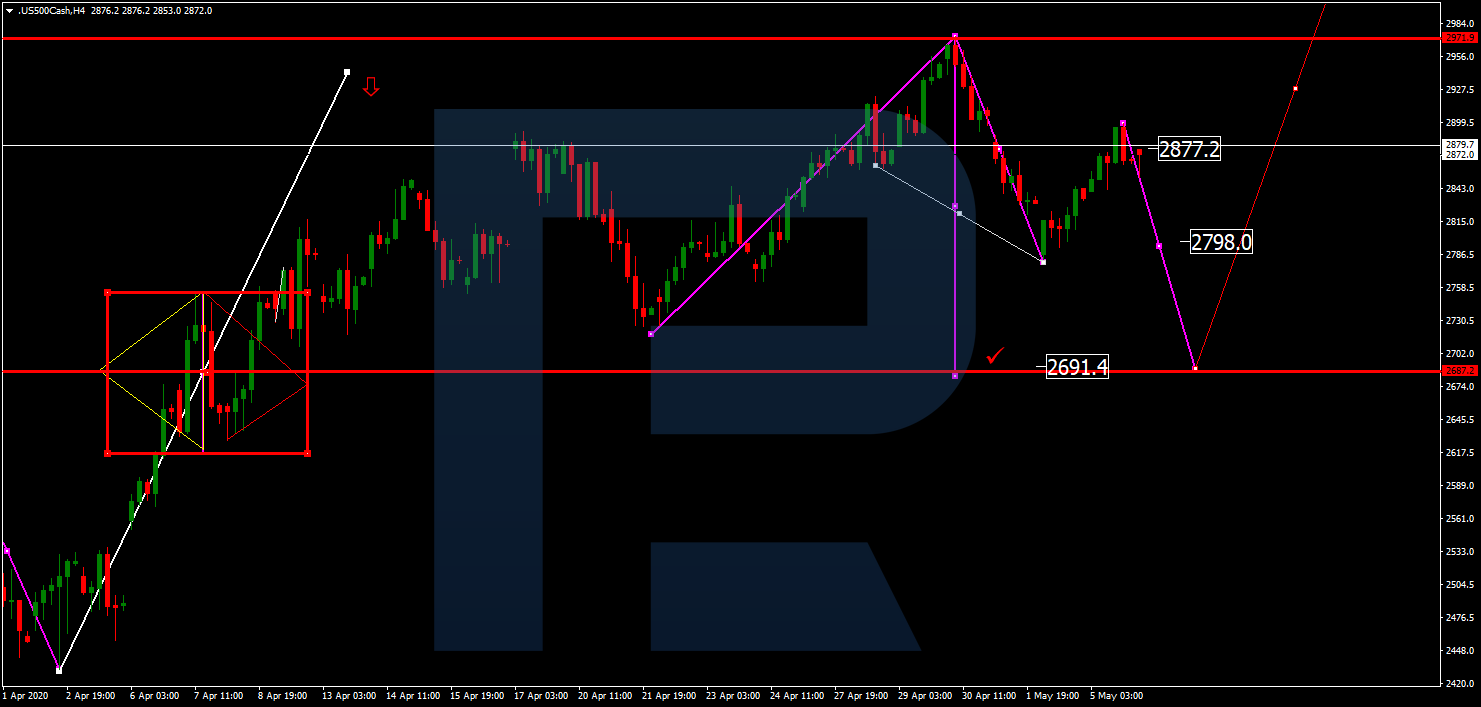
S&P 500
After finishing the correction at 2877.2, the Index is falling with the target at 2798.0. Later, the market may consolidate. After that, the instrument may break the range to the downside and the form a new descending structure towards 2691.4.
Article By RoboForex.com
Attention!
Forecasts presented in this section only reflect the author’s private opinion and should not be considered as guidance for trading. RoboForex LP bears no responsibility for trading results based on trading recommendations described in these analytical reviews.


