Author Archive for InvestMacro – Page 46

Rwanda’s coffee harvest will go forward despite pandemic – at a safe distance

By Andrew Gerard, Michigan State University and David L. Ortega, Michigan State University

As countries begin to reopen after months of coronavirus lockdown, Rwanda is pressing on with its May coffee harvest.

Rwanda, which supplied 21,000 tons of coffee to the global market in 2019, is about the world’s 30th top coffee supplier. It is known, proudly, for the quality of its beans, not the quantity.

After two decades of targeted investment by industry leaders, Rwandan coffee – once sold primarily in supermarket blends – is now available at Starbucks and upscale cafes alike.

But with coffee shops closing worldwide, the coronavirus crisis is testing Rwanda’s top export.

COVID-19 and coffee in Rwanda

Rwanda appears to have been successful in keeping COVID-19 at bay so far. The Central African country of 12 million reported just over 250 cases as of early May.

In March the government locked down the capital of Kigali, halted commercial flights and banned domestic travel for all nonessential workers. Coffee production, which provides an income to 350,000 Rwandan farming families, has been allowed to continue – in modified fashion.

To analyze the effects of COVID-19 restrictions on Rwanda’s coffee industry, we drew on information from our five-year research project funded by the U.S. Agency for International Development and interviewed local collaborators and international industry experts.

As a critical sector of the Rwandan economy, coffee is a sensitive topic in the country, so our contacts in Rwanda preferred to speak anonymously. The quotes included here are drawn from our interview notes and their accuracy checked with our sources.

Our analysis finds that health restrictions are increasing coffee production costs in Rwanda and introducing delays to the global supply chain that consumers halfway across the world may eventually feel.

Open but restricted

Rwandan coffee farmers must adhere to social distancing guidelines during the May harvest, keeping coffee pickers one meter apart. As a result, according to two Rwandan coffee sector experts who work with farmers, they are hiring fewer workers. That may increase the time it takes to pick the same acreage.

Since not all workers in the coffee sector are considered essential, Rwanda’s strict travel restrictions are also slowing coffee’s journey from farm to cup.

“I cannot even legally drive out to our roastery, even though it is just a few kilometers away,” the manager of one Rwandan coffee roasting facility told us.

To avoid contact between buyers and farmers, some processing mills – which prepare fresh coffee beans, or “cherries,” for export and roasting by removing the skin and pulp – are asking farmers to deliver their harvest themselves, rather than send trucks for pickup.

Few farmers in Rwanda own cars or motorcycles – less than 3%, based on our research. So they must deliver their coffee on foot, traveling on average 3.5 miles. A round trip that normally takes minutes may now take two hours.

Once the coffee reaches the mill, hurdles to processing arise.

“My company has two agents who are allowed to travel to mills to oversee operations, but they must be tested for COVID-19” at police checkpoints when entering a new district, a Rwandan coffee buyer told us.

Sorting and milling of coffee is also likely to take substantially longer due to decreased staffing in compliance with social distancing regulations.

To keep on-site workers safe, mills are setting up hand washing stations and distributing hand sanitizer, but many are struggling to get required protective equipment like face masks, which have surged in price due to increased demand.

Vista of Rwandan coffee country.
Andrew Gerard, CC BY

Global production disruptions

Sucafina, a multinational coffee trading company, reports similar supply chain disruptions in coffee-producing countries worldwide.

Colombia, the top supplier of coffee to the U.S., is under a strict national quarantine. There, coffee farmers report difficulty picking, packaging, delivering and selling their harvest.

“We are preventing the economic activity that can reactivate the economy of coffee-producing regions,” warned Roberto Vélez Vallejo of Colombia’s National Federation of Coffee Growers – which sells coffee under the brand Juan Valdez – via Tweet.

To overcome such challenges, Rwanda’s coffee farmers are turning to mobile technology.

Despite pervasive poverty, many Rwandan coffee farmers own mobile phones, and the country has worked hard to build a robust mobile network even in rural areas. That’s a critical resource right now, since the Rwandan government has mandated that payments between coffee mills and farmers be cashless.

Rwandan coffee farmers are also benefiting from being highly organized. The country has many agricultural cooperatives, which in normal times meet in person, provide direct services and help farmers negotiate collectively with buyers.

Now, co-op leaders are using text messaging to share information about coffee prices, social distancing protocols and other coronavirus-related topics with members.

Shifting demand

Neither technology nor unions can solve what is perhaps the biggest problem facing Rwandan coffee’s industry: a global coffee market in upheaval.

Across the United States and Europe – which together import over 60% of the world’s coffee – COVID-19 containment measures have shut down cafes, shifting where demand is located.

In the U.S., which has a US$47.5 billion coffee shop industry, about a quarter of coffee consumption normally takes place away from home. Recently, this figure has come close to zero.

To serve coffee drinkers stuck at home, roasters must pivot to online and grocery sales – a difficult transition, especially for small players competing with chains like Starbucks.

International uncertainty is trickling down to Rwandan farmers in the form of broken contracts. One major Rwandan coffee exporter told us several buyers had either reduced or delayed finalizing their planned purchases.

Ruth Church, of the U.S.-based Artisan Coffee Importers, which specializes in Rwandan coffee, said she worried her clients would reduce orders too, but has since gotten confirmation that they will maintain last year’s purchasing levels.

“That comes from the relationship they’ve been able to form with the farmer,” she said of her buyers. “They know producers are vulnerable.”

But, Church warned, “Others may be forced to cancel or reduce.”

Rwandan coffee is adapting to get coffee to market. Now they hope someone will buy it.

Bridget Vuguziga, an independent consultant based in Kigali, Rwanda, contributed to this analysis.

About the Author:

Andrew Gerard, Research Assistant, Department of Community Sustainability, Michigan State University and David L. Ortega, Associate Professor of Food and Agricultural Economics, Michigan State University

This article is republished from The Conversation under a Creative Commons license. Read the original article.

Demand for financial advice surges 24% as priorities shift in new era

By George Prior

As individuals, households and businesses readjust and look ahead to a new era and recovery, demand for financial advice is up by almost a quarter, reveals one of the world’s largest independent financial advisory organizations.

deVere Group, which operates in 100 countries worldwide, says the number of enquiries from new clients was up 24% in April, compared to the previous month.

Of the findings, Nigel Green, the founder and chief executive of deVere Group, observes: “Disruption and dislocation have hit entire economies and businesses of all sizes and in all sectors.

“This has had a very real and very immediate impact on the finances of individuals, households and businesses around the world.

“Suddenly, unexpectedly, many have realised that they didn’t have sufficient money behind them, they didn’t have contingency plans.

“This, as they know, could have consequences for the lifestyles and life opportunities of themselves and loved ones and, for those in business, for the long-term sustainability of their firm.

“With financial matters back in sharp focus, for many ‘I should have’ becomes ‘I need to have.’

“This most unusual situation has dramatically underscored that no-one really knows what is around the corner. Now more than ever people are seeking to be as financially prepared as they can for any eventuality.”

He continues: “The same thing happened following the 2008 financial crash. That too served as a wake-up call to many people to ensure that they become financially secure and there was a subsequent increase in demand for advice.

“Even then – when confidence in financial institutions, especially traditional banks, was at an all-time low – people understood that as the world evolves, your financial planning strategies might need to also.”

This, says Nigel Green, is driving the increasing demand. But in this tech-driven era, how do people want this advice delivered?

According to a poll carried out by deVere amongst existing and prospective clients, 52% said ‘face-to-face, 42% said they prefer videocall platforms like Zoom, and 6% answered ‘by telephone.’

“Given the circumstances and how much things have changed, I quite was surprised that the preferred option for the delivery of financial advice remains face-to-face.

“But video communication is only 10% behind, which is quite something as it is a new platform for most people.

“The survey underscores that increasingly people want bespoke financial advice combined with innovative technology.”

Mr Green goes on to add: “We can be in no doubt that the world has already fundamentally changed – and it will do so more and maybe at a faster pace.”

This was highlighted by the deVere poll which revealed that 72% of client respondents feel the world has changed permanently.

In addition, 80% said that in a similar way to after the 2008 crash, new companies will emerge and the same ones that were successful in the past were not guaranteed to succeed again.

“With these shifts impacting people’s finances, the majority of our new clients are seeking advice on savings plans, investments, foreign exchange, pensions and retirement planning and tax planning,” he notes.

The deVere CEO concludes: “2020 has been a year of change.  For an increasing number, this includes a change in the way we prioritise, with long-term financial security for ourselves and our loved ones ever-more important.”

About:

deVere Group is one of the world’s largest independent advisors of specialist global financial solutions to international, local mass affluent, and high-net-worth clients.  It has a network of more than 70 offices across the world, over 80,000 clients and $12bn under advisement.

Ichimoku Cloud Analysis 07.05.2020 (EURUSD, USDJPY, BTCUSD)

Article By RoboForex.com

EURUSD, “Euro vs US Dollar”

EURUSD is trading at 1.0801; the instrument is moving below Ichimoku Cloud, thus indicating a bearish tendency. The markets could indicate that the price may test Tenkan-Sen and Kijun-Sen at 1.0835 and then resume moving downwards to reach 1.0645. Another signal to confirm further descending movement is the price’s rebounding from the rising channel’s downside border. However, the scenario that implies further decline may be canceled if the price breaks the cloud’s upside border and fixes above 1.0955. In this case, the pair may continue growing towards 1.1045.

EURUSD
Risk Warning: the result of previous trading operations do not guarantee the same results in the future

USDJPY, “US Dollar vs Japanese Yen”

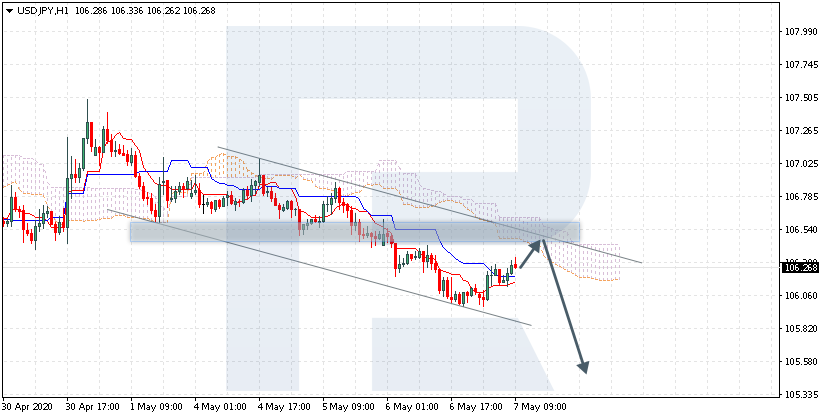
USDJPY is trading at 106.26; the instrument is moving below Ichimoku Cloud, thus indicating a descending tendency. The markets could indicate that the price may test the cloud’s downside border at 106.50 and then resume moving downwards to reach 105.55. Another signal to confirm further descending movement is the price’s rebounding from the descending channel’s upside border. However, the scenario that implies further decline may be canceled if the price breaks the cloud’s upside border and fixes above 106.80. In this case, the pair may continue growing towards 107.55.

USDJPY
Risk Warning: the result of previous trading operations do not guarantee the same results in the future

BTCUSD, “Bitcoin vs US Dollar”

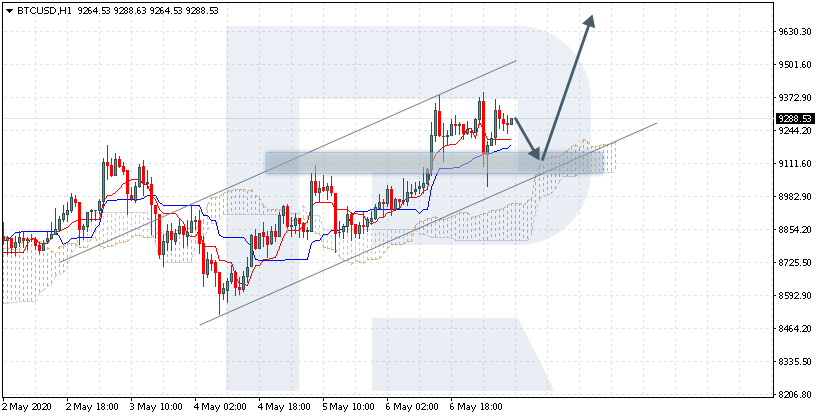
BTCUSD is trading at 9288.00; the instrument is moving above Ichimoku Cloud, thus indicating a bullish tendency. The markets could indicate that the price may test the cloud’s upside border at 9110.00 and then resume moving upwards to reach 9665.00. Another signal to confirm further ascending movement is the price’s rebounding from the rising channel’s downside border. However, the scenario that implies further growth may be canceled if the price breaks the cloud’s downside border and fixes below 8845.00. In this case, the pair may continue falling towards 7995.00.

BTCUSD

Article By RoboForex.com

Attention!
Forecasts presented in this section only reflect the author’s private opinion and should not be considered as guidance for trading. RoboForex LP bears no responsibility for trading results based on trading recommendations described in these analytical reviews.

Japanese Candlesticks Analysis 07.05.2020 (EURUSD, USDJPY, EURGBP)

Article By RoboForex.com

EURUSD, “Euro vs. US Dollar”

As we can see in the H4 chart, after falling towards the support level and forming a Hammer pattern, EURUSD is reversing. We may assume that later the price may rebound towards 1.0920 to continue the ascending tendency. At the same time, there is another scenario, which implies that the price may continue falling to reach 1.0740.

EURUSD
Risk Warning: the result of previous trading operations do not guarantee the same results in the future

USDJPY, “US Dollar vs. Japanese Yen”

As we can see in the H4 chart, USDJPY is testing the support level. By now, it has formed several reversal patterns, including Harami. However, the reversal signal seems to be false and the pair may yet resume moving downwards after a slight pullback. In this case, the downside target may be 105.80.

USDJPY
Risk Warning: the result of previous trading operations do not guarantee the same results in the future

EURGBP, “Euro vs. Great Britain Pound”

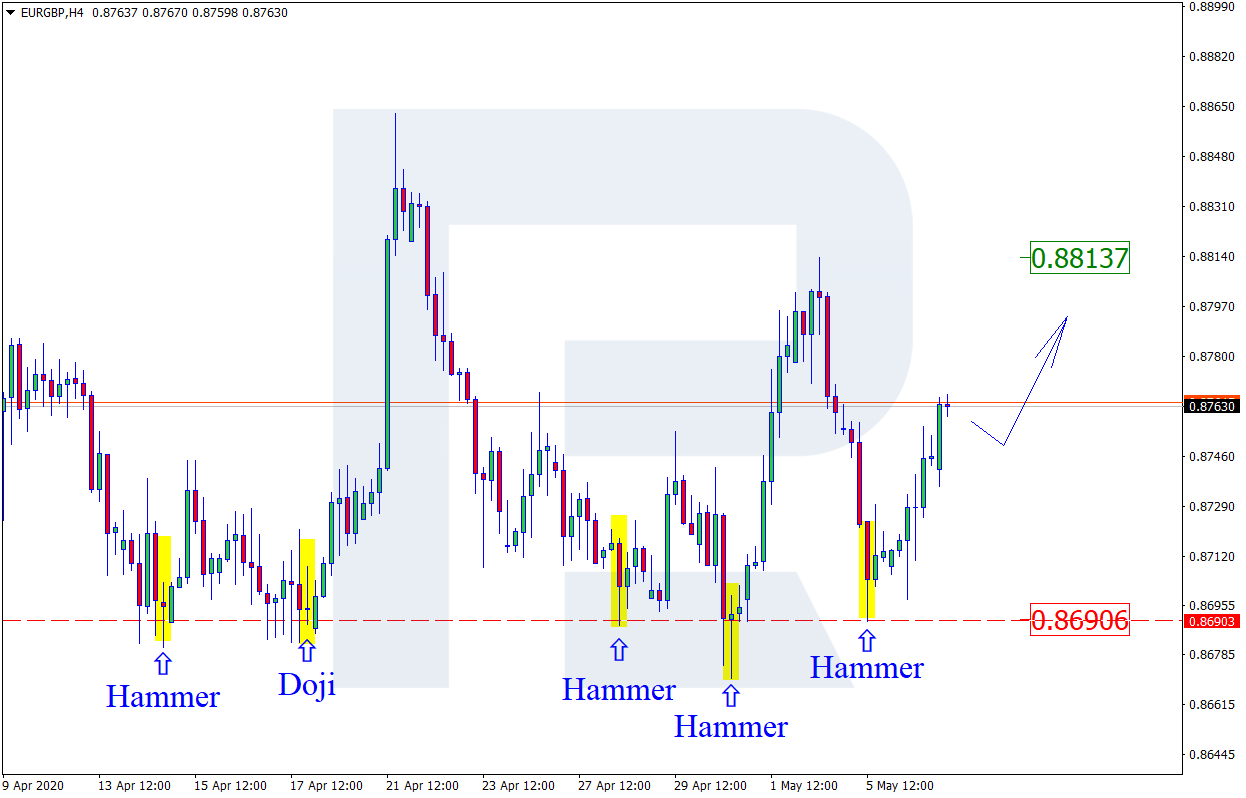
As we can see in the H4 chart, after forming another Hammer pattern and rebounding from the support level, EURGBP continues growing. We may assume that later the pair may form one more slight correction and then continue moving towards the resistance level. In this case, the upside target may be at 0.8813. Still, one shouldn’t exclude an opposite scenario, which implies that the instrument may return to the support level; the downside target is at 0.8690.

EURGBP

Article By RoboForex.com

Attention!
Forecasts presented in this section only reflect the author’s private opinion and should not be considered as guidance for trading. RoboForex LP bears no responsibility for trading results based on trading recommendations described in these analytical reviews.

The Analytical Overview of the Main Currency Pairs on 2020.05.07

by JustForex

The EUR/USD currency pair

Technical indicators of the currency pair:
  • Prev Open: 1.08408
  • Open: 1.07936
  • % chg. over the last day: -0.42
  • Day’s range: 1.07862 – 1.08164
  • 52 wk range: 1.0777 – 1.1494

The bearish sentiment prevails on the EUR/USD currency pair. The trading instrument has updated local lows again. The demand for risky assets is still low. According to the European Commission, the unemployment rate in the EU will increase from 6.7% to 9% this year. Eurozone GDP is likely to fall by a record 7.75%, and in 2021 will recover by 6.25%. Investors expect the next report on the initial jobless claims in the US. At the moment, EUR/USD quotes are consolidating in the range of 1.0780-1.0820. We recommend opening positions from these marks.

The Economic News Feed for 07.05.2020

  • – Initial jobless claims in the US at 15:30 (GMT+3:00).
EUR/USD

Indicators signal the power of sellers: the price has fixed below 50 MA and 100 MA.

The MACD histogram is in the negative zone, but above the signal line, which gives a weak signal to sell EUR/USD.

Stochastic Oscillator is in the neutral zone, the %K line is below the %D line, which indicates the bearish sentiment.

Trading recommendations
  • Support levels: 1.0780, 1.0760, 1.0730
  • Resistance levels: 1.0820, 1.0855, 1.0885

If the price fixes below 1.0780, a further fall in the EUR/USD currency pair is expected. The movement is tending to 1.0750-1.0730.

An alternative could be the growth of EUR/USD quotes to 1.0850-1.0870.

The GBP/USD currency pair

Technical indicators of the currency pair:
  • Prev Open: 1.24384
  • Open: 1.23364
  • % chg. over the last day: -0.75
  • Day’s range: 1.23102 – 1.24174
  • 52 wk range: 1.1466 – 1.3516

There are high trading activity and volatility on the GBP/USD currency pair. Financial market participants assess the Bank of England meeting. The regulator, as expected, kept the key marks of monetary policy at the same level. The Central Bank announced its readiness for new incentive measures to counter the impact of the COVID-19 epidemic. At the moment, the local support and resistance levels are 1.2345 and 1.2400, respectively. We recommend opening positions from these marks.

GBP/USD

Indicators do not give accurate signals: the price is testing 50 MA.

The MACD histogram is in the negative zone, but above the signal line, which gives a weak signal to sell GBP/USD.

Stochastic Oscillator is in the neutral zone, the %K line has crossed the %D line. There are no signals at the moment.

Trading recommendations
  • Support levels: 1.2345, 1.2310
  • Resistance levels: 1.2400, 1.2445, 1.2485

If the price fixes below the support level of 1.2345, GBP/USD quotes are expected to fall. The movement is tending to 1.2300-1.2280.

An alternative could be the growth of the GBP/USD currency pair to 1.2440-1.2470.

The USD/CAD currency pair

Technical indicators of the currency pair:
  • Prev Open: 1.40449
  • Open: 1.41433
  • % chg. over the last day: +0.70
  • Day’s range: 1.40823 – 1.41730
  • 52 wk range: 1.2949 – 1.4668

Last sessions trades on the USD/CAD currency pair have been very active. At the same time, there is no defined trend. At the moment, the technical pattern is ambiguous. The local support and resistance levels are 1.4075 and 1.4120, respectively. Investors expect additional drivers. We recommend paying attention to the dynamics of “black gold” prices. Positions should be opened from key levels.

At 17:00 (GMT+3:00), Ivey PMI will be published.

USD/CAD

Indicators do not give accurate signals: the price has crossed 50 MA.

The MACD histogram is near the 0 mark. There are no signals at the moment.

Stochastic Oscillator is near the oversold zone, the %K line has crossed the %D line. There are no signals at the moment.

Trading recommendations
  • Support levels: 1.4075, 1.4030
  • Resistance levels: 1.4120, 1.4170

If the price fixes below the support level of 1.4075, USD/CAD quotes are expected to fall. The movement is tending to 1.4040-1.4000.

An alternative could be the growth of the USD/CAD currency pair to 1.4150-1.4180.

The USD/JPY currency pair

Technical indicators of the currency pair:
  • Prev Open: 106.470
  • Open: 106.083
  • % chg. over the last day: -0.41
  • Day’s range: 105.990 – 106.522
  • 52 wk range: 101.19 – 112.41

The USD/JPY currency pair has become stable. Financial market participants expect additional drivers. At the moment, USD/JPY quotes are testing the supply zone of 106.50-106.65. The 106.20 mark is the nearest support. We recommend paying attention to economic releases, as well as to the dynamics of US government bonds yield. Positions should be opened from key levels.

USD/JPY

Indicators do not give accurate signals: the price has fixed between 50 MA and 100 MA.

The MACD histogram has started rising, indicating the development of bullish sentiment.

Stochastic Oscillator is near the overbought zone, the %K line is above the %D line, which gives a weak signal to buy USD/JPY.

Trading recommendations
  • Support levels: 106.20, 106.00
  • Resistance levels: 106.50, 106.65, 106.85

If the price fixes above 106.50, USD/JPY quotes are expected to rise. The movement is tending to 106.80-107.00.

An alternative could be a decrease in the USD/JPY currency pair to 106.00-105.80.

by JustForex

Investors Have Taken a Wait-and-See Attitude Before the Bank of England Meeting

by JustForex

The demand for the US currency is still high despite weak economic statistics. Thus, the number of people employed in the nonfarm sector decreased by 20.236K in April, while experts forecasted a decrease by 20.050K. Today, financial market participants expect the next report on the initial jobless claims in the United States. Also, investors are focused on relations between Washington and Beijing. US President Donald Trump said on Wednesday that he was closely monitoring how China fulfilled its obligations under the “phase one” trade agreement signed earlier. The US dollar index (#DX) closed in the positive zone (+0.37%) yesterday.

The European Commission presented the Spring Economic Forecast, according to which the pace of economic recovery in the Eurozone would be uneven. As the European Commission expects, the EU unemployment rate will rise from 6.7% to 9% this year. Eurozone GDP is likely to fall by a record 7.75%, and in 2021 will recover by 6.25%.

The British pound has fallen in expectation of the Bank of England meeting, which will be held today. Since the start of the COVID-19 pandemic, the regulator has adopted a wide range of measures to support the country’s economy, including lowering lending rates and expanding the quantitative easing program to £645 billion. Taking this into account, investors do not expect new incentives to be announced today. Still, they will closely monitor the macroeconomic forecasts and comments of the Bank of England regarding a likely further increase in the quantitative easing program.

The “black gold” prices continue to recover. Currently, futures for the WTI crude oil are testing the $23.85 mark per barrel.

Market indicators

Yesterday, there was a variety of trends in the US stock market: #SPY (-0.68%), #DIA (-0.81%), #QQQ (+0.62%).

The 10-year US government bonds yield has risen again. At the moment, the indicator is at the level of 0.70-0.71%.

The news feed on 2020.05.07:
  • – Bank of England inflation report at 09:00 (GMT+3:00);
  • – Bank of England interest rate decision at 09:00 (GMT+3:00);
  • – Initial jobless claims in the US at 15:30 (GMT+3:00);
  • – Ivey PMI at 17:00 (GMT+3:00).

by JustForex

Coronavirus shows why Canada must reduce its dependence on the U.S.

By Philippe Lagassé, Carleton University and Srdjan Vucetic, L’Université d’Ottawa/University of Ottawa

Canadian foreign policy has long embraced both a deep continental relationship with the United States and a devotion to liberal internationalism. In light of the COVID-19 pandemic, the time has come to re-evaluate our approach.

While Canada has been able to manage the coronavirus crisis so far, our ability to continue to keep the pandemic at bay and successfully rescue the economy will likely be even more difficult.

If the U.S. cannot get a handle on the virus, and if its leadership chooses a protectionist route to economic recovery, Canada’s return to normalcy will be that much harder. That’s especially true if the Canadian government is not able to secure exceptions from Washington’s protectionist measures, as it has recently.

Similarly, if international trade and movement are slow to re-establish themselves, and if protectionism becomes a worldwide response, Canada can expect a cumbersome recovery.

Canada and the United States share a border and other geographical ties. But the coronavirus has underscored the need to ease our dependence on the U.S. Niagara Falls, Ont., is seen from the American side of the falls.
(Pixabay)

Mostly benign

Canada’s dependence on the United States has been mostly benign. Yes, American decisions on softwood lumber and steel/aluminum tariffs, and limitations on other free trade agreements found in the USMCA hurt Canada, but Canada also greatly benefits from its commercial relationships with its neighbour.

But as COVID-19 radicalizes the already radical presidency of Donald Trump, Canada may be forced to confront its dependence on the U.S. more directly and with greater urgency.

Short-lived tensions — including Trump’s unsuccessful attempt to halt exports of masks to Canada and his musings about stationing troops near the border — may be harbingers of longer term restrictions, disagreements or spillover effects that slow or stifle Canada’s attempt to rebound from the current crisis.

Worse, the rise of nationalism and geopolitical competition points to the likelihood of a fragmented international order built around a handful of large protectionist or self-sufficient power blocs. Liberal principles of free trade and movement may come under increasing pressure, leaving Canada particularly vulnerable to the whims of protectionist powers.

The ‘Third Option,’ COVID-19 edition

So, what, if anything, can be done? In 1972, following the shock to the world economy brought about by former U.S. president Richard Nixon’s decision to effectively end the Bretton Woods system of fixed exchange rates, Pierre Trudeau’s government introduced a policy idea called the “Third Option.” It was essentially a call for more self-sufficiency at home and stronger ties with the rest of the world to lessen dependence on the United States.

Though the Third Option dissipated after a few years, the idea behind it never quite died off. COVID-19 renders Third Option thinking not only respectable but also responsible again.

Witness, for example, increasing appeals for a more self-sufficient Canada, and Foreign Minister François-Philippe Champagne’s efforts to co-ordinate Canada’s pandemic response with both “traditional” and “new” international partners.

Whether general or issue-specific, multilateral or “plurilateral,” ties with partners in Africa, Asia, the Americas and Europe are in Canada’s best interest, simply because they constitute a counterweight to the United States. True, some of these ties will always be shallow, others short-lived, and still others both. Yet, some ties might well lead to the establishment of deeper and closer strategic relationship with the rest of the world.

More diverse trading relationships will be essential to ensure Canadian resilience. In light of the recently concluded Comprehensive Economic and Trade Agreement, the European Union, for all its shortcomings and uncertainties, is one good candidate for such a relationship.

No heavy reliance on allies

The principal challenge of the COVID-19-era Third Option, though, is not finding new partners. Rather, it’s Canada’s ability to do things on its own without relying on too heavily allies and partners.

Canada needs to break free of its dependence on the United States if it’s to soar.
(Dennis Larsen/Pixabay)

We may see Canada invest in national manufacturing of medical goods as a result, akin to the munitions supply program that ensures the Canadian military has the ammunition it needs.

But the pandemic has also highlighted that Canada’s COVID-19 response has arguably been too reliant on international assessments. Canada will need to strengthen its own ability to assess and craft effective responses to global crises, not only in the area of public health, but finance, security and defence, climate change and migration, among others.

While global problems require global solutions, the pandemic has highlighted that national responses remain vital and should not be overly dependent on allies and international bodies.

Building the capacity to pursue the Third Option will take time, money and, most importantly, a political culture willing to reconsider the fundamentals of Canadian foreign policy. To get there, Canadians must be willing to think harder about Canada-U.S. relations and an increasingly fractured international order.The Conversation

About the Author:

Philippe Lagassé, Associate professor and Barton Chair, Norman Paterson School of International Affairs, Carleton University and Srdjan Vucetic, Assoc. Professor, Graduate School of Public and International Affairs, L’Université d’Ottawa/University of Ottawa

This article is republished from The Conversation under a Creative Commons license. Read the original article.
 

Why April was Wall Street’s best month in decades – despite dismal Mainstreet news

By Kim Kaivanto, Lancaster University

At times the contrast between the real economy and the stock market is striking. For US stocks, April was their best month since 1987, while at the same time real economic indicators – such as employment, manufacturing, services, trade, commodities and GDP – tanked. It seems that in April, the stock market caught the tail end of spring break spirit.

Some suggest this shows investor sentiment is free of any anchor in the real economy. Either this or rampant speculative flows “buying the bottom” have become a self-fulfilling force. I argue that market sentiment in April was informed by twin-howitzer policy deployments of overriding force and clarity, but which are ultimately of finite holding power.

During economic contractions, stock prices generally react negatively to unanticipated increases in unemployment. Research shows that a rise in unemployment portends reduced earnings and dividend growth for companies. This relationship is especially strong during economic contractions. So when unemployment increases unexpectedly, stock prices fall – usually.

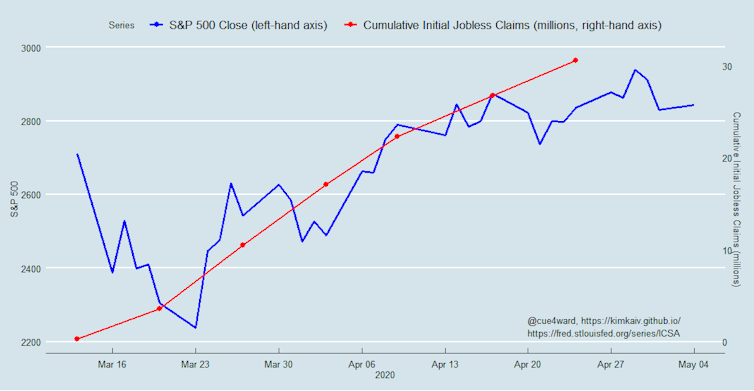
Yet the big step-change increase in initial jobless claims in the week ending March 21 coincided with an extraordinary sequence of dramatic response measures by the US central bank, the Federal Reserve. The stock market’s bounce began on the following Monday and continued throughout April, despite mounting unemployment-insurance claims, which have now crossed the 30 million mark.

One particularly cynical reason for this is that furloughed and laid-off employees relieve businesses of costs. Of course, the wider economy is deprived of their spending as well. But from the third week of March, the trajectories for unemployment and spending were firmly set and known to market participants.

From that time onward, the subsequent rise of unemployment and the associated fall in spending were no longer “unanticipated”. The cascade of furloughs and lay-offs were predictable and so this information was built into both sentiment and stock prices at the time. Hence, the weeks of increasingly dire real-economy figures didn’t move the market in a big way.

Jobless claims tracked with the S&P 500 stock index.
Kim Kaivanto, Author provided

Government intervention

But the more important factor for this month-long rise of the US stock market in the face of consistently dismal real-economy news was the unprecedentedly large, double-barrelled federal response – of financial-sector liquidity programmes and real-sector stimulus programmes – which was also emulated by governments around the world.

The US Federal Reserve’s extraordinary policy measures – and subsequently the nearly US$3 trillion authorised by the US Congress in the form of the CARES Act – provides firms and markets with emergency liquidity support to stave off an avalanche of defaults. Despite curtailed consumer and business spending, these government programmes offer businesses a means of avoiding immediate defaults – hopefully until the lockdown policies can be lifted. Think of this as an emergency transfusion and cauterisation of the wound.

The economic historian Niall Ferguson has suggested that the sheer scale of this state intervention is distorting the signals we are getting from the financial markets. But the breadth and scale of the intervention has an effect of its own, which is just as important as the support itself. It sends a credible signal that under the Trump administration, business will get all the support it needs to weather this pandemic. The US president sees buoyant markets as the key to his re-election, and he is dedicated to using all means at his disposal to that end.

Long-term debt issues

Buried in the weeds of this global crisis, seeds of destruction are sprouting. Much of the CARES Act emergency support for business consists of lending programmes. Of this, the US treasury received US$500 billion to support hard-hit big businesses like airlines, as well as states and cities – with loans, loan guarantees, and other investments.

But already in the autumn of 2019, the debt burden of US corporates approached a whopping US$10 trillion. As a ratio of GDP, the debt of nonfinancial firms in the US is at an all-time high. Some calculations place the proportion of “zombie firms” – companies whose earnings are so low that they must issue new debt just to cover the interest-payment obligations on their existing debt – at 16% among US public companies. Not only is lockdown pushing this figure higher, but so are the very loan programmes which were created to serve as emergency lifelines.

For large firms, refinancing continues to be viable, albeit with shortened maturities. Stress-test analysis of S&P 500 firms reveals a shift: fewer strong firms and more weak and vulnerable ones. So even with further top-ups to CARES Act programmes, the eventual recovery is likely to be subdued, at least until an effective COVID-19 vaccine becomes widely available.The Conversation

About the Author:

Kim Kaivanto, Senior Lecturer in Economics, Lancaster University

This article is republished from The Conversation under a Creative Commons license. Read the original article.
 

Technical Analysis Points To Key Reversal Of Global Markets

By TheTechnicalTraders

Recently, we received a number of email messages and comments regarding our recent Bitcoin article and how we attempted to explain the market trend/technical analysis.  It appears we were not making our interpretation very clear for our friends and followers.  This article should help to clear up our interpretation of the major market trends and our advanced technical analysis tools and utilities.

As purely technical traders, there are certain things we want to make clear.  First, we do pay attention to what is happening to the fundamentals and global economic data when it posts.  We’ve authored many previous articles stating our belief that “capital is like a living/breathing entity which attempts to survive (generate ROI with little risk) in various global market environments”.  In order for us, as technical traders, to identify real opportunities for superior trades, we must be aware of what is happening in the “environment” that surrounds us.

A perfect example is a recent collapse in oil.  We continue to read articles of how thousands of traders believed super-low oil prices were a GIFT and these traders piled into long trades expecting oil to rebound higher.  This happens when technical traders fail to understand the environment in which the instrument is trading within.  At this time, the supply side for oil vastly outweighs the demand-side – so the environment is skewed towards much weaker price activity.  The chance that any moderate price recovery would take place is minimal until the supply glut is diminished.

One of the easiest ways to think of a truly technical trader is that we don’t care if the price goes up or down, we just care that our technical triggers and indicators present clear opportunities that are superior to more traditional methods of trading.

To accomplish this, we believe we must understand the environment in which we are trading and the technical conditions that are present within the charts.  Technically, the price may be going up within a defined bearish/downtrend. This does not mean the upside price move is a technically valid “trade trigger”.  The opposite may be true for a move down in a bullish trending market.  Without proper confirmation of the overall technical bias, environment, and shorter-term technical triggers – one might as well throw a dart at a wall and hope for the best.

In our view, we issue many published research reports for our friends and followers to read and review every week.  Our interpretation of the technical triggers, economic data, forward expectations, and other setups are designed to help you learn how we conduct our research and to help you find opportunities in the markets.  Our members receive this same research and more – they receive our hand-selected trade triggers.  These are the best technical setups/trade triggers known as BAN Trades (Best Asset Now) so we can find that provide superior opportunities for skilled traders.

Before you continue, be sure to opt-in to our free market trend signals
before closing this page, so you don’t miss our next special report & signal!

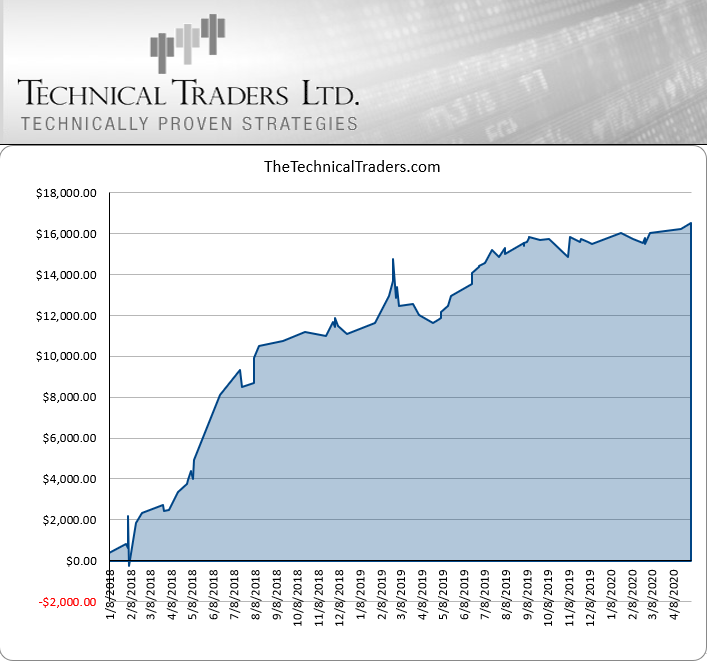
This chart, below, shows our historical results for the past 2.5 years.  You’ll notice that we do sometimes take losses – yes.  You’ll also notice the consistency of the profits – yes.  We hope you’ll also notice that we work very hard to make sure our member’s success is the first priority in everything we do.

Now, back to technical analysis…

Our research team believes the markets have set up a massive downside price advance (creating a much deeper low that confirms Fibonacci price theory and aligns with our Fibonacci Price Amplitude Arcs), which sets up a very unique technical pattern.  Until the price is capable of establishing a series of new higher-high points through consecutive upside price advances AND until the Weekly and Monthly charts confirm a new high price breakout – technically speaking, we’re still in a bearish price trend.

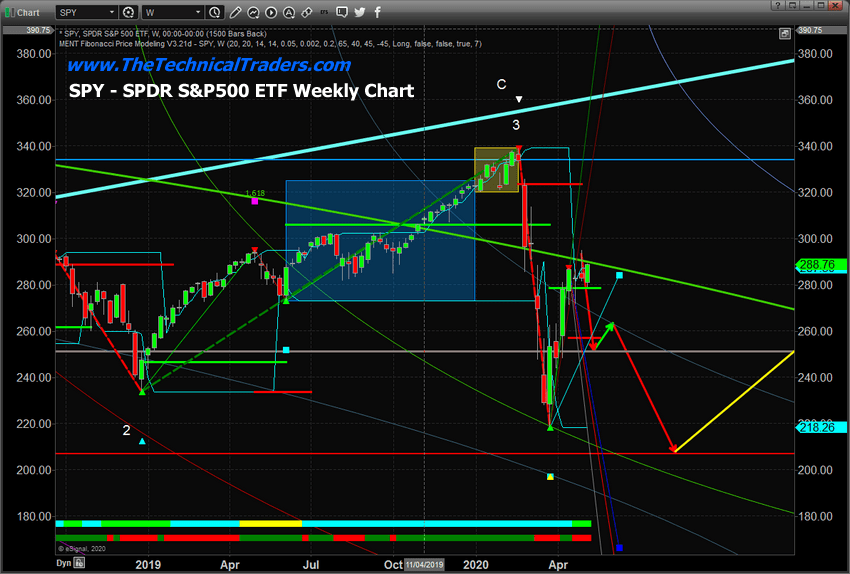
Weekly S&P 500 (SPY) Chart

This Weekly SPY chart, below, shows you three key technical factors that tell us there is a greater risk of a breakdown in price than any upside price trend continuation…

A.  The recent low/bottom price level broke below the December 2018 low price level (new lower low).

B.  The GREEN ARC price level is a massive 1.618 Fibonacci Price Amplitude Arc that suggests massive resistance exists at this level.  Price moving above this level then falling back below it suggests a “scouting pattern” type of event took place and FAILED.

C.  Recent price activity has rallied from recent lows too, again, reconfirm the GREEN ARC resistance level.  We believe this Fibonacci Price Amplitude Arc will present a major price ceiling as Q2 and Q3 economic data pushes forward – driving the price lower over time and eventually targeting the RED support level near $208 in July or August.

You may remember that we’ve been suggesting a bottom will not complete until sometime after July or August 2020 in previous research posts.  Now you know where we derive these projections and expectations, we use technical analysis and our advanced predictive modeling tools to “see into the future”.  Believe it or not, we’ve already mapped out SPY price activity 10+ years into the future.

Weekly Transportation Index (TRAN) Chart

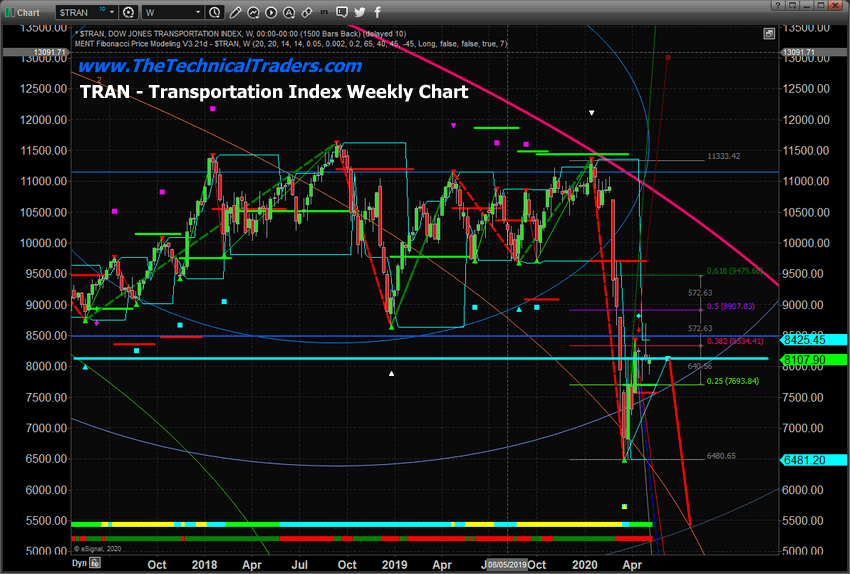
This TRAN Weekly chart also helps to confirm our technical analysis research.  We are deploying the same types of technical analysis tools on all of these charts to show you how our research team attempts to identify trends and opportunities.  You can see the heavy LIGHT RED Fibonacci Price Amplitude Arc near the peak in February 2020.  This Arc represents a massive price resistance channel.  You may also notice the thinner ORANGE Fibonacci Price Amplitude Arc that touches recent lows?  This arc acts as Support in its current form.

Our proprietary Adaptive Fibonacci Price Modeling System is drawing a CYAN projected target level from recent lows where the heavy CYAN line is displayed on this chart.  Additionally, a previous BLUE target level is also displayed on this chart which originated from the recent PEAK in February 2020.  Now, pay attention to where the TRAN price has found recent resistance and stalled…  RIGHT AT THOSE LEVELS.

We believe the failure of the SPY and TRAN to move above the ARCs and Fibonacci price targets suggests a critical upward price trend failure.  A failure of this nature will prompt a new downside price move in the near future as price must always attempt to establish new price highs or new price lows based on the Fibonacci Price Theory (technical analysis).

Monthly Dow Jones Industrial (INDU)

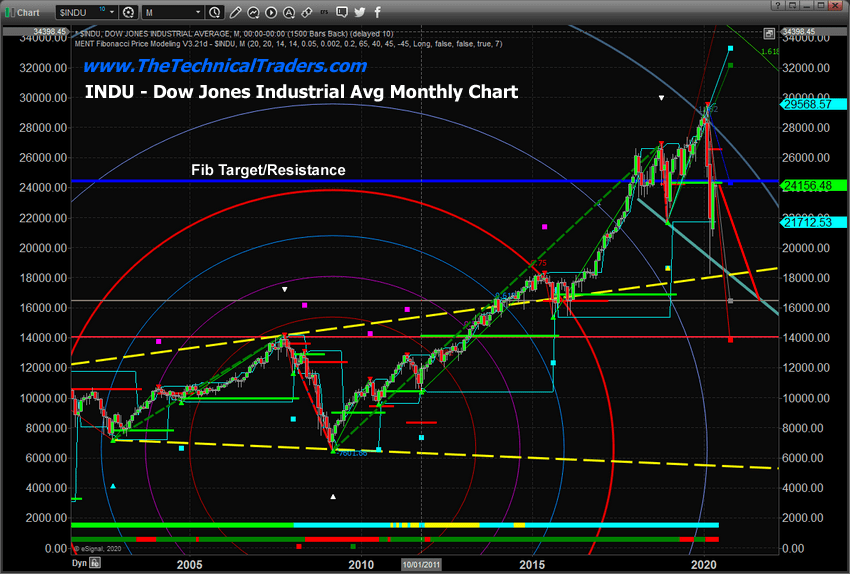
This last chart, the Monthly INDU, is probably the most impressive one so far.  Clear Fibonacci Price Amplitude Arcs suggest massive resistance near the February 2020 peak levels.  A very clear downward price channel originating from the February 2018 lows and transitioning across the December 2018 lows and into current lows.  An Adaptive Fibonacci Price Modeling System target price (CYAN) near 8108 (very near current price levels) and a very clear technical price pattern (Dojis) suggesting a potential top or price reversal is setting up.  Lastly, the recent deep low price stalled very near to the historical YELLOW DASHED price channel that spans the 2000 and 2007 price peaks.

Pulling all of this technical analysis together with simple Fibonacci Price Theory suggests that until the markets can prove to us that price is capable of establishing we upside price structures, the recent deep new price low (near 18,265) suggests future price action may collapse even further and attempt to establish a new, deeper, “new price low” before the real bottoms set up in the markets.  On this INDU chart, it suggests that a “deeper price low” may result in a move well below the YELLOW DASHED price channel from 2000/07 and attempt to move to the RED Fibonacci Price Target level near 14,000.

Concluding Thoughts:

Obviously, we are still very bearish in terms of the current overall market trend.  No technical analysis technique has shown us that the intermediate and longer-term trends have changed direction to Bullish.  Yes, our Daily systems did identify a bullish trigger within this bearish trend on the SPY which we executed successfully for our members.  There is an opportunity to take a bullish trade within a bearish price trend when technical analysis confirms the trigger and it is executed properly.

If you are using our free public research for your own trading decision-making and/or using it as an opportunity to find and execute successful trades, please remember you are the one ultimately making the decisions to trade based on our interpretation and free research posts.  We, as technical traders, will continue to post new research articles and content that we believe is relevant to the current market setups.

If you want to improve your accuracy and opportunities for success, then we urge you to visit TheTechnicalTraders.com to learn how you can enjoy our research and our members-only trading triggers (see the first chart in this article).  If you are managing your retirement account or 401k, then we urge you to visit www.TheTechnicalInvestor.com to learn how to protect your assets and grow your wealth using our proprietary longer-term modeling systems.  Our goal is to help you find and create success – not to confuse you.

Our researchers will generate free research on just about any topic that interests them.  As technical traders, we follow price, predict future price moves, tops, bottoms, and trends, and attempt to highlight incredible setups that exist on the charts.  What you do with it is up to you.  Visit www.TheTechnicalTraders.com/FreeResearch/ to review all of our detailed free research posts.

In closing, we would like to suggest that the next 5+ years are going to be incredible opportunities for skilled traders.  Remember, we’ve already mapped out price trends 10+ years into the future that we expect based on our advanced predictive modeling tools.  If our analysis is correct, skilled traders will be able to make a small fortune trading these trends and Metals will skyrocket.  The only way you’ll know which trades to take or not is to become a member.

Chris Vermeulen
Chief Market Strategist
TheTechnicalTraders.com


Report on COVID-19 Human Costs and Economic Damage

By Dan Steinbock      

The belated COVID-19 mobilization has resulted in historical human costs and a major economic damage. If right policies are further ignored, a multi-year global contraction could follow.

My report on the pandemic has been released [here’s the link]. “The Tragedy of Missed Opportunities” focuses on “the COVID-19 human costs and economic damage.” It identifies the missed opportunities in the virus battle. And it outlines the consequent costs in terms of cases, lost lives, and economic damage.

Despite several opportunities to initiate early mobilization outside China and proximate Asia, most major economies did not opt for preemptive action.

In the US, the Trump administration has engaged in a self-defeating effort to “protect the economy” (read: the markets). The White House continues to suppress an adequate science-based policy response resting on medical evidence.

The European Union (EU) was more willing but unable to fight the virus earlier. But it is not fully integrated and lacks the common institutions for effective response.

The 1st Missed Opportunity (Jan 2020)  

Between the first recorded case (Dec 30, 2019), and the WHO’s announcement of the international emergency (Jan 30, 2020), the epicenter of the outbreak was centered in Wuhan, Hubei, and nearby Chinese provinces.

That’s when China, Hong Kong and later South Korea mobilized against the virus.

The virus did not stay in Asia, however. First cases were also recorded in some 20 countries worldwide, including the United States and EU economies.

Moreover, the virus information that China and other early mobilizers used to attack the virus has also been available to the White House since January 3, while the European CDC began its risk assessments only days later. Yet, neither chose to mobilize.

That’s how they missed the first major opportunity for proactive mobilization.

The 2nd Missed Opportunity (1Q 2020)

The second critical opportunity to contain the virus outbreak could be dated from the WHO’s international emergency (Jan 30) to its global pandemic announcement (Mar 10). That’s when the epicenter moved to Europe and then to the US. Yet, full mobilization in both began only 1-2 weeks after the pandemic warning – 6-8 weeks later than proactive mobilization in China and Hong Kong.

Most countries failed to provide WHO full case reports until February, which penalized international cooperation at a critical moment. Worse, inadequate preparedness contributed to new challenges, including faulty test kits and long delays in testing, and huge shortages of personal protective equipment (PPE) that endangered the lives of frontline healthcare professionals.

US trade wars caused additional shortages. The Trump White House allowed US companies to export PPE, but did not permit Chinese companies to import PPE to the US. Meanwhile, failed responses to the outbreak added to health risks. Media coverage was high on hype, but short on facts causing a virtual ‘infodemic.’

Oddly, many international observers, including even reputable dailies in the West, began an odd battle against the WHO and its leadership, who have urged countries to mobilize fast against the virus since January.

That’s how the second major opportunity for mobilization was missed. In cumulative terms, it covers the entire 1st quarter of the year.

The 3rd Missed Opportunity (1Q-2Q 2020)

As escalation continued in Europe, the epicenter moved from the West Coast to the US. Meanwhile quarantines and lockdowns diffused worldwide. It was only in April that the social distancing measures, which China initiated in January, were widely introduced in the West.

Since late mobilization and weaker enforcement proved less effective, the result was effective herd immunity. Instead of flattening the epidemic curve, many countries initially fattened that curve for weeks. So, the outbreak will diffuse and linger worldwide longer than currently acknowledged, while secondary virus waves and residual virus clusters are more likely over the year.

Premature lockdown exits are likely to magnify human and economic costs.

As these costs have soared, some government leaders seek to evade responsibility via a “paranoid style of politics.” That’s why the Trump White House has targeted China as a politically expedient scapegoat. It’s a futile effort to misplace the blame.

That’s how the third major opportunity to battle the virus failed. In cumulative terms, it comprises the first half of the year.

The 4th Missed Opportunity (1Q-2Q 2020 and beyond)

In this period, the epicenter will move from advanced economies to emerging and developing countries with weaker healthcare systems.

Many of these countries have been willing to fight the outbreak, but they lack adequate resources domestically and external support. The net effect could prove catastrophic.

Recently, the UN food relief agency (WFP) chief David Beasley warned UN Security Council about an impending “global humanitarian catastrophe,” especially in Africa.

As the global pandemic threatens to push 265 million people into abject poverty in the world’s poorest areas, the adverse feedback effects could be felt worldwide.

That’s how the fourth major opportunity against COVID-19 would be missed.

Massive human costs   

In January, there were almost 7,740 cumulative confirmed cases in China, but barely 14 in Europe and 5 in the US.

Having peaked in February, the cases in China were 82,000 at the end of the 1st quarter. Yet, those in Europe and US exceeded 425,000 and 140,000, respectively.

Assuming the global pandemic’s current growth pace, the worldwide cases could exceed 7-8 million by the end of the 2nd quarter. In Europe and the US, that could translate to almost 3 million each.

Without appropriate vaccination and therapies, the human costs will continue to climb until the epidemic curves normalize over time around spring 2021 or 2022.

Historical economic damage   

Even in the current baseline case (IMF, Apr 2020), the cumulative loss to global GDP over 2020 and 2021 could amount to about $9 trillion. That’s more than the world’s third and fourth largest economies – Japan and Germany – combined.

Yet, that baseline is not adequately realistic because it ignores the dire economic landscape – 2008/9 global crisis, 2010, European debt crisis, failed global recovery 2017/18 due to US tariff wars and the consequent accumulation of global debt of 230% of world GDP – that preceded the pandemic.

So, let’s assume two more realistic trajectories, the Great Power Conflicts scenario and the Great Power Cooperation scenario. Let’s also assume, as many analysts and epidemiologists currently do, that there might be a longer outbreak in 2020, a new outbreak in 2021, or both.

The Great Power Conflicts scenario presumes progressive deterioration of pandemic and economic costs. In this alternative, lingering pandemic risks would generate intense trade and technology wars, “hot” geopolitical conflicts and a long, multi-year global depression. This is the current path of the Trump White House.

Unlike US Great Depression in the 1930s, it would result in gloomier outlook since the output potential of the US and major Western economies was in secular stagnation even before the global pandemic.

In the Great Power Cooperation scenario, pandemic and economic costs would be significantly reduced. In this alternative, lingering pandemic risks would prove longer than expected, but trade deals in trade and technology and subdued geopolitical friction would result in eventual economic recovery. This appears to be the preferred path of China, the EU and the US opposition of the Trump White House.

Here’s the inconvenient truth: if the late mobilizers and failed mobilizers had followed the proactive measures of the early mobilizers, millions of people could have avoided the virus and hundreds of thousands would remain alive.

There was nothing inevitable about this global pandemic but the costs of complacency will prove high, very high.

About the Author:

Dr. Dan Steinbock is an internationally recognized strategist of the multipolar world and the founder of Difference Group. He has served at the India, China and America Institute (USA), Shanghai Institutes for International Studies (China) and the EU Center (Singapore). For more, see https://www.differencegroup.net

This commentary is based on Dr Steinbock’s briefing on Saturday, May 2, 2020.