Author Archive for InvestMacro – Page 43

Small-Cap Stocks (Russell 2k) Are Headed For A Double Dip?

By TheTechnicalTraders 

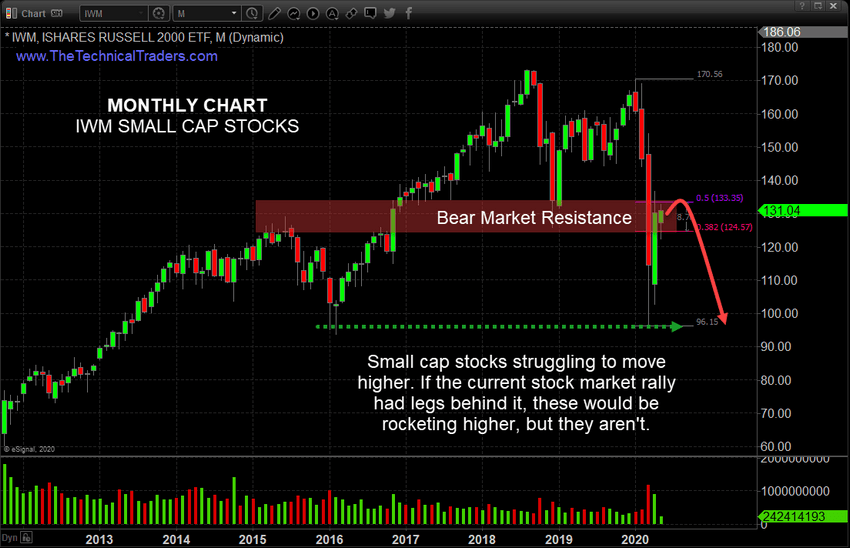
– Our research team believes the Russell 2000 is leading the way in terms of technical analysis and future expectations.  While the NASDAQ has rallied as a result of US Fed stimulus and foreign investor activity, the Russell 2000 has set up a very clear price resistance level near $131~132 that presents very real potential for a double-dip downward price trend in the near future.

Monthly IWM ETF Chart

The resistance level near $131~132 suggests the IWM may rotate downward, creating a right-shoulder, and likely attempt to move down to the $96 previous lows.  If this resistance area can’t be breached by further upside price activity, then the price will likely attempt to rotate lower and rests multiple levels as price collapses back below $100 again.  The lack of upward price activity in the Russell 2000, and other market sectors, suggests the rally is isolated to the NASDAQ and certain other symbols – not broad-based.

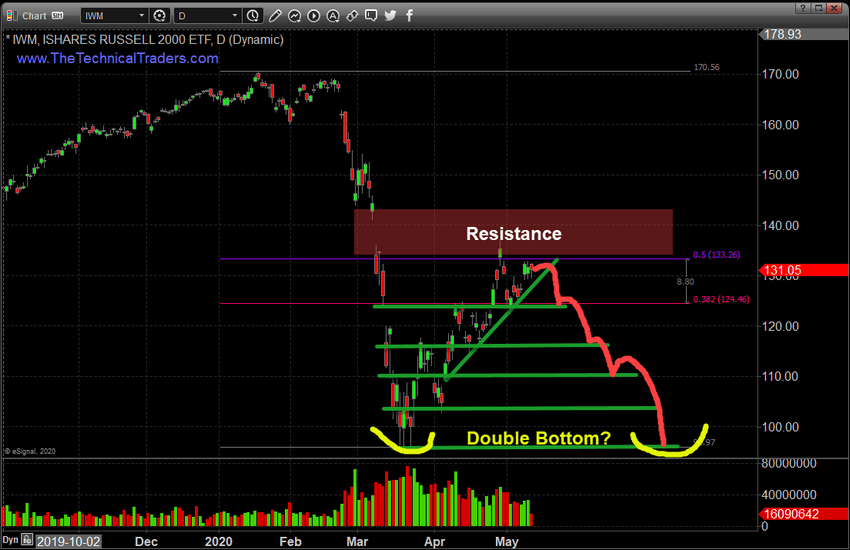
Daily IWM ETF Chart

This Daily IWM chart highlights the multiple levels of support below the current price levels.  Each of these may act as some form of a soft floor in price as price attempts to move lower.  Again, the lack of price to attempt to rally above the RED Resistance level on this chart suggests the Russell 2000 may have found a top and may begin to “rollover” as momentum diminishes.

If stocks are set to fall something else should start to rally. Check out my trade idea on silver!

Before you continue, be sure to opt-in to our free-market trend signals
before leaving this page, so you don’t miss our next special report & signal!

Concluding Thoughts

Technical Traders watch for these types of patterns because they provide an A or B type of scenario for profits.  Either, A, upper Resistance will be broken and the IWM will really past $140 and attempt a further upside price rally..  or, B, this resistance level will hold price below $140 and present a very real downside price opportunity where price may attempt to fall well below $110.

Our concern is that the initial downside price move in the markets, as a result of the COVID-19 virus event and global shutdown event, was followed by a Fed-induced “relief rally” that may be ending.  Most of the time, these big impulse moves result in a “relief recovery” before further trending takes place.  We believe the relief recovery is nearly over and the global markets may be setting up for a much bigger trending move.

If you are using our free public research for your own trading decision-making and/or using it as an opportunity to find and execute successful trades, please remember you are the one ultimately making the decisions to trade based on our interpretation and free research posts.  We, as technical traders, will continue to post new research articles and content that we believe is relevant to the current market setups.

If you want to improve your accuracy and opportunities for success, then we urge you to visit TheTechnicalTraders.com to learn how you can enjoy our research and our members-only trading triggers (see the first chart in this article).  If you are managing your retirement account or 401k, then we urge you to visit www.TheTechnicalInvestor.com to learn how to protect your assets and grow your wealth using our proprietary longer-term modeling systems.  Our goal is to help you find and create success – not to confuse you.

Our researchers will generate free research on just about any topic that interests them.  As technical traders, we follow price, predict future price moves, tops, bottoms, and trends, and attempt to highlight incredible setups that exist on the charts.  What you do with it is up to you.  Visit www.TheTechnicalTraders.com/FreeResearch/ to review all of our detailed free research posts.

In closing, we would like to suggest that the next 5+ years are going to be incredible opportunities for skilled traders.  Remember, we’ve already mapped out price trends 10+ years into the future that we expect based on our advanced predictive modeling tools.  If our analysis is correct, skilled traders will be able to make a small fortune trading these trends and Metals will skyrocket.  The only way you’ll know which trades to take or not is to become a member.

Chris Vermeulen
Chief Market Strategist
TheTechnicalTraders.com
 

Do Day Traders Need Accounting Software?

If you are new to the world of day trading, the one thing you’ve probably noticed is that everything seems to happen at the speed of light! With so much to keep in mind, and so much going on at the same time, you may be at a loss as to how to keep track of what you have already traded and how to improve your trading style. Someone may have suggested that the best course of action may be to use accounting software. Not only will this help you track your trades, but it will also come in handy in several other areas as well. So, do day traders need accounting software? The best answer is probably yes. Here is why.

Staying Ahead of the Taxman!

Many people have asked whether or not day trading is legal and that, too, is easy to answer. Yes, day trading is most definitely legal, however, staying ahead of the taxman might not be as easy! Bear in mind that all your trades happen so rapidly that to omit one gain or one loss can upset your taxes immensely. If you want to keep track of literally every trade to keep your gains/losses up to date, you would certainly benefit from the best accounting software on the market used by savvy day traders. You can do a comparison of various software platforms suitable for day traders on the piesync.com website. Here they compare two extremely popular programs – FreshBooks and QuickBooks – so that you can see which is easier for you to use and has the necessary features to keep your trades current. You will certainly want one that allows for seamless integration with your day trading software!

More Time to Trade

Also, you may want to consider using accounting software because the right platform will give you more time to focus on learning to trade. Some accounting software packages are so difficult to use that you will spend more time figuring out the program than you spend trading. With day trading, this can be your worst nightmare. Remember, you need to track all your trades, especially for the IRS, but to spend a long period of time recording them would be counterproductive. With the right software, you will have more time to spend analyzing the market because it will be able to pull outcomes as they occur. So, here again, yes, you need accounting software. However, you need the right accounting software for day traders.

When Less Is More

What all this boils down to is that the less time you can spend on bookkeeping, the more time you will have to focus on your trading style. New day traders find that they are better able to focus on trading when they do not also need to work on keeping records. Remember, in terms of time for day traders, less is always going to be more – and so much more! From having accurate figures come tax time to allowing you to focus more on trading, accounting software can be the missing link you have been searching for. Do you need accounting software? You absolutely do.

By Taylor Wilman


The Tragedy of Missed of COVID-19 Opportunities

By Dan Steinbock

– As China’s economy is rebounding, the belated COVID-19 mobilization in the United States and Europe has resulted in huge human and economic damage. New policy plunders could make the situation much worse globally.

My new report, “The Tragedy of Missed Opportunities,” focuses on the huge COVID-19 human costs and economic damage. Released by a global think-tank, Shanghai Institutes for International Studies (SIIS), it identifies the missed opportunities in the virus battle and its consequent human and economic costs ” [link and here].

In the United States, the Trump administration’s futile effort to “protect the economy” (read: the markets) has had disastrous repercussions. Yet, the White House continues to suppress science-based medical policies.

The European Union was more willing to battle the virus but was unable to do so proactively because it lacks the needed common institutions for effective response.

Despite several major opportunities to initiate early mobilization, the major advanced economies did not opt for preemptive action.

Missed opportunities

Between the first recorded case (Dec 30, 2019), and the WHO’s announcement of the international emergency (Jan 30, 2020), the epicenter of the outbreak was centered in Wuhan, Hubei, and nearby Chinese provinces. The first cases were also recorded in some 20 other countries, including the US and major EU states.

That’s when China, Hong Kong, Singapore and later South Korea mobilized against the outbreak. The White House and the EU had the same virus information as these early mobilizers in the first week of January, yet both chose not to mobilize. That’s how they missed the first opportunity for proactive mobilization.

The second opportunity to contain the virus was between the WHO’s international emergency (Jan 30) and global pandemic alert (Mar 10), when the epicenter moved to Europe and then to the US. Yet full mobilization in both began only 1-2 weeks after the pandemic warning – 6-8 weeks later than in China and Hong Kong.

During this period, inadequate preparedness was reflected by faulty test kits and long testing delays; shortages of protective equipment (PPE), which US trade wars made worse, endangering frontline healthcare professionals; failed responses adding to health risks (rejection of medical policies, failed quarantines); misguided media coverage causing an “infodemic” and an odd battle against the WHO.

That’s how the second major opportunity for mobilization in February and much of March was missed. In cumulative terms, it covers the entire 1st quarter of the year.

As escalation continued in Europe, the epicenter moved to the US, while quarantines and lockdowns diffused worldwide. While China started social distancing measures in January, they were widely introduced in the West only in April. As a result, the outbreak will linger far longer worldwide, while new virus waves and residual clusters are more likely and premature lockdown exits will add to human and economic costs.

That’s how the third major opportunity to battle the virus failed in February-March. In cumulative terms, it comprises the first half of the year.

Next, the epicenter will move to developing countries with weaker healthcare systems. Without external support, that could push 265 million people into poverty, as the UN food relief agency has already warned.

That’s how the fourth major opportunity against COVID-19 would be missed.

Massive human costs, historical economic damage   

In January, there were over 7,700 cumulative confirmed cases in China, but only a dozen in Europe and half a dozen in the US. Since China mobilized against the outbreak then, cumulative cases are likely to stay below 90,000 at the end of June.

In contrast, Europe and the US could each have some 3 million cumulative cases and hundreds of thousands of deaths. Belated mobilizations have horrible costs.

Struggling to deflect responsibility for its disastrous COVID-19 plunders, the Trump White House is fabricating pretexts to target China as a politically expedient scapegoat, while trying to recruit EU NATO allies to a still another Cold War.

Without vaccination and therapies, the human costs will continue to climb until the epidemic curves normalize, earliest by 2021. The economic carnage will start with the 2nd quarter coronavirus contraction casting a dark shadow over the early 2020s.

Even in the current baseline case (IMF, Apr 2020), the cumulative loss to global GDP over 2020 and 2021 could amount to $9 trillion. That’s more than the world’s third and fourth largest economies Japan and Germany combined – or three times more than the 2003 Iraq War, still another misplaced tragedy.

New trade wars could cause global depression

But there could be much worse ahead. The current IMF baseline still downplays the dire economic landscape – from the 2008/9 global crisis to US tariff wars – that preceded COVID-19. Also, the epidemiologists assume there might be a longer outbreak in 2020, a new outbreak in 2021, or both.

Since the Trump White House wants to reignite the trade war, it could cause what I call the Great Power Conflicts scenario. In this case, the coronavirus contraction and lingering pandemic risks would result in new trade wars and geopolitical conflicts causing a multi-year global depression. This is the current path of the White House.

What is needed to avoid such a calamity is the Great Power Cooperation scenario, which would have to cope with lingering pandemic risks would, but deals in trade and technology and diplomacy-driven geopolitics could foster global economic recovery. This appears to be the preferred path of China, most of the EU and US opposition against the Trump White House.

After the tragedy of missed opportunities, only international, multilateral cooperation can offer a way out.

About the Author:

Dr. Dan Steinbock is an internationally recognized strategist of the multipolar world and the founder of Difference Group. He has served at the India, China and America Institute (USA), Shanghai Institutes for International Studies (China) and the EU Center (Singapore). For more, see https://www.differencegroup.net

A version of the commentary was released by China Daily on May 12, 2020.


Negative interest rates are coming, investors taking action: deVere CEO

By George Prior

Negative interest rates are coming and investors will now be looking to bolster their portfolios to ‘get ahead of the curve and build wealth’, says the CEO and founder of one of the world’s largest independent financial advisory organizations.

deVere Group’s Nigel Green is speaking out after rate options, which gauge monetary policy forecasts, implied on Monday a 23% likelihood that the key federal funds rate will drop below zero by the end of 2020, according to BofA Securities data.

It’s not just the U.S., the world’s largest economy, which is moving towards this scenario.

On Tuesday, the Deputy Governor of the Bank of England also suggested that the UK may be headed toward negative interest rates.

Mr Green comments: “A new global era of negative interest rates would have been unimaginable even a few months ago.  But this has now changed due to the coronavirus.

“As central banks around the world grapple to control the economic impact, it can be reasonably expected that more and more of them will take a dramatic change of policy course and take rates to below zero – like their peers in Europe and Japan.”

He continues: “There is legitimate debate about the efficacy of negative interest rates on boosting economies.

“They could turn out to be a masterclass in the law of unintended consequences as they could be viewed by consumers and investors that the underlying economies are in a perilous position and, as a result, prompt a drop in consumer and investor demand.”

Whilst the debate on whether negative interest rates help the ‘real economy’ or not will continue, there is no doubt that they help boost financial asset prices.

“With this firmly in their minds, market-wise investors will know be looking to bolster their portfolios before the next round of cuts and the likely subsequent price increase. They are taking advantage of the lower entry points now before the next major rally,” notes Nigel Green.

He goes on to add: “In addition, those with savings in the bank are already getting no return thanks to the ultra-low interest rates.  Negative rates will offer them more reason to increase their exposure to equities, for example.”

The deVere CEO concludes: “I believe, due to the economic situation and the hints from central banks, that there are more rate cuts on their way as they know it’s not sustainable to just keep printing money.

“This ‘direction of travel’ will push up financial asset prices and, as such, many investors are now looking to get ahead of the curve and build wealth.”

About:

deVere Group is one of the world’s largest independent advisors of specialist global financial solutions to international, local mass affluent, and high-net-worth clients.  It has a network of more than 70 offices across the world, over 80,000 clients and $12bn under advisement.

Ichimoku Cloud Analysis 12.05.2020 (EURUSD, USDCAD, USDJPY)

Article By RoboForex.com

EURUSD, “Euro vs US Dollar”

EURUSD is trading at 1.0810; the instrument is moving below Ichimoku Cloud, thus indicating a descending tendency. The markets could indicate that the price may test the cloud’s downside border at 1.0820 and then resume moving downwards to reach 1.0740. Another signal in favor of further downtrend will be a rebound from the descending channel’s upside border. However, the bearish scenario may be canceled if the price breaks the cloud’s upside border and fixes above 1.0865. In this case, the pair may continue growing towards 1.0945.

EURUSD
Risk Warning: the result of previous trading operations do not guarantee the same results in the future

USDCAD, “US Dollar vs Canadian Dollar”

USDCAD is trading at 1.4026; the instrument is moving above Ichimoku Cloud, thus indicating an ascending tendency. The markets could indicate that the price may test Tenkan-Sen and Kijun-Sen at 1.3975 and then resume moving upwards to reach 1.4150. Another signal in favor of further uptrend will be a rebound from the descending channel’s upside border. However, the bullish scenario may no longer be valid if the price breaks the cloud’s downside border and fixes below 1.3905. In this case, the pair may continue falling towards 1.3815. To confirm further growth, the asset must break the descending channel’s upside border and fix above 1.4070.

USDCAD
Risk Warning: the result of previous trading operations do not guarantee the same results in the future

USDJPY, “US Dollar vs Japanese Yen”

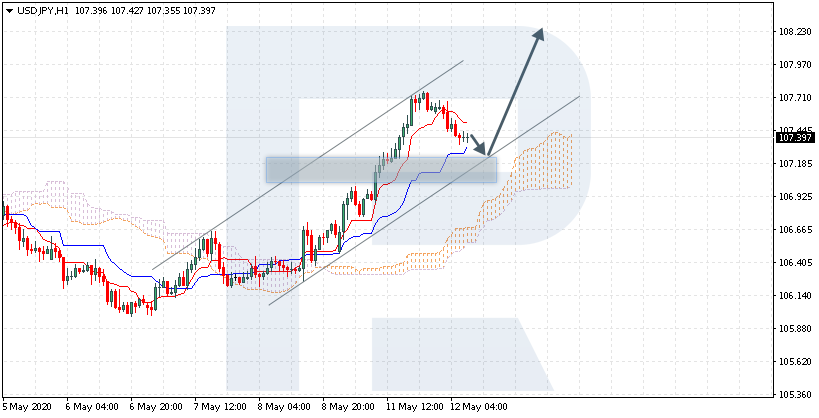
USDJPY is trading at 107.39; the instrument is moving above Ichimoku Cloud, thus indicating an ascending tendency. The markets could indicate that the price may test Tenkan-Sen and Kijun-Sen at 107.20 and then resume moving upwards to reach 108.25. Another signal to confirm further uptrend will be a rebound from the rising channel’s downside border. However, the bullish scenario may no longer be valid if the price breaks the cloud’s downside border and fixes below 106.65. In this case, the pair may continue falling towards 105.75.

USDJPY

Article By RoboForex.com

Attention!
Forecasts presented in this section only reflect the author’s private opinion and should not be considered as guidance for trading. RoboForex LP bears no responsibility for trading results based on trading recommendations described in these analytical reviews.

Japanese Candlesticks Analysis 12.05.2020 (EURUSD, USDJPY, EURGBP)

Article By RoboForex.com

EURUSD, “Euro vs. US Dollar”

As we can see in the H4 chart, after falling towards the support level and forming a Hammer pattern, EURUSD has completed the correction towards the support level. We may assume that later the price may grow towards 1.0910 to continue the ascending tendency. At the same time, there is another scenario, which implies that the price may continue falling to reach 1.0740.

EURUSD
Risk Warning: the result of previous trading operations do not guarantee the same results in the future

USDJPY, “US Dollar vs. Japanese Yen”

As we can see in the H4 chart, after completing a significant growth, USDJPY has formed a Shooting Star reversal pattern. However, the reversal signal seems to be false and the pair may yet resume moving upwards after a slight pullback. In this case, the upside target may be 108.00.

USDJPY
Risk Warning: the result of previous trading operations do not guarantee the same results in the future

EURGBP, “Euro vs. Great Britain Pound”

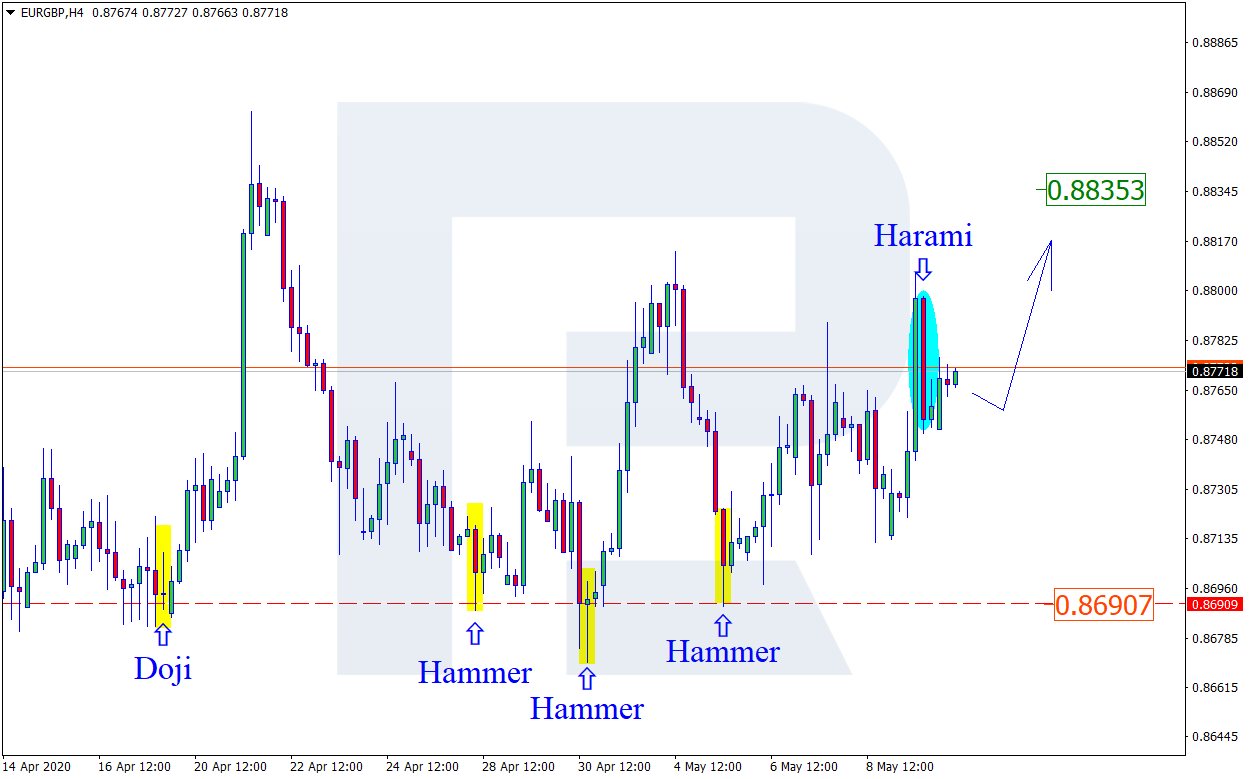
As we can see in the H4 chart, after forming another Hammer pattern and rebounding from the support level, EURGBP is moving towards the resistance area. We may assume that later the pair may form one more slight correction and then continue moving towards the resistance level. In this case, the upside target may be at 0.8835. Still, one shouldn’t exclude an opposite scenario, which implies that the instrument may return to the support level; the downside target is at 0.8690.

EURGBP

Article By RoboForex.com

Attention!
Forecasts presented in this section only reflect the author’s private opinion and should not be considered as guidance for trading. RoboForex LP bears no responsibility for trading results based on trading recommendations described in these analytical reviews.

The Greenback Has Updated Local Highs. Investors Are Concerned About the Second Wave of COVID-19

by JustForex

Yesterday, the US dollar updated its two-week highs and strengthened against a basket of currency majors. The US dollar index (#DX) closed in the positive zone (+0.50%). The US currency supported the growth of government bonds yield amid comments by Fed officials who reduced the likelihood of a transition to negative interest rates. Investors and politicians are concerned about the second outbreak of coronavirus, cause after South Korea and Germany have eased restrictions, an increase in the number of new cases is observed. These events support the demand for “safe haven” currencies.

During the Asian trading session, weak economic data was published in China. Consumer price index (YoY) rose by 3.3% in April, while experts forecasted an increase by 3.7%. The producer price index fell by 3.1% in April instead of 2.6%. Meanwhile, the Bank of China has promised a “more powerful” policy to counter the economic consequences of the COVID-19 pandemic. However, in the quarterly report, the regulator did not provide detailed information on what measures would be taken.

The “black gold” prices have been increasing after the message from Saudi Arabia that they intend to deepen the reduction in production in June in order to cut the excess of oil in the world market. Futures for the WTI crude oil are currently testing the $24.75 mark per barrel. At 23:30 (GMT+03:00), API weekly crude oil stock will be published.

Market indicators

Yesterday, there was a variety of trends in the US stock market: #SPY (+0.02%), #DIA (-0.44%), #QQQ (+0.89%).

The 10-year US government bonds yield is consolidating. At the moment, the indicator is at the level of 0.70-0.71%.

The news feed on 2020.05.12:
  • – US inflation data at 15:30 (GMT+03:00).

We also recommend paying attention to the speech by the FOMC members.

by JustForex

The Analytical Overview of the Main Currency Pairs on 2020.05.12

by JustForex

The EUR/USD currency pair

Technical indicators of the currency pair:
  • Prev Open: 1.08256
  • Open: 1.08051
  • % chg. over the last day: -0.28
  • Day’s range: 1.07845 – 1.08276
  • 52 wk range: 1.0777 – 1.1494

There is an ambiguous technical pattern on the EUR/USD currency pair. The trading instrument is in a sideways trend. Financial market participants expect additional drivers. The demand for safe assets has grown. Investors and politicians are concerned about the second outbreak of coronavirus after a number of restrictions were lifted in most countries. At the moment, the key range is 1.0775-1.0835. We expect inflation data in the US. Positions should be opened from key levels.

At 15:30 (GMT+3:00), the US inflation report will be published.

We also recommend paying attention to the speeches by FOMC representatives.

EUR/USD

Indicators do not give accurate signals: the price has crossed 50 MA.

The MACD histogram is in the negative zone, but above the signal line, which gives a weak signal to sell EUR/USD.

Stochastic Oscillator is near the overbought zone, the %K line has crossed the %D line. There are no signals at the moment.

Trading recommendations
  • Support levels: 1.0775, 1.0750
  • Resistance levels: 1.0835, 1.0875, 1.0895

If the price fixes below 1.0775, the EUR/USD currency pair is expected to fall. The movement is tending to 1.0740-1.0720.

An alternative could be the growth of EUR/USD quotes to 1.0870-1.0890.

The GBP/USD currency pair

Technical indicators of the currency pair:
  • Prev Open: 1.23933
  • Open: 1.23310
  • % chg. over the last day: -0.65
  • Day’s range: 1.22871 – 1.23475
  • 52 wk range: 1.1466 – 1.3516

The GBP/USD currency pair is in a sideways trend. There is no defined trend. The British pound is testing key support and resistance levels: 1.2290 and 1.2360, respectively. The demand for risky assets has weakened. GBP/USD quotes are tending to decline. We expect economic releases from the US. We recommend opening positions from key levels.

The news feed on the UK economy is calm.

GBP/USD

Indicators signal the power of sellers: the price has fixed below 50 MA and 100 MA.

The MACD histogram is in the negative zone, but above the signal line, which gives a weak signal to sell GBP/USD.

Stochastic Oscillator is in the neutral zone, the %K line is above the %D line, which indicates the bullish sentiment.

Trading recommendations
  • Support levels: 1.2290, 1.2250
  • Resistance levels: 1.2360, 1.2405, 1.2455

If the price fixes below 1.2290, GBP/USD quotes are expected to fall. The movement is tending to 1.2260-1.2240.

An alternative could be the growth of the GBP/USD currency pair to 1.2400-1.2430.

The USD/CAD currency pair

Technical indicators of the currency pair:
  • Prev Open: 1.39325
  • Open: 1.40031
  • % chg. over the last day: +0.57
  • Day’s range: 1.40031 – 1.40645
  • 52 wk range: 1.2949 – 1.4668

The USD/CAD currency pair has moved away from local lows. During yesterday’s and today’s trading sessions, the growth of quotes exceeded 100 points. At the moment, the trading instrument has become stable. The loonie is consolidating in the range of 1.4000-1.4060. Economic releases from the US are in the focus of attention. We also recommend paying attention to the dynamics of “black gold” prices. Positions should be opened from key levels.

The news feed on Canada’s economy is calm.

USD/CAD

Indicators do not give accurate signals: the price has crossed 100 MA.

The MACD histogram is in the positive zone, but below the signal line, which gives a weak signal to buy USD/CAD.

Stochastic Oscillator is in the neutral zone, the %K line is below the %D line, which indicates the bearish sentiment.

Trading recommendations
  • Support levels: 1.4000, 1.3955, 1.3900
  • Resistance levels: 1.4060, 1.4100

If the price fixes below the round level of 1.4000, a drop in the USD/CAD quotes is expected. The movement is tending to 1.3960-1.3940.

An alternative could be the growth of the USD/CAD currency pair to 1.4090-1.4120.

The USD/JPY currency pair

Technical indicators of the currency pair:
  • Prev Open: 106.515
  • Open: 107.628
  • % chg. over the last day: +0.70
  • Day’s range: 107.348 – 107.692
  • 52 wk range: 101.19 – 112.41

USD/JPY quotes continue to show a steady uptrend. The trading instrument has set new local highs. At the moment, the “safe haven” currency is consolidating. The key support and resistance levels are 107.35 and 107.75, respectively. In the near future, a technical correction is not ruled out. We expect important statistics from the US. We recommend paying attention to the dynamics of US government bonds yield. Positions should be opened from key levels.

The news feed on Japan’s economy is calm.

USD/JPY

Indicators signal the power of buyers: the price has fixed above 50 MA and 100 MA.

The MACD histogram is in the positive zone, but below the signal line, which gives a weak signal to buy USD/JPY.

Stochastic Oscillator is in the neutral zone, the %K line is above the %D line, which also indicates the bullish sentiment.

Trading recommendations
  • Support levels: 107.35, 107.00, 106.70
  • Resistance levels: 107.75, 108.00

If the price fixes above 107.75, further growth of the USD/JPY quotes is expected. The movement is tending to 108.00-108.20.

An alternative could be a decrease in the USD/JPY currency pair to 107.00-106.80.

by JustForex

NASDAQ Sets Up A Massive Head-n-Shoulders

By TheTechnicalTraders 

– Our research team has identified a potential trade setup in QID that correlates to our ongoing analysis of the US stock market and our Advanced Fibonacci Price Amplitude Arcs.  We believe a major price inflection point is setting up in the US stock market within the next 48 hours that may prompt a price trend reversal in the NASDAQ and other major US stock market indexes.  This pattern correlates to a much longer-term Head-n-Shoulders pattern that is also setting up in the SPY.

Our belief is that technical traders should wait for confirmation of this setup before entering any new trades, yet we believe we will have confirmation of this setup within 3 to 5 trading days – given the urgency of the setup with our Fibonacci Price Amplitude Arcs.  We believe a right-shoulder could be forming as the US stock markets push a bit higher in early trading this week. We believe the Fibonacci Price Acr’s are suggesting a major inflection point is preparing to disrupt price trends.

Just to be clear, this is a prediction, and as technical traders, we wait for confirmation before trading. This is the #1 issue with most traders. They jump the gun and buy into a trade idea before the price chart has confirmed and they lose a lot of money. Follow price, don’ try to lead it.

If our analysis is correct, we may see a fairly strong trend reversal over the next 5+ trading days as this pattern/setup complete and confirm.

Before you continue, be sure to opt-in to our free-market trend signals
before leaving this page, so you don’t miss our next special report & signal!

Daily QID (Inverse Nasdaq ETF) Chart

This Daily QID chart highlights the major RED Fibonacci Price Amplitude Arc that is setting up as well as the more narrow MAGENTA Arc.  Both of these arcs are aligning very close to one another.  Additionally, the RSI suggests any trend reversal to the upside could prompt a moderately large upside price trend.

NAS100 Daily Chart

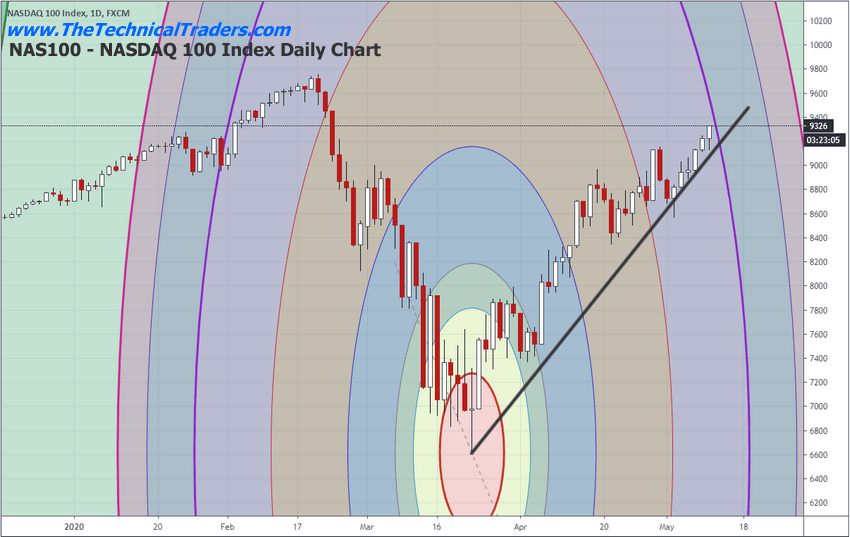
This NAS100 Daily chart highlights the right-shoulder of a longer-term price pattern that we believe may be ending soon.  If our analysis is correct, the right-side of the Head-n-Shoulders pattern may set up near the PURPLE Arc on this chart (or soon after) – prompting a broad downside price trend in the US stock market.

Longer-Term Weekly SPY chart

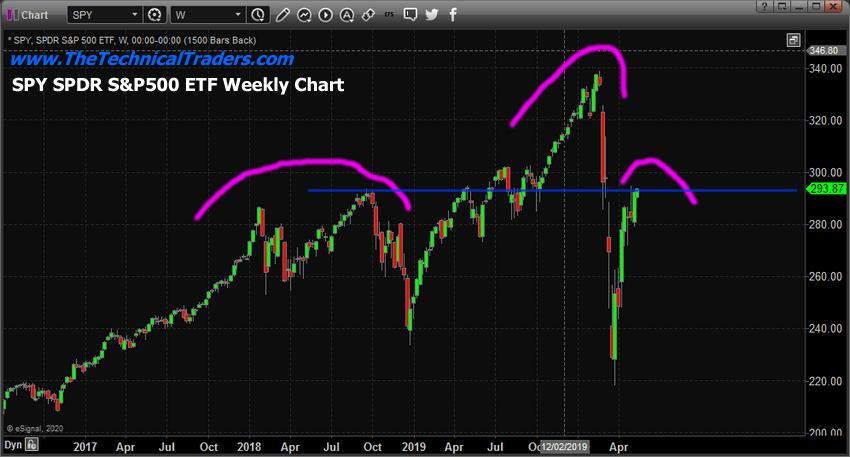
This longer-term Weekly SPY chart shows the Head-n-Shoulder setup that is forming in the SPY.  Although the right side of the shoulder is rather short and volatile, we believe this setup may be a fairly strong potential pattern warning of a stronger downside price trend that may initiate soon.  Obviously, 240 (previous lows) would be an easy objective in the SPY if this happens.

Concluding Thoughts

Current price levels suggest a resistance level has been reached.  If this resistance level persists in containing price and creates a Head-n-Shoulders pattern, there is a very strong likelihood that a broader downside price move may present real opportunities for profits.  Skilled traders should prepare for this potential and watch for confirmation of this pattern/setup.

If you are using our free public research for your own trading decision-making and/or using it as an opportunity to find and execute successful trades, please remember you are the one ultimately making the decisions to trade based on our interpretation and free research posts.  We, as technical traders, will continue to post new research articles and content that we believe is relevant to the current market setups.

If you want to improve your accuracy and opportunities for success, then we urge you to visit TheTechnicalTraders.com to learn how you can enjoy our research and our members-only trading triggers (see the first chart in this article).  If you are managing your retirement account or 401k, then we urge you to visit www.TheTechnicalInvestor.com to learn how to protect your assets and grow your wealth using our proprietary longer-term modeling systems.  Our goal is to help you find and create success – not to confuse you.

Our researchers will generate free research on just about any topic that interests them.  As technical traders, we follow price, predict future price moves, tops, bottoms, and trends, and attempt to highlight incredible setups that exist on the charts.  What you do with it is up to you.  Visit www.TheTechnicalTraders.com/FreeResearch/ to review all of our detailed free research posts.

In closing, we would like to suggest that the next 5+ years are going to be incredible opportunities for skilled traders.  Remember, we’ve already mapped out price trends 10+ years into the future that we expect based on our advanced predictive modeling tools.  If our analysis is correct, skilled traders will be able to make a small fortune trading these trends and Metals will skyrocket.  The only way you’ll know which trades to take or not is to become a member.

Chris Vermeulen
Chief Market Strategist
TheTechnicalTraders.com


Why Financial Trouble Brews on the “Home” Front

By Elliott Wave International

The world has been hearing a lot about “homes” in recent months, as in — “stay there” to help halt the spread of COVID-19.

At the same time, the sales of those homes in the U.S. have seen a significant slowdown.

No doubt about it, the coronavirus has played a big role. Yet, a notable divergence was taking shape in the housing market long before the current pandemic.

Financial history shows that it’s happened before.

Around the time of the prior housing bubble peak, the January 2006 Elliott Wave Financial Forecast, which is an Elliott Wave International monthly publication that mainly focuses on U.S. markets, the economy and cultural trends, noted:

Home sales are falling across the board now, but “virtually no investors expect sudden burst of housing bubble,” says the headline of a UBS/Gallup Poll of investor attitudes: “Just 1% of all investors expect housing prices next year to exhibit a rapid decline.” This sentiment is bearish for real estate prices.

Indeed, U.S. housing prices topped later in 2006. Lower home prices followed slowing sales.

Fast forward to this chart and commentary from the May 2020 Elliott Wave Financial Forecast:

The top graph on the chart shows the median price paid for houses sold in the U.S. … In addition to the terminal five-wave form of the rise, a key to the forecast is seen on the bottom graph. It shows the dramatic divergence in home sales, which retraced just 45% of the 2005-2010 decline.

Individual homeowners would not be the only group hurt if real estate prices fell. Also be aware of this notable factoid and comment from the August 2019 Elliott Wave Theorist:

Since 2012, private equity firms have been buying an average of 10% of the annual inventory of properties for sale in the U.S. They now own huge portfolios of homes worth hundreds of billions of dollars.

You’ve just seen the Elliott wave count of U.S. median home sale prices.

Other financial markets are also at crucial junctures, so this is an ideal time to learn how to apply the Elliott wave method yourself.

Yes, the learning process does require work, but it’s worth it.

As Elliott Wave Principle: Key to Market Behavior states:

All one really needs to know at the time is whether to be long, short or out, a decision that can sometimes be made with a swift glance at a chart and other times only after painstaking work.

If you’re ready to learn, tap into the insights of The Wave Principle Applied, which is a 1-hour course that you can access for free through May 15 by joining Club EWI (membership is also free).

Keep in mind that Elliott Wave International normally sells this course for $99, so take advantage of this limited-time opportunity to learn how to spot Elliott wave patterns on chart patterns of financial markets — 100% free.

Here’s the link that gets you started: The Wave Principle Applied.