Author Archive for InvestMacro – Page 42

The Analytical Overview of the Main Currency Pairs on 2020.05.14

by JustForex

The EUR/USD currency pair

Technical indicators of the currency pair:
  • Prev Open: 1.08470
  • Open: 1.08150
  • % chg. over the last day: -0.28
  • Day’s range: 1.07968 – 1.08239
  • 52 wk range: 1.0777 – 1.1494

The greenback has strengthened relative to its main competitors after a speech by the Fed Chairman. The official denied rumors that the Central Bank may introduce negative interest rates. Jerome Powell also said the US economy could face a long recovery period due to the COVID-19 epidemic. Currently, EUR/USD quotes are consolidating. The key range is 1.0790-1.0835. The single currency has the potential for further decline. Positions should be opened from key levels.

At 15:30 (GMT+3:00), data on initial jobless claims will be published in the US.

We also recommend paying attention to the speech by the FOMC representative Kashkari.

EUR/USD

Indicators signal the power of sellers: the price has fixed below 50 MA and 100 MA.

The MACD histogram is in the negative zone and below the signal line, which gives a strong signal to sell EUR/USD.

Stochastic Oscillator is in the neutral zone, the %K line is above the %D line, which indicates the bullish sentiment.

Trading recommendations
  • Support levels: 1.0790, 1.0770, 1.0740
  • Resistance levels: 1.0835, 1.0875, 1.0895

If the price fixes below 1.0790, a further fall in the EUR/USD currency pair is expected. The movement is tending to 1.0760-1.0740.

An alternative could be the growth of EUR/USD quotes to 1.0860-1.0890.

The GBP/USD currency pair

Technical indicators of the currency pair:
  • Prev Open: 1.22597
  • Open: 1.22220
  • % chg. over the last day: -0.25
  • Day’s range: 1.21812 – 1.22417
  • 52 wk range: 1.1466 – 1.3516

GBP/USD quotes continue to show a negative trend. The British pound has reached two-month lows. Currently, GBP/USD quotes are consolidating. The key support and resistance levels are 1.2180-1.2250. Demand for the US dollar has resumed after a speech by the Fed Chairman. A trading instrument has the potential for further decline. We recommend opening positions from key levels.

The news feed on the UK economy is calm.

GBP/USD

Indicators signal the power of sellers: the price has fixed below 50 MA and 100 MA.

The MACD histogram is in the negative zone and below the signal line, which gives a strong signal to sell GBP/USD.

Stochastic Oscillator has started exiting the oversold zone, the %K line is above the %D line, which indicates the bullish sentiment.

Trading recommendations
  • Support levels: 1.2180, 1.2140, 1.2100
  • Resistance levels: 1.2250, 1.2285, 1.2335

If the price fixes below 1.2180, a further drop in GBP/USD quotes is expected. The movement is tending to the round level is 1.2140-1.2120.

An alternative could be the growth of the GBP/USD currency pair to 1.2290-1.2330.

The USD/CAD currency pair

Technical indicators of the currency pair:
  • Prev Open: 1.40770
  • Open: 1.40986
  • % chg. over the last day: +0.15
  • Day’s range: 1.40853 – 1.41158
  • 52 wk range: 1.2949 – 1.4668

Purchases prevail on the USD/CAD currency pair. The trading instrument has updated local highs again. The loonie is currently testing a resistance level of 1.4115. The 1.4065 mark is already a “mirror” support. We expect economic reports from the US. We also recommend paying attention to the dynamics of “black gold” prices. Positions should be opened from key levels.

At 18:15 (GMT+3:00), a speech by the Bank of Canada Governor will be held.

USD/CAD

Indicators signal the power of buyers: the price has fixed above 50 MA and 100 MA.

The MACD histogram is in the positive zone, but below the signal line, which gives a weak signal to buy USD/CAD.

Stochastic Oscillator is in the neutral zone, the %K line is below the %D line, which indicates the bearish sentiment.

Trading recommendations
  • Support levels: 1.4065, 1.4010, 1.3970
  • Resistance levels: 1.4115, 1.4170

If the price fixes above the resistance level of 1.4115, further growth of the USD/CAD quotes is expected. The movement is tending to 1.4150-1.4200.

An alternative could be a decrease in the USD/CAD currency pair to 1.4030-1.4000.

The USD/JPY currency pair

Technical indicators of the currency pair:
  • Prev Open: 107.135
  • Open: 107.040
  • % chg. over the last day: -0.11
  • Day’s range: 106.776 – 107.072
  • 52 wk range: 101.19 – 112.41

There is the bearish sentiment on the USD/JPY currency pair. The trading instrument has updated local lows. At the moment, USD/JPY quotes are testing the support level of 106.75. The 107.15 mark is already a “mirror” resistance. The yen has the potential for further growth relative to the greenback. We recommend paying attention to economic releases, as well as the dynamics of US government bonds yield. Positions should be opened from key levels.

The news feed on Japan’s economy is calm.

USD/JPY

Indicators do not give accurate signals: the price has fixed between 50 MA and 100 MA.

The MACD histogram is in the negative zone, indicating the bearish sentiment.

Stochastic Oscillator is in the neutral zone, the %K line has crossed the %D line. There are no signals at the moment.

Trading recommendations
  • Support levels: 106.75, 106.45
  • Resistance levels: 107.15, 107.35, 107.75

If the price fixes below the support level of 106.75, a further drop in the USD/JPY quotes is expected. The movement is tending to 106.50-106.30.

An alternative could be the growth of the USD/JPY currency pair to 107.30-107.60.

by JustForex

Why This Wave is Usually a Market Downturn’s Most Wicked

The progression of mass emotions in financial markets “tends to follow a similar path each time around”

By Elliott Wave International

The Wave Principle’s basic pattern includes five waves in the direction of the larger trend, followed by three corrective waves.

In a bull market, the pattern is five up, followed by three down. In a bear market, the pattern unfolds in reverse: the five waves trend downward and the correction trends upward.

Each of these waves sports its own characteristics.

As the Wall Street classic book, Elliott Wave Principle: Key to Market Behavior, by Frost & Prechter, says:

The personality of each wave in the Elliott sequence is an integral part of the reflection of the mass psychology it embodies. The progression of mass emotions from pessimism to optimism and back again tends to follow a similar path each time around.

For example, strong price advances on high volume typically happen during wave 3 in a bull market. Of course, in a bear market, the strong price action is downward.

Returning to Elliott Wave Principle:

Third waves usually generate the greatest volume and price movement and are most often the extended wave in a series.

Let’s review an instance of a third wave in a downturn from recent financial history.

Here’s a chart and commentary from Elliott Wave International’s Aug. 21, 2015 U.S. Short Term Update:

This week’s sharp decline is clearly a third wave. It sports a steep slope with strong downside breadth and volume.

During the next trading session (August 24, 2015), the Dow fell nearly 1,100 points at the open.

As you might imagine, it would be highly helpful to learn how to anticipate third waves so one can prepare.

Indeed, Elliott Wave International has just made the 1-hour course, The Wave Principle Applied, free through May 15 for free Club EWI members. Club EWI membership allows you to get Elliott wave insights on investing and trading, the economy and social trends that you will not find anywhere else.

The Wave Principle Applied normally sells for $99, so you are encouraged to take advantage of this limited-time offer to access the course for free.

As the Wall Street classic book, Elliott Wave Principle: Key to Market Behavior, by Frost & Prechter says:

Without Elliott, there appear to be an infinite number of possibilities for market action. What the Wave Principle provides is a means of first limiting the possibilities and then ordering the relative probabilities of possible future market paths. Elliott’s highly specific rules reduce the number of valid alternatives to a minimum.

Get started with The Wave Principle Applied.

This article was syndicated by Elliott Wave International and was originally published under the headline Why This Wave is Usually a Market Downturn’s Most Wicked. EWI is the world’s largest market forecasting firm. Its staff of full-time analysts led by Chartered Market Technician Robert Prechter provides 24-hour-a-day market analysis to institutional and private investors around the world.

What is the SBA? An unheralded agency faces the unprecedented task of saving America’s small businesses

By Caroline Bruckner, American University Kogod School of Business

The coronavirus pandemic is devastating small businesses across the U.S. because of shelter-in-place orders that have forced millions to temporarily close.

So far, Congress has devoted more than US$375 billion to helping restaurants, retailers and other small companies endure the crisis, and lawmakers are currently discussing spending hundreds of billions more.

The Small Business Administration is at the center of these efforts. But early reports suggest the agency is struggling with the flood of requests it’s received for loans – more than 70% of U.S. small businesses have reportedly already applied for assistance – leading to a lot of frustration among owners desperate for support.

From 2010 through 2014, I worked as general and then-chief counsel to the U.S. Senate Committee on Small Business and Entrepreneurship, where I helped write laws to aid small businesses recover from the Great Recession.

Congress’ quick actions are encouraging, but I believe the SBA needs to do more to ensure aid goes to those most in need – including the more than 13 million small businesses owned by women that have challenges accessing capital even under normal circumstances.

Image by Free-Photos / Pixabay

An advocate for small business

The Small Business Administration was established in 1953 as an independent agency dedicated to counseling and advocating for small businesses. It replaced existing lending and contracting programs established during the Great Depression and World War II.

At the time, there were allegations of cronyism and political favoritism that made it harder for smaller companies to compete for lucrative government contracts. The SBA was meant to help small businesses bid for more contracts and access capital, as well as provide aid after a disaster.

Over time, the SBA’s mission has grown to include a suite of lending programs, contracting and entrepreneurial development initiatives.

Its roots in helping small businesses compete for government contracts has resulted in a range of definitions as to what constitutes a small business. SBA itself has different definitions depending on industry, which can range from 100 to 1,500 employees or $750,000 to $38.5 million in annual sales.

The more than 30 million small businesses the SBA counts today are vital to the U.S. economy. They create two-thirds of net new jobs and employ almost half of all private sector employees.

Providing aid in a crisis

One of the SBA’s main duties is providing aid to small businesses to help them recover following natural disasters such as hurricanes or tornadoes and other crises.

For example, the SBA dispensed $3.59 billion in disaster loan assistance in fiscal year 2018 following the devastation caused by hurricanes Harvey, Irma and Maria in 2017.

But the SBA has never done anything on the scale it’s being asked to do to help small businesses survive the coronavirus pandemic.

The first piece of legislation Congress passed in response to the crisis in early March included $20 million in emergency supplemental funding for SBA’s economic injury disaster loan program, which offers loans of up to $2 million.

Realizing that small businesses that were being forced to shut down in droves would need significantly more aid, Congress added hundreds of billions more funding in the $2 trillion CARES Act, which was signed into law on March 27.

The law gave $10 billion more to the SBA’s Economic Injury Disaster Loan Program to allow the SBA to hand out up to $10,000 grants immediately to applicants who are eligible for the program – even if they are ultimately denied.

In addition, it created the $349 billion paycheck protection program in an effort to encourage companies to continue to employ their workers during the pandemic. The program allows companies with fewer than 500 employees to receive as much as $10 million. Money used for “allowable” expenses such as payroll and rent doesn’t have to be paid back as long as a few other conditions are met.

Lawmakers are considering ways to provide small businesses with more support – perhaps another $250 billion or more – in another bailout package.

Unprecedented need

But the unprecedented size of the need has led to many stumbling blocks in rolling out the programs.

The New York Times reported that applicants are waiting weeks for approval, while others are being told they will get a fraction of what they expected.

In addition, other reports have found that the $10,000 emergency grants that were supposed to be available within three days haven’t gone out to at least some applicants. An SBA official said the agency has already received over 3 million applications for the grants, which would cost $30 billion, triple the amount originally set aside.

And there was confusion over the rules companies must follow. On April 3, the SBA issued an interim final rule that said 75% of the proceeds of the paycheck protection program loan must go to payroll costs, which wasn’t in the CARES Act. Retailers, restaurants and other companies with high rents and other overhead complain that they won’t be able to meet that threshold.

Challenges for women-owned businesses

The situation is urgent as research shows that about half of small businesses typically have cash on hand to last 15 days. At the same time, loans are distributed on a “first-come, first-serve” basis.

And for businesses owned by people of color or women, things can be even more acute. My own research, for example, found that women-owned businesses tend to lack access to capital and often don’t benefit from tax breaks and other support intended for small companies. And because they are less likely to have banking relationships with the lenders the SBA traditionally works with, women business owners may need special attention to ensure they get the support they need to weather this crisis.

While getting money out the door fast is critical, it’s equally important it gets to the companies that need it most.

About the Author:

Caroline Bruckner, Executive in Residence, Department of Accounting and Taxation, American University Kogod School of Business

This article is republished from The Conversation under a Creative Commons license. Read the original article.


US-UK trade talks have begun – here’s what each side wants and what to expect

By Karen Jackson, University of Westminster and Oleksandr Shepotylo, Aston University

Trade talks between the UK and US have officially begun. Both parties are working towards a free trade agreement – a full deal, as opposed to something like the recent China-US “mini deal” that focuses on certain export targets to manage trade between the two countries. Like a lot of relationships at the moment, this one is being negotiated over video.

There are doubts over the timeline of when these talks will come to a conclusion. As well as the coronavirus pandemic, the picture is further complicated by the ongoing EU-UK talks. But at the outset of this process there are some things we know about what each side is looking to get out of a deal.

What the UK wants

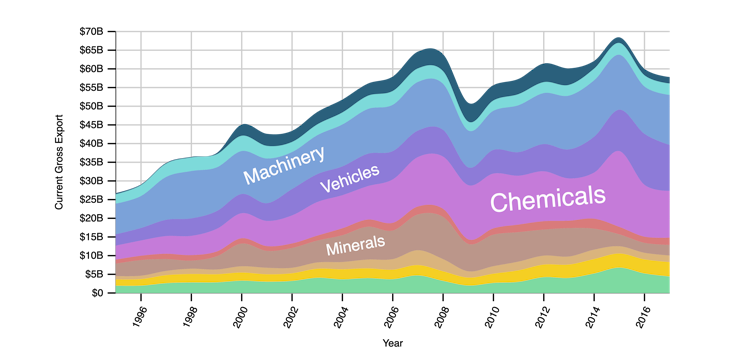
The US is already the UK’s biggest destination for goods, sending 13% of its exports there in 2018. The UK wants better access for these US-bound exports, particularly food and agricultural products, though those only account for 5% of its US exports overall.

Improving market access relies on an array of factors, starting with tariffs. For example, ceramics face a particularly high tariff of 28%, as do some categories of textiles, at 32%.

Agreement must also be reached on rules of origin, where there is a joint understanding as to how the origin of each product will be decided. This is very important since 70% of trade involves global value chains, so most goods have value added by producers from more than one country. This means that deciding on a single origin for each product is tricky and may have an impact on the costs of trading, since various duties depend on the origin of the product. Further issues involve technical barriers to trade, standards, and agreements on testing procedures.

UK exports to US.
Atlas of Economic Complexity

As well as goods, trade in services is also on the agenda. The UK is keen to see improved market access for UK services in accountancy, architecture and finance, as well as freedom of movement and mutual recognition of professional qualifications.

What the US wants

The US already has lower tariffs than the UK for most categories of goods, so it would expect more concessions from the UK side in this regard. For instance, US tariffs on imported cars are 2.5%, while UK tariffs are 10%.

The UK currently meets EU regulations for environmental, fuel efficiency and safety standards for cars. A comparison of EU and US regulations shows numerous differences: the US directly sets minimum fuel efficiency, while the EU does not; the EU and US have different emission standards. Even seatbelt regulations differ. This has important implications for how cars are built, making it more difficult and expensive to export cars to both markets.

The US team will also push for US products to be traded more freely in the UK market – hence, chlorinated chickens and other agricultural and food products produced according to US standards.

When it comes to services, the US will want to better access for its healthcare and pharmaceutical companies. So even though the UK government says that the NHS is not on the table, we can expect US negotiators to try and gain access to it.

EU looms large

These UK-US negotiations cannot be separated out from those between the EU and UK, since US demands are bound to clash with some EU rules and regulations. This will lead to a painful trade-off for the UK, which will have to choose between closer economic ties to either the EU or US.

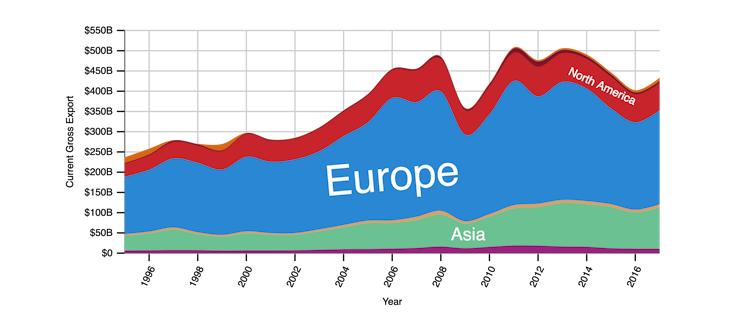
The fact that the US is a much smaller trade partner than the EU means potential gains from the UK-US deal are quite small. When you add the issue of regulations to this – the UK and EU are already much more closely aligned, whereas the US has a much more liberal policy environment – the UK has a lot to lose from worsened access to EU markets.

The UK exports far more to Europe than the US.
Atlas of Economic Complexity

We show in our research that even if the UK manages to secure preferential trade arrangements with the US and the Commonwealth countries combined, it will not offset the negative impact of Brexit. Because the EU is the UK’s biggest trade partner, the UK will benefit the most from securing a full free trade deal with the EU.

Negotiating tactics

The UK is using an interesting negotiating tactic of launching simultaneous trade talks with the EU and US. The idea is that if it achieves good progress in its trade talks with the US, it can use this as leverage to influence negotiations with the EU.

This approach has been criticised by some trade experts because it spreads the UK negotiating capacities too thin and creates difficulties in coordinating these talks. The fact that the negotiations must now be carried out remotely makes it even more difficult due to the logistical constraints of talking over video.

The US-Japan Trade Agreement came into effect this year after six months of negotiations and using a fast-track approvals process in the US. However, this was really only another mini-deal concentrating on tariffs and digital trade. This suggests that a comprehensive UK-US deal will take much longer and would need a vote in Congress.

In between dealing with the COVID-19 outbreak and the associated economic fallout, as well as the US elections, it may take a while before we see any results from these virtual negotiations. And we must remember that the UK government’s own modelling suggests that a deal will bring limited economic gains for the UK.The Conversation

About the Authors:

Karen Jackson, Senior Lecturer in Economics, University of Westminster and Oleksandr Shepotylo, Lecturer in Economics, Aston University

This article is republished from The Conversation under a Creative Commons license. Read the original article.

FX Swaps During a Declining Market – Are They Worth It?

By ForexNewsNow

Foreign Currency swaps were originally introduced by the World Bank back in 1981. Its main purpose was to secure loans in foreign currency at lower interest rates. Basically this is a currency exchange agreement, where parties agree to swap interest and principal payments on loans, denominated in two different currencies.

According to the definition, any amount of interest paid or received by a trader is called a Swap. Every currency on the Forex market has its own interest rate, usually determined by the Central bank. If a trader buys a higher-yielding currency and borrows a lower-yielding currency, then he or she will receive interest on daily bases. If the opposite is the case, then a market participant has to pay a swap.

If we see the definition of FX swaps here it basically means that this is the essence of carrying trades strategies, where traders are looking to borrow in lower-yielding currencies and buy higher-yielding currencies in order to receive daily swaps. For many years thousands of professional traders employed this strategy and as a result, earned a significant amount of payouts.

However, the situation has changed dramatically since the outbreak of COVID-19. As late as February 2019, the US Federal Reserve kept interest rates at 1.50% to 1.75% range, the Australian dollar, the UK Pound both yielded 0.75%, the Canadian dollar – 1.25%, New Zealand dollar – 1.00%.

At the same time, carry traders had three major funding currencies at their disposal: the European Central Bank kept rates at 0%, the Japanese Yen and Swiss Francs both had a negative -0.1% and -0.75% yields respectively.

So as we can see even as late as two months ago carry traders had plenty of options to choose from. For example, by opening and keeping long USD/JPY positions a trader could potentially earn up to 1.85% annually on swap payments. Now, this amount of interest does not sound that impressive, but here we have to keep in mind that most Forex traders use leveraged positions.

For example, suppose that a trader used $10,000 with 1:20 leverage and opened a $200,000 long USD/JPY position. From this, he or she might earn up to $3,700 per annum or approximately $308 per month. This represents a 37% annual return, considerably better payout compared to any savings accounts or dividend stock yields.

Here it might be helpful to point out that the heavy majority of brokers do not pay the exact yield difference between two currencies. The actual amount of swap might be slightly lower than that, yet still, for years traders could have earned significant payouts.

New Reality with Forex Swaps

As the COVID-19 concerns started to affect the markets, major central banks one by one started cutting rates dramatically. Nowadays all those higher-yielding currencies, USD, GBP, AUD, CAD, NZD have their interest rates between 0.1% to 0.25%. Consequently, the potential returns from carrying trades have diminished significantly. Yes, theoretically a trader with some brokers can still earn up to 0.35% annual return from holding a long AUD/JPY position, however, this is more than 5 times less return, compared to the above example.

Obviously this state of affairs might not persist for very long, maybe from next year, some central banks might consider hiking their key interest rates, and consequently, there might be more opportunities for carrying trades.

However, for now, traders have two options. Firstly they can increase their trading balances considerably. For example, instead of depositing $10,000, one can invest $50,000 and earn roughly similar returns from holding long AUD/CHF or NZD/JPY positions, as traders earned with USD/JPY before the outbreak of the COVID-19 pandemic. This might work for some people, but many traders might not be comfortable with depositing such large amounts or some of them might simply not afford to do that.

The second option is to buy higher-yielding emerging market currencies. For example, the South African Reserve Bank still keeps its key interest rate at 4.25%, Russian Ruble has a yield of 6%, the Turkish Lira – 8.75%. The main issue here is that those currencies have much higher inflation rates and most of them have a history of long term depreciation against major currencies. In fact, according to Bloomberg, some of those central banks are already cutting their rates. Therefore opening and holding short USD/RUB or EUR/ZAR positions for a long time might be riskier, than most traders are comfortable with.

In conclusion, Foreign Currency swaps are much less profitable and attractive today, then even months before, but it is up to an individual to decide if it’s worth investing in them.

By ForexNewsNow


Forex Technical Analysis & Forecast 13.05.2020

Article By RoboForex.com

EURUSD, “Euro vs US Dollar”

After extending the ascending structure towards 1.0880 and then finishing the descending impulse at 1.0850, EURUSD has formed a new consolidation range around the latter level. Possibly, the pair may break the range to the downside and then resume trading downwards with the short-term target at 1.0817.

EURUSD
Risk Warning: the result of previous trading operations do not guarantee the same results in the future

GBPUSD, “Great Britain Pound vs US Dollar”

After breaking 1.2308 to the downside, GBPUSD is still falling to reach 1.2239. After that, the instrument may correct to test 1.2308 from below and then continue trading inside the downtrend with the target at 1.2146.

GBPUSD
Risk Warning: the result of previous trading operations do not guarantee the same results in the future

USDRUB, “US Dollar vs Russian Ruble”

USDRUB is trading to break 73.00 to the downside. Possibly, the pair may form one more ascending structure towards 73.50 to test it from below. Later, the market may break the downside border of the current range and then resume trading inside the downtrend with the target at 72.22.

USDRUB
Risk Warning: the result of previous trading operations do not guarantee the same results in the future

USDJPY, “US Dollar vs Japanese Yen”

After breaking 107.34 to the downside, USDJPY is expected to reach 107.03. After that, the instrument may correct to return to 107.354 and then form a new descending structure with the first target at 106.95.

USDJPY
Risk Warning: the result of previous trading operations do not guarantee the same results in the future

USDCHF, “US Dollar vs Swiss Franc”

After extending the descending wave towards 0.9666, USDCHF has formed a new consolidation range around 0.9696. Possibly, today the pair may break the range to the upside and grow with the target at 0.9720. Later, the market may correct to return to 0.9696.

USDCHF
Risk Warning: the result of previous trading operations do not guarantee the same results in the future

AUDUSD, “Australian Dollar vs US Dollar”

After completing the first descending impulse at 0.6464, AUDUSD is consolidating around this level. According to the main scenario, the price is expected to break this range to the downside and then start another decline with the target at 0.6393.

AUDUSD
Risk Warning: the result of previous trading operations do not guarantee the same results in the future

BRENT

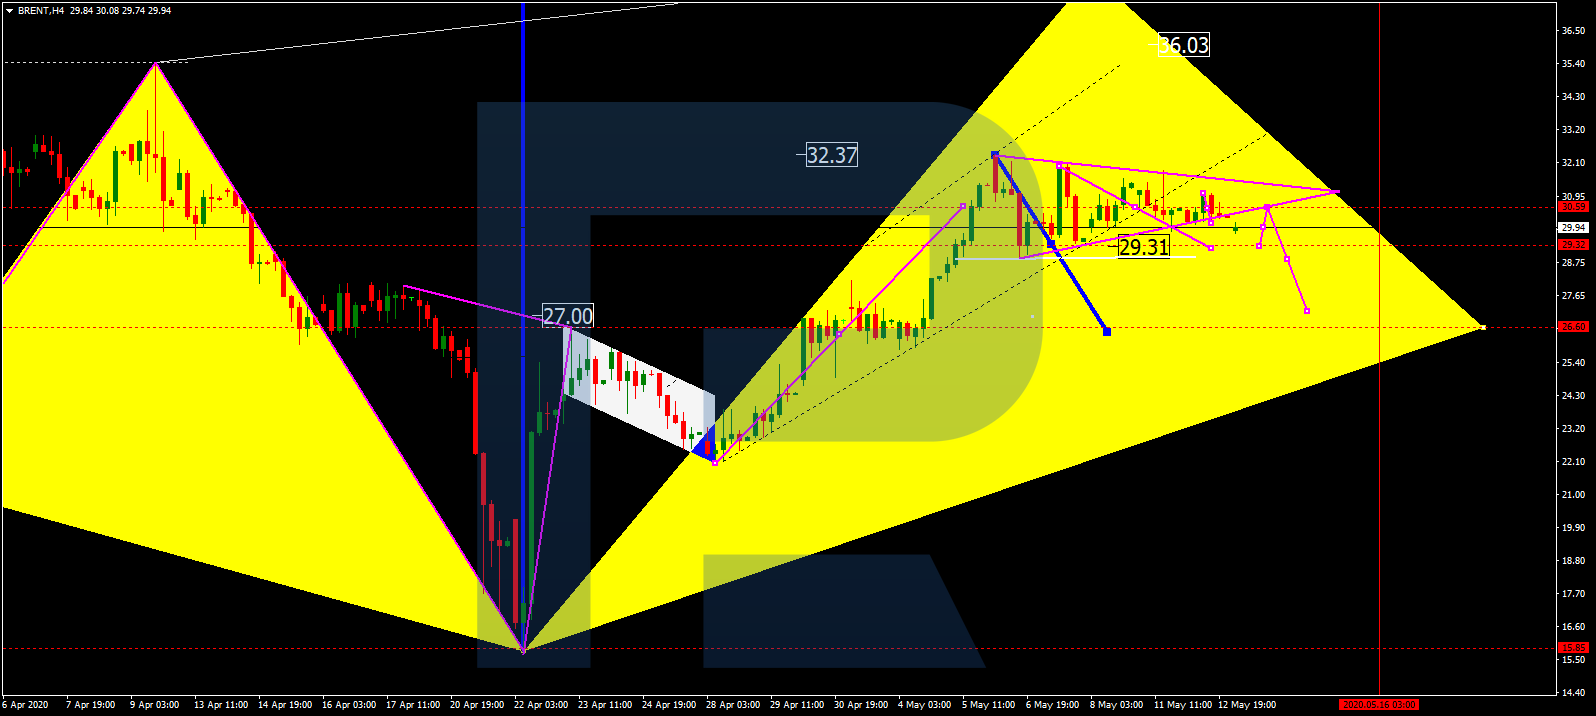
After breaking its consolidation range to the downside, Brent is expected to fall towards 29.30. Today, the pair may break this level as well and then continue the correction to reach 27.00. Later, the market may start forming the fifth ascending wave with the target at 38.20.

BRENT
Risk Warning: the result of previous trading operations do not guarantee the same results in the future

XAUUSD, “Gold vs US Dollar”

After completing the correction at 1700.00, Gold is expected to trade upwards and reach 1712.00. After breaking this level to the upside, the market may continue growing with the target at 1723.20.

GOLD
Risk Warning: the result of previous trading operations do not guarantee the same results in the future

BTCUSD, “Bitcoin vs US Dollar”

BTCUSD is consolidating around 8800.00. Possibly, today the pair may trade upwards to reach 9450.00 and then form a new descending structure to return to 8800.00. After that, the instrument may start another growth with the target at 9900.00.

BITCOIN
Risk Warning: the result of previous trading operations do not guarantee the same results in the future

S&P 500

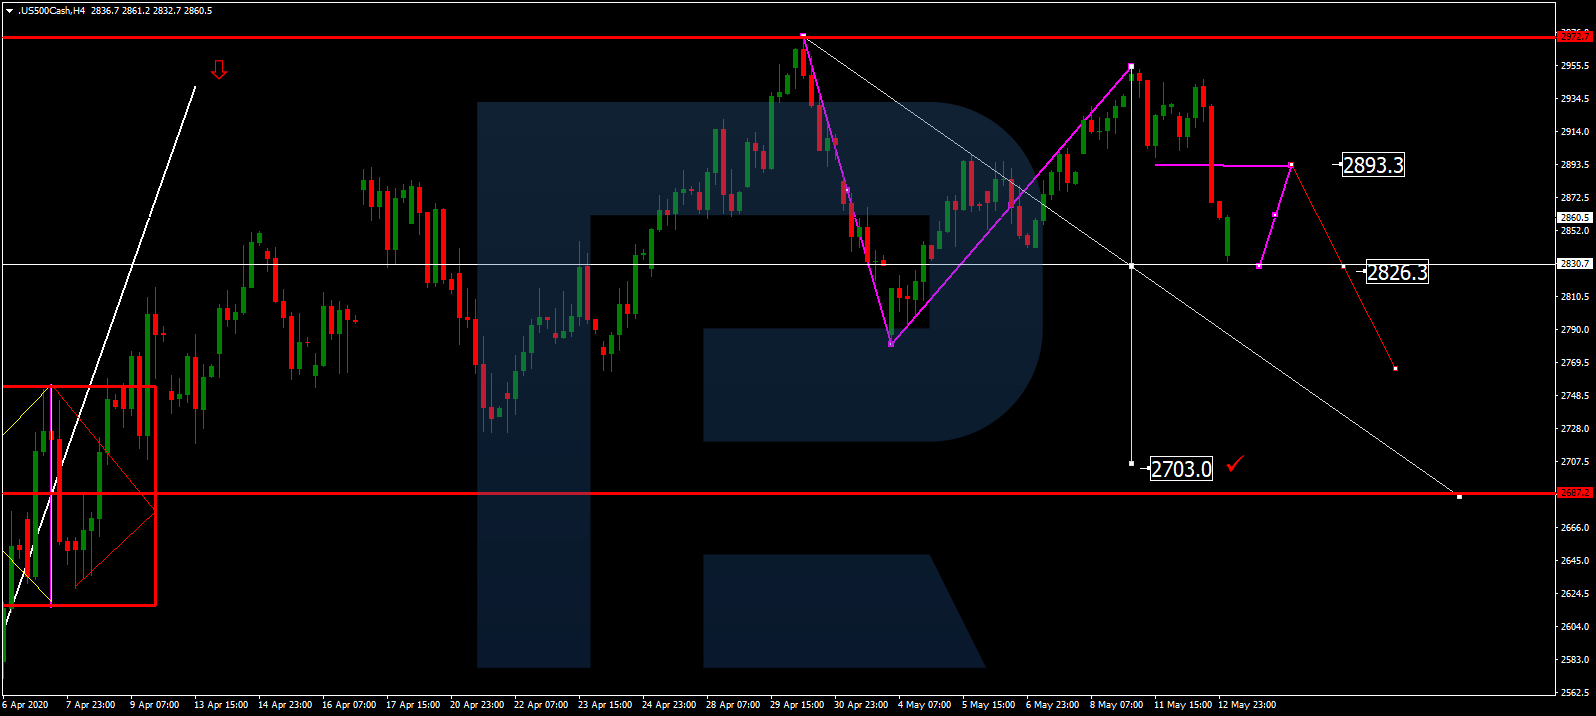
After breaking 2893.3 to the downside, the Index has reached 2835.0. Today, the pair may return to 2893.2 and test it from below. Later, the market may form a new descending structure to break 2826.5 and then continue trading downwards with the target at 2750.5.

S&P 500

Article By RoboForex.com

Attention!
Forecasts presented in this section only reflect the author’s private opinion and should not be considered as guidance for trading. RoboForex LP bears no responsibility for trading results based on trading recommendations described in these analytical reviews.

Fibonacci Retracements Analysis 13.05.2020 (GBPUSD, EURJPY)

Article By RoboForex.com

GBPUSD, “Great Britain Pound vs US Dollar”

As we see in the H4 chart, GBPUSD is steadily trading downwards within another correctional wave with the targets at 38.2%, 50.0%, and 61.8% fibo at 1.2175, 1.2030, and 1.1881 respectively. After completing this correctional downtrend, the pair is expected to start a new rising wave or impulse to break the high at 1.2648. Later, the market may form a long-term rising wave to reach 50.0% fibo at 1.2892.

GBPUSD_H4
Risk Warning: the result of previous trading operations do not guarantee the same results in the future

The H1 chart shows the current descending wave towards 38.2% fibo at 1.2175. At the same time, there might be convergence on MACD, which may indicate a possible pullback towards 23.6% fibo after the price reaches its target.

GBPUSD_H1
Risk Warning: the result of previous trading operations do not guarantee the same results in the future

EURJPY, “Euro vs. Japanese Yen”

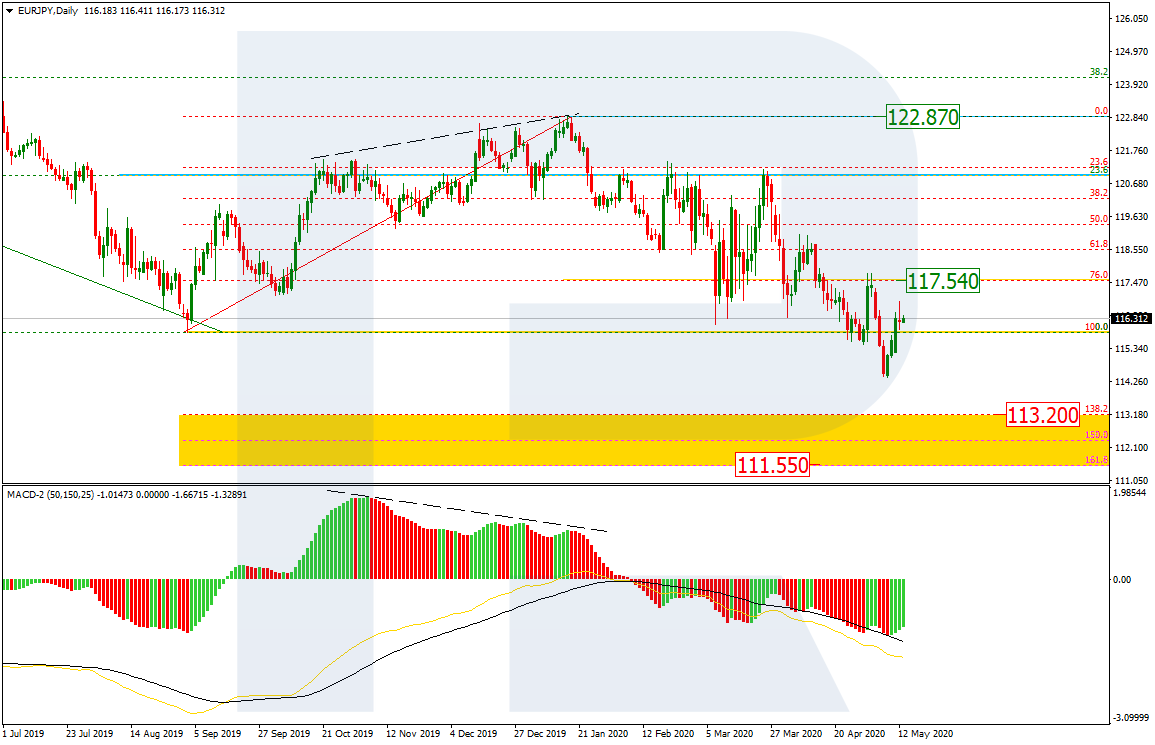
As we can see in the daily chart, after breaking the previous low, EURJPY has returned to it once again; this movement may be considered as an internal pullback within the descending wave but this pullback may transform into a correction in the form of the sideways channel. The local target of this pullback is 76.0% fibo at 117.54, which is the current resistance. The key downside targets remain inside the post-correctional extension area between 138.2% and 161.8% fibo at 113.20 and 111.55 respectively.

EURJPY_D1
Risk Warning: the result of previous trading operations do not guarantee the same results in the future

The H4 chart shows more detailed structure of the current pullback after the convergence. If the pair fails to reach the resistance at 117.54, the instrument may form a new descending impulse towards the post-correctional extension area between 138.2% and 161.8% fibo at 113.20 and 111.55 respectively.

GBPUSD_H4

Article By RoboForex.com

Attention!
Forecasts presented in this section only reflect the author’s private opinion and should not be considered as guidance for trading. RoboForex LP bears no responsibility for trading results based on trading recommendations described in these analytical reviews.

The Analytical Overview of the Main Currency Pairs on 2020.05.13

by JustForex

The EUR/USD currency pair

Technical indicators of the currency pair:
  • Prev Open: 1.08051
  • Open: 1.08470
  • % chg. over the last day: +0.37
  • Day’s range: 1.08411 – 1.08569
  • 52 wk range: 1.0777 – 1.1494

EUR/USD quotes have moved away from local lows. The greenback demand has weakened after the release of weak data on inflation in the US. Financial market participants have taken a wait-and-see attitude before today’s speech by Fed Chairman Jerome Powell. Investors assess rumors that the regulator may cut rates into negative territory in the future. At the moment, the EUR/USD currency pair is consolidating in the range of 1.0835-1.0875. A trading instrument has the potential for further growth. Positions should be opened from key levels.

At 15:30 (GMT+3:00), the US producer price index will be published.

EUR/USD

Indicators do not give accurate signals: the price has fixed between 50 MA and 100 MA.

The MACD histogram is in the positive zone, but below the signal line, which gives a weak signal to buy EUR/USD.

Stochastic Oscillator is in the neutral zone, the %K line is below the %D line, which indicates the bearish sentiment.

Trading recommendations
  • Support levels: 1.0835, 1.0790, 1.0770
  • Resistance levels: 1.0875, 1.0895, 1.0925

If the price fixes above 1.0875, further growth of the EUR/USD currency pair is expected. The movement is tending to 1.0900-1.0930.

An alternative could be a drop in EUR/USD quotes to 1.0800-1.0780.

The GBP/USD currency pair

Technical indicators of the currency pair:
  • Prev Open: 1.23310
  • Open: 1.22597
  • % chg. over the last day: -0.61
  • Day’s range: 1.22512 – 1.23013
  • 52 wk range: 1.1466 – 1.3516

Sales prevail on the GBP/USD currency pair. The British pound has reached key extremes. Currently, GBP/USD quotes are consolidating in the range of 1.2250-1.2300. Financial market participants assess the UK GDP report. The Office for National Statistics reported that the country’s GDP fell by 2.0% (q/q) in the first quarter. At the same time, experts forecasted a 2.5% drop (q/q). A trading instrument has the potential for further decline. We recommend opening positions from key levels.

We expect important economic releases from the US.

GBP/USD

Indicators signal the power of sellers: the price has fixed below 50 MA and 100 MA.

The MACD histogram is in the negative zone, but above the signal line, which gives a weak signal to sell GBP/USD.

Stochastic Oscillator is in the neutral zone, the %K line is below the %D line, which also indicates the bearish sentiment.

Trading recommendations
  • Support levels: 1.2250, 1.2200
  • Resistance levels: 1.2300, 1.2360, 1.2405

If the price fixes below 1.2250, a further drop in GBP/USD quotes is expected. The movement is tending to the round level is 1.2200.

An alternative could be the growth of the GBP/USD currency pair to 1.2340-1.2370.

The USD/CAD currency pair

Technical indicators of the currency pair:
  • Prev Open: 1.40031
  • Open: 1.40770
  • % chg. over the last day: +0.51
  • Day’s range: 1.40444 – 1.40853
  • 52 wk range: 1.2949 – 1.4668

The USD/CAD currency pair has recovered most of the losses after a sharp decline at the end of last week. The loonie is currently consolidating. Investors expect additional drivers. The local support and resistance levels are 1.4035 and 1.4085, respectively. Today we recommend paying attention to the news feed on the US economy, as well as the dynamics of “black gold” prices. Positions should be opened from key levels.

The news feed on Canada’s economy is calm.

USD/CAD

Indicators do not give accurate signals: 50 MA has started crossing 100 MA.

The MACD histogram is in the positive zone, but below the signal line, which gives a weak signal to buy USD/CAD.

Stochastic Oscillator is in the neutral zone, the %K line is above the %D line, which indicates the bullish sentiment.

Trading recommendations
  • Support levels: 1.4035, 1.4000, 1.3970
  • Resistance levels: 1.4085, 1.4120, 1.4170

If the price fixes above the resistance level of 1.4085, further growth of the USD/CAD quotes is expected. The movement is tending to 1.4120-1.4150.

An alternative could be a decrease in the USD/CAD currency pair to 1.4000-1.3970.

The USD/JPY currency pair

Technical indicators of the currency pair:
  • Prev Open: 107.628
  • Open: 107.135
  • % chg. over the last day: -0.49
  • Day’s range: 107.003 – 107.276
  • 52 wk range: 101.19 – 112.41

The USD/JPY currency pair has been declining. The trading instrument has updated local lows. The greenback demand has weakened. At the moment, USD/JPY quotes are testing a round level of 107.00. The 107.35 mark is the nearest resistance. The yen has the potential for further growth against the US currency. We expect important economic reports from the US. Positions should be opened from key levels.

The news feed on Japan’s economy is calm.

USD/JPY

Indicators do not give accurate signals: the price has fixed between 50 MA and 100 MA.

The MACD histogram is in the negative zone and below the signal line, which gives a strong signal to sell USD/JPY.

Stochastic Oscillator is in the neutral zone, the %K line has crossed the %D line. There are no signals at the moment.

Trading recommendations
  • Support levels: 107.00, 106.70, 106.45
  • Resistance levels: 107.35, 107.75

If the price fixes below the round level of 107.00, a further drop in the USD/JPY quotes is expected. The movement is tending to 106.70-106.50.

An alternative could be the growth of the USD/JPY currency pair to 107.60-107.90.

by JustForex

Kiwi Has Collapsed After the RBNZ Meeting. Investors Expect a Press Conference of the Fed Chairman

by JustForex

During yesterday’s trading session, the US dollar weakened against a basket of currency majors. The US dollar index (#DX) closed in the negative zone (-0.31%). The greenback demand has declined before Fed Chairman Jerome Powell’s speech. Financial market participants are worried that the US may introduce negative interest rates in the future. Yesterday, US President Donald Trump called on the Fed to cut rates to negative values.

The New Zealand dollar has collapsed sharply during the Asian trading session. The Reserve Bank of New Zealand decided on a key interest rate and left it unchanged at 0.25%. At the same time, the regulator doubled the volume of bonds to be purchased as part of the quantitative easing program and announced a possible transition to negative interest rates amid the economic consequences of coronavirus. So far, rates will remain at the current level, but their reduction is quite likely.

The “black gold” prices are consolidating. At the moment, futures for the WTI crude oil are testing the $25.25 mark per barrel. At 17:30 (GMT+03:00), the US crude oil inventories will be published.

Market indicators

Yesterday, there was the bearish sentiment in the US stock market: #SPY (-1.99%), #DIA (-1.85%), #QQQ (-2.09%).

The 10-year US government bonds yield has fallen again. At the moment, the indicator is at the level of 0.66-0.67%.

The news feed on 2020.05.13:
  • – UK GDP data at 09:00 (GMT+03:00);
  • – UK manufacturing production at 09:00 (GMT+03:00);
  • – Producer price index in the US at 15:30 (GMT+03:00).

by JustForex

Gold traders to focus on Powell’s testimony on Wednesday

By Admiral Markets

Source: Economic Events May 13, 2020 – Admiral Markets’ Forex Calendar

Gold has generally been stable over the last days, trading around 1,700 USD.

That may surprise, given the fact that US economic data sets from the labour market came in at “catastrophic” levels with the ADP printing at -20.2 million, and Friday’s NFP’s at -20.5 million, which shows how much of the bad economic data seems to have been already priced into the markets.

On Wednesday, the main focus will probably be on the testimony from Fed chairman Powell in front of the US congress, regarding the economic impact and how any developments after the lockdown are to be lifted.

In fact, given the already massive monetary and fiscal stimulus from the US government, and the Fed’s fight against the economic impact of the lockdown, the comments from Powell need to point to a significantly weaker than already anticipated picture to trigger higher volatility in financial markets, especially Gold.

Still, a new sharper leg up stays a serious option, bringing the region around 1,750 USD back into focus in the days to come.

On the other hand the bearish divergence in the RSI(14) on a daily time-frame (orange) is still a topic and would be confirmed with a break below 1,660 USD, making a deeper corrective move as low as 1,630/35 USD possible.

Source: Admiral Markets MT5 with MT5-SE Add-on Gold Daily chart (between February 11, 2019, to May 12, 2020). Accessed: May 12, 2020, at 10:00pm GMT – Please note: Past performance is not a reliable indicator of future results, or future performance.

In 2015, the value of Gold fell by 10.4%, in 2016, it increased by 8.1%, in 2017, it increased by 13.1%, in 2018, it fell by 1.6%, in 2019, it increased by 18.9%, meaning that after five years, it was up by 28%.

Discover the world’s #1 multi-asset platform

Admiral Markets offers professional traders the ability to trade with a custom, upgraded version of MetaTrader 5, allowing you to experience trading at a significantly higher, more rewarding level. Experience benefits such as the addition of the Market Heat Map, so you can compare various currency pairs to see which ones might be lucrative investments, access real-time trading data, and so much more. Click the banner below to start your FREE download of MT5 Supreme Edition!

Download MetaTrader 5 and begin trading today!

Disclaimer: The given data provides additional information regarding all analysis, estimates, prognosis, forecasts or other similar assessments or information (hereinafter “Analysis”) published on the website of Admiral Markets. Before making any investment decisions please pay close attention to the following:

  1. This is a marketing communication. The analysis is published for informative purposes only and are in no way to be construed as investment advice or recommendation. It has not been prepared in accordance with legal requirements designed to promote the independence of investment research, and that it is not subject to any prohibition on dealing ahead of the dissemination of investment research.
  2. Any investment decision is made by each client alone whereas Admiral Markets shall not be responsible for any loss or damage arising from any such decision, whether or not based on the Analysis.
  3. Each of the Analysis is prepared by an independent analyst (Jens Klatt, Professional Trader and Analyst, hereinafter “Author”) based on the Author’s personal estimations.
  4. To ensure that the interests of the clients would be protected and objectivity of the Analysis would not be damaged Admiral Markets has established relevant internal procedures for prevention and management of conflicts of interest.
  5. Whilst every reasonable effort is taken to ensure that all sources of the Analysis are reliable and that all information is presented, as much as possible, in an understandable, timely, precise and complete manner, Admiral Markets does not guarantee the accuracy or completeness of any information contained within the Analysis. The presented figures refer that refer to any past performance is not a reliable indicator of future results.
  6. The contents of the Analysis should not be construed as an express or implied promise, guarantee or implication by Admiral Markets that the client shall profit from the strategies therein or that losses in connection therewith may or shall be limited.
  7. Any kind of previous or modeled performance of financial instruments indicated within the Publication should not be construed as an express or implied promise, guarantee or implication by Admiral Markets for any future performance. The value of the financial instrument may both increase and decrease and the preservation of the asset value is not guaranteed.
  8. The projections included in the Analysis may be subject to additional fees, taxes or other charges, depending on the subject of the Publication. The price list applicable to the services provided by Admiral Markets is publicly available from the website of Admiral Markets.

Leveraged products (including contracts for difference) are speculative in nature and may result in losses or profit. Before you start trading, you should make sure that you understand all the risks

By Admiral Markets