Author Archive for InvestMacro – Page 39

The Analytical Overview of the Main Currency Pairs on 2020.05.21

by JustForex

The EUR/USD currency pair

Technical indicators of the currency pair:
  • Prev Open: 1.09231
  • Open: 1.09794
  • % chg. over the last day: +0.51
  • Day’s range: 1.09523 – 1.09818
  • 52 wk range: 1.0777 – 1.1494

The single currency has continued to grow against the greenback. EUR/USD quotes have set new local highs. Investors assess the FOMC meeting minutes. The regulator plans to keep rates near zero until there is confidence in a stable recovery in the US economy. At the moment, the EUR/USD currency pair is consolidating in the range of 1.0950-1.0990. A trading instrument has the potential for further growth. We expect important economic releases from Germany, the Eurozone and the US. We recommend opening positions from key levels.

News background on 2020.05.21:
  • – A number of indicators on economic activity in Germany and the Eurozone at 10:30 (GMT+3:00) and 11:00 (GMT+3:00), respectively;
  • – Initial jobless claims in the US at 15:30 (GMT+3:00);
  • – Philadelphia Fed manufacturing index at 15:30 (GMT+3:00);
  • – Existing home sales in the US at 17:00 (GMT+3:00).

We also recommend paying attention to speeches by the Fed Chairman and the FOMC representatives.

EUR/USD

Indicators signal the power of buyers: the price has fixed above 50 MA and 100 MA.

The MACD histogram is in the positive zone, but below the signal line, which gives a weak signal to buy EUR/USD.

Stochastic Oscillator is in the neutral zone, the %K line is above the %D line, which indicates the bullish sentiment.

Trading recommendations
  • Support levels: 1.0950, 1.0920, 1.0900
  • Resistance levels: 1.0990, 1.1030, 1.1060

If the price fixes above 1.0990, further growth of EUR/USD quotes is expected. The movement is tending to 1.1030-1.1050.

An alternative could be a drop in EUR/USD quotes to 1.0920-1.0900.

The GBP/USD currency pair

Technical indicators of the currency pair:
  • Prev Open: 1.22539
  • Open: 1.22340
  • % chg. over the last day: -0.10
  • Day’s range: 1.21856 – 1.22439
  • 52 wk range: 1.1466 – 1.3516

The technical pattern is still ambiguous on the GBP/USD currency pair. The British pound continues to consolidate. At the moment, the local support and resistance levels are: 1.2175 and 1.2225, respectively. Financial market participants expect additional drivers. Today, investors will assess important statistics on the UK and US economies. We recommend opening positions from key levels.

At 11:30 (GMT+3:00), a number of indicators on economic activity will be published in the UK.

GBP/USD

Indicators do not give accurate signals: 50 MA has crossed 100 MA.

The MACD histogram is in the negative zone, which gives a signal to sell GBP/USD.

Stochastic Oscillator is in the neutral zone, the %K line is above the %D line, which indicates the bullish sentiment.

Trading recommendations
  • Support levels: 1.2175, 1.2135, 1.2075
  • Resistance levels: 1.2225, 1.2280, 1.2325

If the price fixes above 1.2225, GBP/USD quotes are expected to rise. The movement is tending to 1.2270-1.2300.

An alternative could be a decrease in the GBP/USD currency pair to 1.2140-1.2100.

The USD/CAD currency pair

Technical indicators of the currency pair:
  • Prev Open: 1.39402
  • Open: 1.39005
  • % chg. over the last day: -0.29
  • Day’s range: 1.38985 – 1.39468
  • 52 wk range: 1.2949 – 1.4668

The USD/CAD currency pair is still being traded in a flat. There is no defined trend. The local support and resistance levels are: 1.3910 and 1.3960, respectively. The loonie is supported by the recovery of oil quotes. We expect important economic releases from the US. The USD/CAD currency pair has the potential for further decline. Positions should be opened from key levels.

The news feed on Canada’s economy is calm.

USD/CAD

Indicators do not give accurate signals: the price has crossed 50 MA.

The MACD histogram is near the 0 mark.

Stochastic Oscillator is in the neutral zone, the %K line is below the %D line, which indicates the bearish sentiment.

Trading recommendations
  • Support levels: 1.3910, 1.3870
  • Resistance levels: 1.3960, 1.4020, 1.4065

If the price fixes below the support level of 1.3910, a further drop in USD/CAD quotes is expected. The movement is tending to 1.3870-1.3850.

An alternative could be the growth of the USD/CAD currency pair to 1.4000-1.4030.

The USD/JPY currency pair

Technical indicators of the currency pair:
  • Prev Open: 107.699
  • Open: 107.473
  • % chg. over the last day: -0.17
  • Day’s range: 107.473 – 107.848
  • 52 wk range: 101.19 – 112.41

There is an ambiguous technical pattern on the USD/JPY currency pair. The trading instrument is in a sideways trend. There is no defined trend. At the moment, the local support and resistance levels are: 107.55 and 107.85, respectively. Financial market participants expect additional drivers. We recommend paying attention to the dynamics of US government bonds yield. Positions should be opened from key levels.

Japan published weak trade balance data.

USD/JPY

Indicators do not give accurate signals: the price is consolidating near 50 MA.

The MACD histogram is near the 0 mark.

Stochastic Oscillator is in the neutral zone, the %K line has started crossing the %D line. There are no signals at the moment.

Trading recommendations
  • Support levels: 107.55, 107.35, 107.10
  • Resistance levels: 107.85, 108.05

If the price fixes above 107.85, further growth of USD/JPY quotes is expected. The movement is tending to 108.10-108.30.

An alternative could be a decrease in the USD/JPY currency pair to 107.35-107.10.

by JustForex

China’s ‘Two Sessions’ herald rebound of economy

By Dan Steinbock

– As the coronavirus fallout is spreading in Western economies, China’s rebound has begun. Global recovery requires global cooperation, however.

Today, international interest in the annual Two Sessions of China’s top legislative and political advisory bodies – National People’s Congress, and Chinese People’s Political Consultative Conference – which starts on Thursday, is exceptionally high.

Due to the global pandemic, the Sessions take place under strong anti-epidemic measures, including social distancing, and will be significantly shorter and rely more on videoconferences. Such measures are in line with the science-based health policies, which the central government adopted in late January.

Apart from their sociopolitical significance, the Two Sessions herald the rebounding of the Chinese economy, even amid the global pandemic.

From virus containment to economic rebound

In China, big business has operated with near full capacity since mid-April. Factories and energy plants are humming. Stores are reopening.

Of course, there’s no immediate return to the pre-virus world. Yet China’s new normal differs dramatically from that in the US and Euro area, thanks to proactive governance and science-based policies to contain the virus outbreak.

In China, the rebound of the economy began in March-April. In the US and Europe, it could ensue more broadly only after the 2nd quarter. But even those hopes could be undermined by premature exits from the lockdown, new virus waves and residual clusters.

In the 1st quarter, China’s growth shrank 6.8 percent. However, the rebound could raise the 2nd quarter data close to 4 percent, while the 3rd and 4th quarter could prove close to 5 and 6 percent, respectively. That would leave the 2020 result at 2 percent, as the IMF has predicted.

Assuming peaceful international conditions, faster rebound could improve the outcome, however. Despite the dire international horizon, China’s economy has potential for an upside surprise.

More fiscal expansion and faster response to crises

This year marks the last one of the 13th five-year (2016-20) period. But, even if China could see a V-shaped recovery, can the country deliver its promises of improving living standard, eradicating abject poverty and environmental sustainability?

Here’s the short answer: It’s a precarious balancing act. More fiscal expansion is needed to support the economy, while improved reporting systems are likely to be implemented to prevent future public-health emergencies.

Long-term objectives – doubling living standards, eradicating poverty and reducing pollutants – will prevail but they can be effectively executed only after the pandemic is fully contained worldwide. Ironically, the past months’ economic slump has translated to a dramatic, though temporary fall in emissions.

The greatest challenge in the coming months will be to overcome the current misalignment between supply and demand. During the 2nd quarter, the supply-side performance has rapidly improved as economic capacity is almost back to normal and industrial production is up. Last month, even the export sector’s performance was strong. The government’s strong back-to-work push is paying off.

Demand-side story harder, likely more challenging for West

The demand-side will take more time. In the months of strict quarantine measures, e-commerce sales took off dramatically as people resorted to online shopping. Retail and shopping malls, clothing and cosmetics and other consumption-led sectors will take longer to normalize.

In the West, the demand-side story will prove even more challenging, due to greater virus impact and longer delays in the return to full employment.

As long as a vaccine against the virus and effective therapies are not available, uncertainty will constrain private investment. But in China, that has been offset by government-led infrastructure investment, which is likely to remain a key growth driver until full stabilization.

Fiscal policies are likely to be strengthened, with expected measures such as raising the fiscal deficit rate to 5 percent of GDP and issuing more than $420 billion (3 trillion yuan) in special treasury bonds to boost fiscal funding.

In turn, fiscal accommodation is likely to be supported with easing of monetary and credit policy. In the past four months, newly increased social financing and loans have seen new highs. The demand for financing is recovering as production has resumed. That’s vital for improved employment during these challenging times.

International landscape key to longer-term future

In China, the worst economic damage may be behind; in the US and Euro area it’s still ahead. Despite the challenging 1st quarter, this damage is unlikely to penalize China’s strong long-term economic fundamentals. In the West, the fallout of the outbreak is likely to prove more protracted.

In the 1st quarter, US GDP growth fell to -4.8 percent; but the 2nd quarter, it could plunge close to a whopping -40 percent, according to recent US reports. In the Euro area, growth fell to -3.8 percent in the 1st quarter but that’s only a prelude to the expected double-digit plunge in the 2nd quarter.

Since such economic outcomes can be attributed to the mishandling of COVID-19 risks, they are likely to result in political tsunamis in the West in the coming months.

In light of the global economic outlook, the key question is whether the coronavirus lessons will foster international cooperation, which is the only way out, or result in global conflicts scenarios, which would further weaken external demand.

Responsive and responsible governments would delay and prolong the current trade-truce schedules. Yet, the Trump administration is neither. The White House’s misguided trade war and COVID-19 mishandling has already caused US debt to soar record-fast to $25.3 trillion.

As US federal debt to GDP ratio is now close to 120 percent – at par with that of Italy amid its debt crisis in 2011-12 – such leverage, which the White House and the Fed will have to further increase, could prove costly to global economy.

About the Author:

Dr. Dan Steinbock is an internationally recognized strategist of the multipolar world and the founder of Difference Group. He has served at the India, China and America Institute (USA), Shanghai Institutes for International Studies (China) and the EU Center (Singapore). For more, see https://www.differencegroup.net 

A version of the commentary was published by China Daily on May 20, 2020


Fibonacci Retracements Analysis 20.05.2020 (GBPUSD, EURJPY)

Article By RoboForex.com

GBPUSD, “Great Britain Pound vs US Dollar”

As we see in the H4 chart, after breaking 38.2% fibo, the descending correctional wave has failed to reach 50.0% fibo at 1.2030. The current growth may be considered as a new correction. Possibly, the pair may form another descending wave towards 50.0% and 61.8% fibo at 1.2030 and 1.1881 respectively. After completing this correction, the price is expected to start a new rising wave to reach the high at 1.2648.

GBPUSD_H4
Risk Warning: the result of previous trading operations do not guarantee the same results in the future

The H1 chart shows a new ascending correction after the convergence on MACD, which has already reached 38.2%. In the nearest future, the pair may form a slight pullback, after which the instrument may continue growing towards 50.0% and 61.8% fibo at 1.2357 and 1.2424 respectively. the support is the low at 1.2072.

GBPUSD_H1
Risk Warning: the result of previous trading operations do not guarantee the same results in the future

EURJPY, “Euro vs. Japanese Yen”

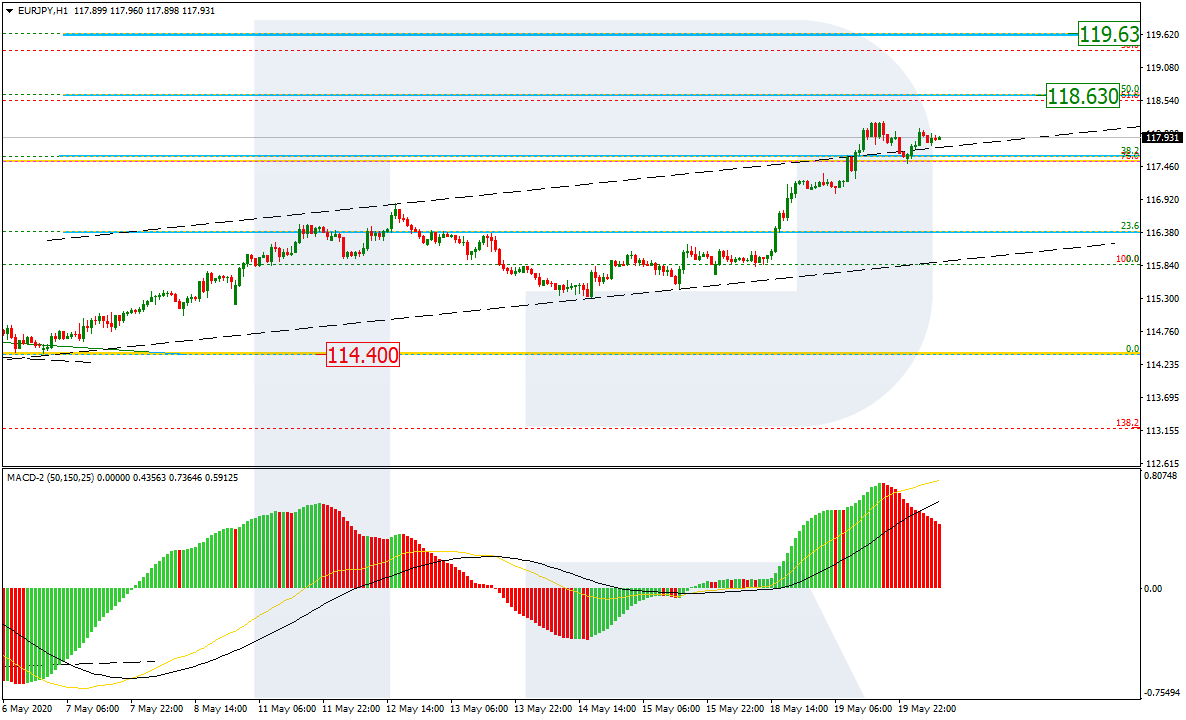
As we can see in the H4 chart, EURJPY broke the resistance at 117.54, which may indicate the mid-term trend reversal. Another signal in favor of a new rising movement was a convergence on MACD. The current growth may be considered as an ascending correction. The price has already reached 38.2% fibo and may later continue moving towards 50.0% and 61.8% fibo at 118.63 and 119.63 respectively. The support is the low at 114.40.

EURJPY_H4
Risk Warning: the result of previous trading operations do not guarantee the same results in the future

The H1 chart shows more detailed structure of the current ascending tendency after the convergence on MACD. After reaching 38.2% fibo, the pair is trying to fix above it for further stable growth.

EURJPY_H1

Article By RoboForex.com

Attention!
Forecasts presented in this section only reflect the author’s private opinion and should not be considered as guidance for trading. RoboForex LP bears no responsibility for trading results based on trading recommendations described in these analytical reviews.

The US Dollar Continues to Decline. FOMC Meeting Minutes Are in the Spotlight

by JustForex

The US currency has continued to decline. The US dollar index (#DX) closed again in the negative zone (-0.32%). Investor sentiment has worsened after comments by Fed Chairman, Jerome Powell, which were rather pessimistic. According to the official, additional assistance from the state will be required to restore the economy, and unemployment will affect the economy for many years to come.

Also, the effectiveness of the Moderna COVID-19 vaccine has been called into question. The STAT medical news website released a report according to which Moderna provided insufficient data to determine the effectiveness of the vaccine.

The demand for a single currency is supported by optimism about the French-German initiative to restore the European economy after the crisis caused by COVID-19. It should be recalled that countries want to create a €500bn fund. Today, investors will assess the FOMC meeting minutes, which may have a significant impact on the dynamics of currency majors.

The “black gold” prices are rising. Currently, futures for the WTI crude oil are testing the $32.10 mark per barrel. The US crude oil inventories will be published at 17:30.

Market indicators

Yesterday, there was the bearish sentiment in the US stock market: #SPY (-1.03%), #DIA (-1.51%), #QQQ (-0.25%).

The 10-year US government bonds yield has declined. At the moment, the indicator is at the level of 0.69-0.70%.

The news feed on 2020.05.20:
  • – UK consumer price index at 09:00 (GMT+3:00);
    – Eurozone consumer price index at 12:00 (GMT+3:00);
    – Data on inflation in Canada at 15:30 (GMT+3:00);
    – FOMC meeting minutes at 21:00 (GMT+3:00).

by JustForex

Forex Technical Analysis & Forecast 20.05.2020

Article By RoboForex.com

EURUSD, “Euro vs US Dollar”

After completing the descending impulse at 1.0918, EURUSD is correcting towards 1.0946. Possibly, today the pair may reach this level and then form a new descending structure to break 1.0909. Later, the market may continue trading inside the downtrend with the short-term target at 1.0870.

EURUSD
Risk Warning: the result of previous trading operations do not guarantee the same results in the future

GBPUSD, “Great Britain Pound vs US Dollar”

After finishing the descending impulse at 1.2235, GBPUSD has completed the correction towards 1.2275. Today, the pair may start another decline to break 1.2222 and then continue trading downwards with the short-term target at 1.2184.

GBPUSD
Risk Warning: the result of previous trading operations do not guarantee the same results in the future

USDRUB, “US Dollar vs Russian Ruble”

USDRUB continues falling towards 72.00. Possibly, the pair may reach it and then start another correction towards 73.00. Later, the market may resume trading inside the downtrend with the target at 71.30.

USDRUB
Risk Warning: the result of previous trading operations do not guarantee the same results in the future

USDJPY, “US Dollar vs Japanese Yen”

After finishing the descending impulse at 107.62 along with the correction towards 107.93, USDJPY is expected to fall and break 107.52. After that, the instrument may continue falling with the short-term target at 107.08.

USDJPY
Risk Warning: the result of previous trading operations do not guarantee the same results in the future

USDCHF, “US Dollar vs Swiss Franc”

USDCHF is falling towards 0.9696. Possibly, the pair may reach this level and then start a new growth towards 0.9715, thus forming a new consolidation range between these two levels. If later the price breaks this range to the upside, the market may resume trading upwards with the target at 0.9750.

USDCHF
Risk Warning: the result of previous trading operations do not guarantee the same results in the future

AUDUSD, “Australian Dollar vs US Dollar”

After completing the descending impulse at 0.6525 along with the correction towards 0.6555, AUDUSD is expected to form one more descending impulse to break 0.6520. Later, the market may continue trading inside the downtrend with the short-term target at 0.6494.

AUDUSD
Risk Warning: the result of previous trading operations do not guarantee the same results in the future

BRENT

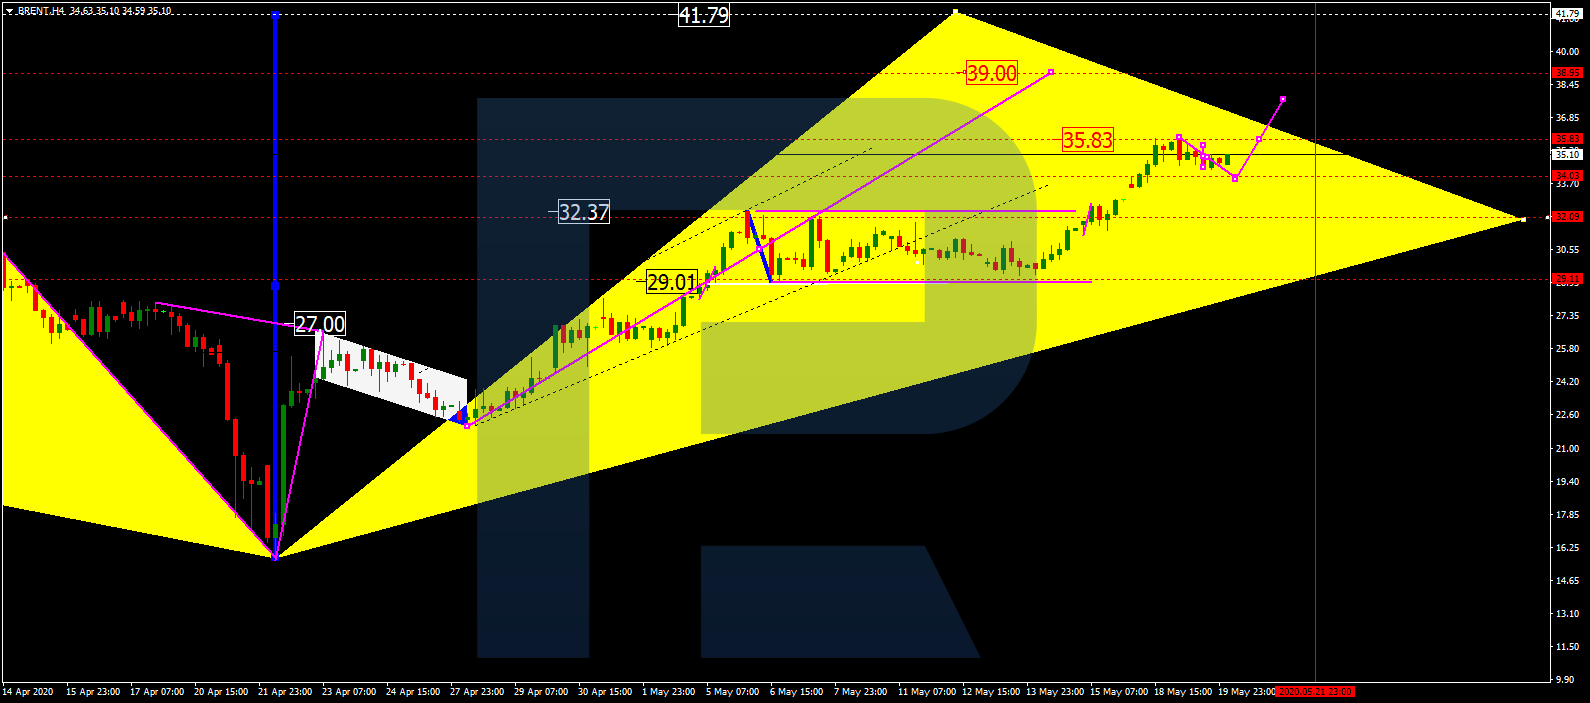
Brent is still consolidating around 35.00. Possibly, the pair may fall towards 34.00. If later the price breaks this range to the upside, the market may resume trading upwards to reach 39.00; if to the downside – start another correction with the target at 32.00.

BRENT
Risk Warning: the result of previous trading operations do not guarantee the same results in the future

XAUUSD, “Gold vs US Dollar”

After breaking 1740.20, Gold has reached 1750.00. Possibly, today the pair may start another correction to return to 1740.20 and test it from below. After that, the instrument may form one more ascending structure with the target at 1755.00.

GOLD
Risk Warning: the result of previous trading operations do not guarantee the same results in the future

BTCUSD, “Bitcoin vs US Dollar”

BTCUSD is consolidating in the center of the range around 9600.00. Possibly, the pair may fall towards 9400.00 and then continue trading upwards with the target at 10150.00.

BITCOIN
Risk Warning: the result of previous trading operations do not guarantee the same results in the future

S&P 500

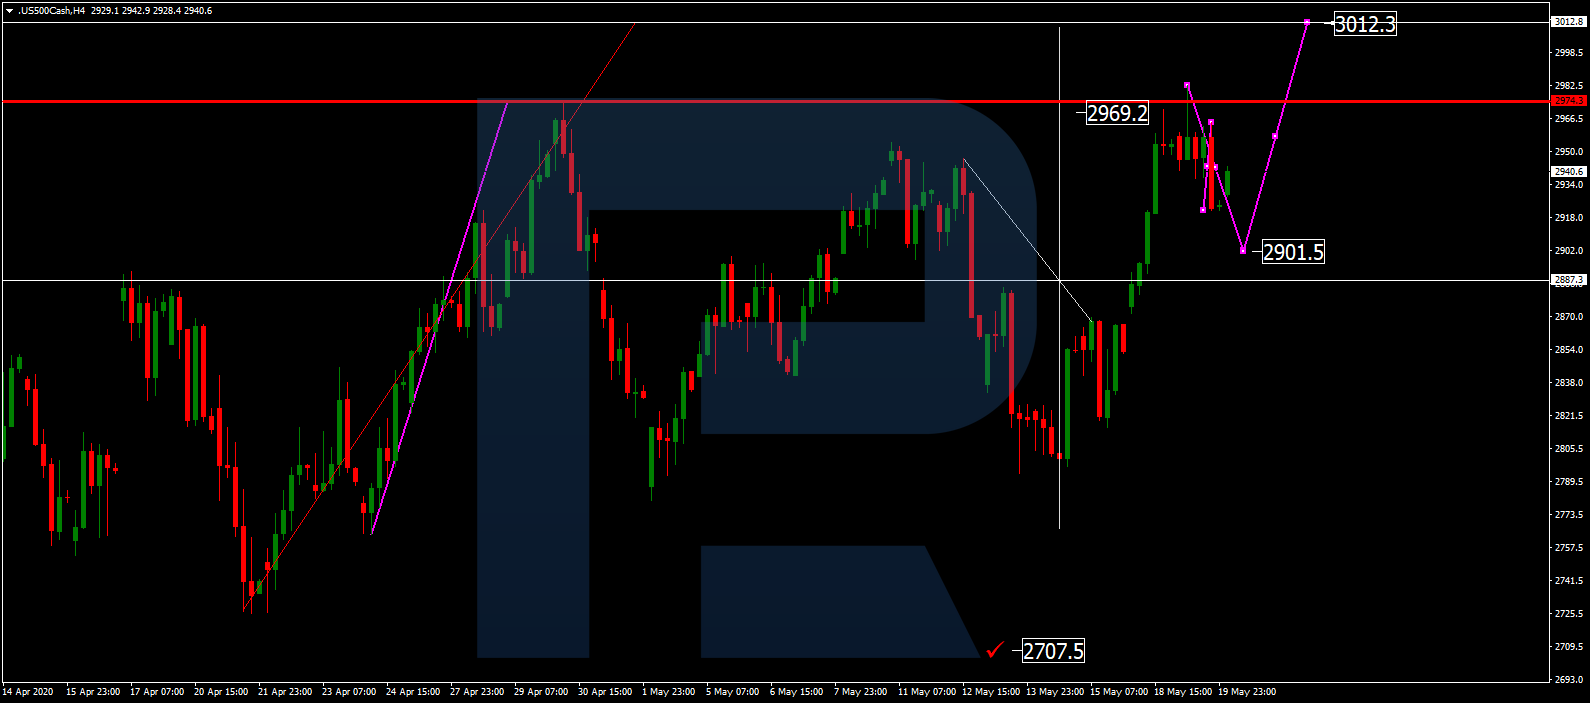
The Index is correcting towards 2901.5. Later, the market may form one more ascending structure with the target at 3012.3.

S&P 500

Article By RoboForex.com

Attention!
Forecasts presented in this section only reflect the author’s private opinion and should not be considered as guidance for trading. RoboForex LP bears no responsibility for trading results based on trading recommendations described in these analytical reviews.

The Analytical Overview of the Main Currency Pairs on 2020.05.20

by JustForex

The EUR/USD currency pair

Technical indicators of the currency pair:
  • Prev Open: 1.09169
  • Open: 1.09231
  • % chg. over the last day: +0.09
  • Day’s range: 1.09187 – 1.09601
  • 52 wk range: 1.0777 – 1.1494

The EUR/USD currency pair has become stable after a sharp increase since the beginning of this week. The news that France and Germany have taken a joint initiative to create a €500bn EU rescue fund supports the euro. Currently, EUR/USD quotes are consolidating. The key range is 1.0920-1.0970. Today, investors will assess the FOMC meeting minutes, which may have a significant impact on the dynamics of currency majors. We recommend opening positions from key levels.

The Economic News Feed for 20.05.2020
  • – Consumer price index in the Eurozone at 12:00 (GMT+3:00);
  • – FOMC meeting minutes at 21:00 (GMT+3:00).
EUR/USD

Indicators signal the power of buyers: the price has fixed above 50 MA and 100 MA.

The MACD histogram is in the positive zone, indicating the bullish sentiment.

Stochastic Oscillator is in the neutral zone, the %K line is below the %D line, which gives a signal to sell EUR/USD.

Trading recommendations
  • Support levels: 1.0920, 1.0900, 1.0875
  • Resistance levels: 1.0970, 1.1000

If the price fixes above 1.0970, further growth of the EUR/USD currency pair is expected. The movement is tending to 1.1000-1.1030.

An alternative could be a drop in EUR/USD quotes to 1.0900-1.0870.

The GBP/USD currency pair

Technical indicators of the currency pair:
  • Prev Open: 1.21932
  • Open: 1.22539
  • % chg. over the last day: +0.49
  • Day’s range: 1.22213 – 1.22764
  • 52 wk range: 1.1466 – 1.3516

GBP/USD quotes are consolidating. The technical pattern is ambiguous. The British pound is testing local support and resistance levels: 1.2215 and 1.2280, respectively. Financial market participants have taken a wait-and-see attitude before the publication of the FOMC meeting minutes. The GBP/USD currency pair has the potential for further growth. We recommend opening positions from key levels.

In April, the UK consumer price index slowed down and counted to 0.8% (y/y). Market expectations were at 0.9%.

GBP/USD

Indicators do not give accurate signals: the price has crossed 50 MA and 100 MA.

The MACD histogram is in the positive zone, but below the signal line, which gives a weak signal to buy GBP/USD.

Stochastic Oscillator is in the neutral zone, the %K line is below the %D line, which indicates the bearish sentiment.

Trading recommendations
  • Support levels: 1.2215, 1.2175, 1.2135
  • Resistance levels: 1.2280, 1.2325, 1.2375

If the price fixes above 1.2280, further growth of GBP/USD quotes is expected. The movement is tending to 1.2320-1.2340.

An alternative could be a decrease in the GBP/USD currency pair to 1.2175-1.2140.

The USD/CAD currency pair

Technical indicators of the currency pair:
  • Prev Open: 1.39377
  • Open: 1.39402
  • % chg. over the last day: +0.05
  • Day’s range: 1.39169 – 1.39606
  • 52 wk range: 1.2949 – 1.4668

The USD/CAD currency pair has become stable after a sharp fall. The loonie is currently consolidating. The local support and resistance levels are: 1.3910 and 1.3960, respectively. We expect important economic releases from Canada and the US. The Canadian dollar has the potential for further growth against the US currency. We recommend paying attention to the dynamics of oil quotes. Positions should be opened from key levels.

At 15:30 (GMT+3:00), a report on inflation will be published in Canada.

USD/CAD

Indicators do not give accurate signals: the price is testing 50 MA.

The MACD histogram is near the 0 mark.

Stochastic Oscillator is in the neutral zone, the %K line has crossed the %D line. There are no signals at the moment.

Trading recommendations
  • Support levels: 1.3910, 1.3870
  • Resistance levels: 1.3960, 1.4020, 1.4065

If the price fixes below the support level of 1.3910, a further drop in USD/CAD quotes is expected. The movement is tending to 1.3870-1.3850.

An alternative could be the growth of the USD/CAD currency pair to 1.4000-1.4030.

The USD/JPY currency pair

Technical indicators of the currency pair:
  • Prev Open: 107.282
  • Open: 107.699
  • % chg. over the last day: +0.49
  • Day’s range: 107.625 – 107.983
  • 52 wk range: 101.19 – 112.41

The USD/JPY currency pair has been growing after a prolonged consolidation. The trading instrument has set new monthly highs. At the moment, USD/JPY quotes are consolidating. The key range is 107.60-108.00. We expect the publication of the FOMC meeting minutes. We also recommend paying attention to the dynamics of US government bonds yield. Positions should be opened from key levels.

The news feed on Japan’s economy is calm.

USD/JPY

Indicators signal the power of buyers: the price has fixed above 50 MA and 100 MA.

The MACD histogram is in the positive zone, indicating the bullish sentiment.

Stochastic Oscillator is in the neutral zone, the %K line has crossed the %D line. There are no signals at the moment.

Trading recommendations
  • Support levels: 107.60, 107.30, 107.05
  • Resistance levels: 108.00, 108.40

If the price fixes above the round level of 108.00, further growth of USD/JPY quotes is expected. The movement is tending to 108.40-108.60.

An alternative could be a decrease in the USD/JPY currency pair to 107.30-107.00.

by JustForex

Gold, Silver, Miners Teater On The Brink Of A Breakout

By TheTechnicalTraders 

– This week has been a wild and emotional one and it’s just started!

With Monday’s big pop in the stock indexes, the big rally was based on vaccine news and bullish comments from the fed, convincing most traders and investors to be overly bullish this week.

My volume flow indicator showed a reading of 10 all day yesterday, which means ten shares were being bought on the NYSE at the ask, to everyone share being sold at the bid. Any reading over 3 is considered bearish short term, so ten was extreme. After the pop on Monday, stocks/indices closed lower by 1-2% on the session respectively the following session.

I have reiterated over and over, big moves (and gaps) in the price in the stock indexes that occur from the news are generally given back within a few days. This is still what I feel is going to happen in the coming days, albeit the last hour on Tuesday may have started that retracement.

The saying in the trader’s world is that novice traders typically trade at the open and experienced players trade at the close. This continues to hold true. The chart below shows you what the BIG money payers are doing, which is selling/distributing shares to the masses, evidenced by the volume in the final hour. It is this theory why we always base our new trades to have their stop loss triggered on the closing price, and not intraday swings. Utilizing this strategy has saved many trades over the years from being stopped out, and subsequently to turn into profitable winners. It is where the price closes that counts.

Precious Metals & Gold Miners

Metals and miners have been coming to life. In February, we sold our GDXJ position at the opening bell on the high of the day to lock in gains. We saw weakness in the market and took action to avoid any temporary selling, which ended up turning into a 57% market collapse. Tuesday for the first time, GDXJ is trading back to where we sold it for a nice profit with our Swing Trading ETF Trading service, and I’m getting excited again for this group of stocks.

Junior Gold Stocks (GDXJ) Close To Breakout

The Junior gold stocks (GDXJ) is showing signs that they are headed to test the major breakout level of this 8-year base. The price still has to run a little higher, and it could be met with some strong selling once touched. Be aware that junior gold miners are not in the clear, just yet. Once they clear resistance they are a long-term investment position.

Large-Cap Gold Miners (GDX) Already Broke Out

If you take a closer look at the large-cap gold miners (GDX), they have already broken out and started to rally. This is a new bull market for this particular group of stocks. We got long this new bull market a few weeks ago in my Technical Investor Portfolio which focused on long term position with a much wider stop loss than swing trading positions.

Gold Bullion in Full Blown Bull Market

Gold also broke out and started a new bull market mid last year. We are also long gold in our Technical Investor portfolio as well. Gold has completed its initial move but is on the verge of popping to the $2000 market if we get just the right market conditions over the next couple of months.

We are in what many consider unprecedented times for businesses and survival. As a long-time trader, I consider these exciting stages for stocks, and commodities. Lots of things are happening and they will be erratic and volatile I expect. How the world functions are changing more rapidly than many of us realize.

The last ten years of investing in stocks have been incredible. We all experienced a Super Cycle Bull Market, and those invested in stocks and who also bought homes early have made a fortune with very little effort. But I fear this may be coming to an end sooner than most people think and feel.

The fundamentals for stocks no longer make any sense with earnings way down and still falling. The Fed is printing money faster than at any time in history as well as paying everyone and everything to keep the lights on and the music playing. They could certainly keep things going for a while and drive the markets higher with loose money policies and prop everything up (including lower-rated corporate bonds).

Can the Fed and other central banks support the global economy? Remember, it’s not just North America under pressure, but every other country and nearly everyone and their business are enduring financial stress.

The bottom line is that no matter which way the markets go, we will be positioned on the right side with technical analysis and sound advice as to what actions, if any, to take. And both active trading and long-term investment portfolio positions are more critical now than they have been in the last ten years. The days of just buying every dip and holding will be over in a couple of months.

So far it has been a crazy, unprecedented period. Add to that, over 1,000,000 new trading accounts opened this year and many new novice traders who have entered the markets.   These people are frantically buying up stocks thinking they are going to make a lot of money. We believe they are going to have a very rude awakening when/if the bear market takes hold over the next 3-8 months.

Trading this year has been slow for our subscribers but our trading accounts continue to make new high watermark levels every couple weeks, and that is all that matters. The market crash shook things up, and during an unexpected crisis the best play, in our opinion, was to step back and cherry-pick only low-risk trades until price action returns to some normal level, which the market is finally beginning to do.

However slow, I am proud that we did not take any undue risk and that our model account has remained positive throughout 2020 and we are up when most other services, including the best hedge funds in the world, have negative returns thus far this year.

My staff and I are always scouring for new trading opportunities.  Right now, the XLF ETF, which is the financial sector, is breaking down and may present a short opportunity.  As you know, we also like silver, gold, and both the junior and large-cap miners, but we will first wait to see if this wave of buying is met with sellers in the near future.  Until then, we will keep you posted.

The next few years are going to be full of incredible opportunities for skilled traders and investors.  Huge price swings, incredible revaluation events, and, eventually, an incredible upside rally will start again.

I’ve been trading since 1997 and I’ve lived through numerous market events.  The one thing I teach my members is that risk is always a big part of trading and that’s why I structure all of my research and trading signals around “finding profits while reducing overall risks”.  Sure, there are fast profits to be made in these wild market swings, but those types of trades are extremely risky for most people – and I don’t know of anyone that wants to risk 50 or 60% of their assets on a few wild trades.

I’m offering you the chance to learn to profit, as I do with my own money, from market trends that I hand-pick for my own trading.  These are not wild, crazy trades – these are simple, effective, and slower types of trades that consistently build wealth.  I issue about 4 to 8+ trades a month for my members and adjust trade allocation based on my proprietary allocation strategy– the objective is to gain profits while managing overall risks.

You don’t have to spend days or weeks trying to learn my system.  You don’t have to try to learn to make these decisions on your own or follow the markets 24/7 – I do that for you.  All you have to do is follow my research and trading signals and start benefiting from my research and trades.  My new mobile app makes it simple – download the app, sign in and everything is delivered to your phone, tablet, or desktop.

I offer membership services for active traders, long-term investors, and wealth/asset managers.  Each of these services is driven by my own experience and my proprietary trading systems and modeling systems.  I have a small team of dedicated researchers and developers that do nothing but research and find trading signals for my members.  Our objective is to help you protect and grow your wealth.

Please take a moment to visit TheTechnicalTraders.com to learn more.  I can’t say it any better than this…  I want to help you create success while helping you protect and preserve your wealth – it’s that simple.

Chris Vermeulen
Chief Market Strategist

TheTechnicalTraders.com


Gold with new yearly Highs on Monday – new all-time highs ahead?

By Admiral Markets

Source: Economic Events May 20, 2020 – Admiral Markets’ Forex Calendar

Gold bulls made a clear statement at the start of the week by pushing the precious metal to new yearly highs.

Nevertheless, technically the bearish divergence in the RSI(14) on a daily time-frame is still on the table. So, while the door is open for a stint at the current Gold all-time high around 1,920 USD, Gold bulls still should stay cautious in regards to overly aggressive long engagements, even though from a fundamental perspective, the path higher seems set.

Fundamentally the driver higher can surely be found in the testimony from Fed chairman Powell in front of the US congress already last week on Wednesday.

While his remarks on his assessment of the current US economic situation and the taken measures of the Fed to counter the economic downturn driven by the ‘Corona lockdown’ didn’t surprise, the comments on the Fed not having a plan in regards to negative rates, despite US president Trump’s tweets last Tuesday and the market has priced-in Fed funds going into the negative in the futures market at the beginning of May for the first time ever, were mostly ignored with Gold pushing higher.

In fact, the statement seems clear here: “We expect the Fed to do everything they can and flood markets with trillions of US-Dollar if necessary – and thus push the price of Gold higher.”

Indeed, this expectation was partly confirmed from Powell last Sunday in CBS “60 Minutes” where Powell said, “In the long run, and even in the medium run, you wouldn’t want to bet against the American economy” while acknowledging that the unemployment rate could hit as high as 25%.

If today’s FOMC Minutes are interpreted in this direction as well, even though only between the lines, chances seem good that we already see the current all-time high in Gold get in our focus into the second half of the week.

Technically, the picture stays bullish as long as we trade above 1,660 USD:

Source: Admiral Markets MT5 with MT5-SE Add-on Gold Daily chart (between February 18, 2019, to May 18, 2020). Accessed: May 18, 2020, at 10:00pm GMT – Please note: Past performance is not a reliable indicator of future results, or future performance.

In 2015, the value of Gold fell by 10.4%, in 2016, it increased by 8.1%, in 2017, it increased by 13.1%, in 2018, it fell by 1.6%, in 2019, it increased by 18.9%, meaning that after five years, it was up by 28%.

Discover the world’s #1 multi-asset platform

Admiral Markets offers professional traders the ability to trade with a custom, upgraded version of MetaTrader 5, allowing you to experience trading at a significantly higher, more rewarding level. Experience benefits such as the addition of the Market Heat Map, so you can compare various currency pairs to see which ones might be lucrative investments, access real-time trading data, and so much more. Click the banner below to start your FREE download of MT5 Supreme Edition!

Download MetaTrader 5 and begin trading today!

Disclaimer: The given data provides additional information regarding all analysis, estimates, prognosis, forecasts or other similar assessments or information (hereinafter “Analysis”) published on the website of Admiral Markets. Before making any investment decisions please pay close attention to the following:

  1. This is a marketing communication. The analysis is published for informative purposes only and are in no way to be construed as investment advice or recommendation. It has not been prepared in accordance with legal requirements designed to promote the independence of investment research, and that it is not subject to any prohibition on dealing ahead of the dissemination of investment research.
  2. Any investment decision is made by each client alone whereas Admiral Markets shall not be responsible for any loss or damage arising from any such decision, whether or not based on the Analysis.
  3. Each of the Analysis is prepared by an independent analyst (Jens Klatt, Professional Trader and Analyst, hereinafter “Author”) based on the Author’s personal estimations.
  4. To ensure that the interests of the clients would be protected and objectivity of the Analysis would not be damaged Admiral Markets has established relevant internal procedures for prevention and management of conflicts of interest.
  5. Whilst every reasonable effort is taken to ensure that all sources of the Analysis are reliable and that all information is presented, as much as possible, in an understandable, timely, precise and complete manner, Admiral Markets does not guarantee the accuracy or completeness of any information contained within the Analysis. The presented figures refer that refer to any past performance is not a reliable indicator of future results.
  6. The contents of the Analysis should not be construed as an express or implied promise, guarantee or implication by Admiral Markets that the client shall profit from the strategies therein or that losses in connection therewith may or shall be limited.
  7. Any kind of previous or modeled performance of financial instruments indicated within the Publication should not be construed as an express or implied promise, guarantee or implication by Admiral Markets for any future performance. The value of the financial instrument may both increase and decrease and the preservation of the asset value is not guaranteed.
  8. The projections included in the Analysis may be subject to additional fees, taxes or other charges, depending on the subject of the Publication. The price list applicable to the services provided by Admiral Markets is publicly available from the website of Admiral Markets.

Leveraged products (including contracts for difference) are speculative in nature and may result in losses or profit. Before you start trading, you should make sure that you understand all the risks

By Admiral Markets

An Eye-Opening Perspective: Emerging Markets and Epidemics

By Elliott Wave International

– People across the entire planet remain very much aware of the COVID-19 health threat.

The global disruption associated with the pandemic far surpasses other major health scares in modern history.

Even so, you may recall 2009 news articles similar to this one from the New York Times (June 11, 2009):

It came as no surprise [on June 11, 2009] when the World Health Organization declares that the swine flu outbreak had become a pandemic.

The disease has reached 74 countries … .

And, going further back in time, the World Health Organization provided this July 5, 2003 update on the Severe Acute Respiratory Syndrome, known as SARS:

To date, 8439 people have been affected, and 812 have died from SARS.

The reason for briefly reviewing the swine flu and SARS is to point out that, as surprising as it may be, both outbreaks marked not the start, but the end of a downtrend in emerging markets stocks.

That’s a big reason why, amid the COVID-19 scare, Elliott Wave International’s April 2020 Global Market Perspective, a monthly publication which covers 40+ worldwide financial markets, showed this chart and said:

The dramatic drop has created an enormous [bullish] opportunity in the form of a completed contracting triangle pattern in emerging markets overall, as shown by the Vanguard FTSE Emerging Markets ETF, which is the largest emerging markets ETF by market capitalization.

The current, May Global Market Perspective follows up with this chart of the MSCI Emerging Markets Index. The last quarterly bar shows the substantial jump in prices since the March lows. Our global analyst remarked:

That this [price rise] has begun amid the COVID-19 pandemic only adds to the evidence supporting it: Asian-Pacific and emerging markets also began bull markets amid the SARS epidemic of 2003 and the Swine Flu pandemic of 2009, as the chart shows.

Of course, COVID-19 and past outbreaks didn’t “cause” stock prices to climb. The point — as our Global Market Perspective has said — is that epidemics tend to occur at the end of major sell-offs.

“Tend to” is the key phrase here, of course. There are no guarantees in financial markets. Besides, this outbreak is a full-blown pandemic with social and economic consequences that have already far surpassed anything we saw in 2003 or 2009.

Having said that, emerging markets did rebound, which is something Global Market Perspective subscribers were prepared for, and it’s worth noting. What happens next depends on the Elliott wave patterns in market psychology, which our global analysts are tracking in emerging markets (and developed ones) right now.

You can get free access to analysis from our global market experts in “5 Global Insights You Need to Watch,” which is a short, 5-video series (plus, two quick reads).

You get our latest forecasts for cryptocurrencies, crude oil, interest rates, deflation and the future of the European Union — all in just 13 minutes.

The 5 videos and 2 excerpts are straight from the Global Market Perspective — so yes, this is premium, subscriber-level.

All that’s required to access “5 Global Insights You Need to Watch” is a free, Club EWI membership.

Pound could drop even further – to $1.18 – in June: deVere CEO

By George Prior

The British pound – this month’s worst-performing major currency – could “easily drop to $1.18” at the end of June, warns the CEO of one of the world’s largest independent financial advisory and fintech organizations.

The warnings from deVere Group’s chief executive and founder Nigel Green come as it is revealed that the British currency shed almost 4% against the U.S. dollar in May and 3% against the euro.

Mr Green comments: “The pound is this year’s third-weakest major currency – just behind the New Zealand dollar and Norwegian krone, which have done even worse.

“The pound has been battered since the Brexit referendum in 2016 and the ensuing years of political uncertainty, losing around 20% of its value since the referendum.

“The Covid-19 crisis has been another hammer blow for sterling as it promoted a flight-to-safety and ramped-up the search for liquidity.  This situation is a win for the U.S. dollar and, in turn, a loss for the pound.”

He continues: “There are legitimate concerns that the pound has further to fall in the next few weeks.

“It could easily drop to $1.18 by the end of June due to renewed and heightened fears of a negative shock due to a no-deal Brexit combined with the far-reaching economic fallout of the pandemic.”

Negotiations between the UK and the EU on their post-Brexit future relationship stalled on Friday with the EU’s chief negotiator Michel Barnier saying the two sides risked reaching a “stalemate.”

The British Prime Minister Boris Johnson has repeatedly threatened to walk away from the talks if insufficient progress has been made by next month’s high-level negotiations. The UK has indicated the alternative of an “Australia-style” deal, a relationship where both sides trade on basic World Trade Organization terms, similar to a no-deal Brexit.

“An even weaker pound will help to reduce people’s purchasing power and a drop in UK living standards. Weaker sterling means imports are more expensive, with rising costs being passed on to consumers,” says Mr Green.

“The fall in the pound is good for exports some claim, but it must be remembered that around 50% of UK exports rely on imported components. These will become more expensive as the pound falls in value.

“A low pound is, of course, bad news for British expats, amongst others, who receive income or pensions in sterling.

“The country’s financial services sector – which represents 6% of all economic activity – will also be adversely affected because it is built on foreign investment that puts its faith in sterling being strong.”

The deVere CEO concludes: “The pound will remain volatile, and is likely to become weaker in the next month.

“As such, it can be expected that domestic and international investors in UK assets will be seeking the available international options available to them.”

About:

deVere Group is one of the world’s largest independent advisors of specialist global financial solutions to international, local mass affluent, and high-net-worth clients.  It has a network of more than 70 offices across the world, over 80,000 clients and $12bn under advisement.