Author Archive for InvestMacro – Page 38

Don’t blame COVID-19: Target’s decline is part of a deeper trend

By Jason Pallant, Swinburne University of Technology and Gary Mortimer, Queensland University of Technology

Wesfarmers’ decision to close or rebrand up to 167 of its 284 Target and Target Country stores should not come as too much of a surprise.

The once popular store has been ailing for years, outmanoeuvred by its successful and popular sister business, Kmart.

Up to 75 Target and Target Country stores will be closed, with the balance being converted to Kmart stores.

Its decline is due to a combination of poor market positioning, confusing product strategies, a declining middle class consumer market and too much similarity with Kmart. The impacts of COVID-19 are just the icing on the cake.

Spiralling sales and profit

Wesfarmers acquired both retail chains when it took over the Coles Group in 2007. At the time Target looked the stronger business, and Wesfarmers considered selling all or part of Kmart, or converting stores to the Target brand.

Just as well it decided to invest in Kmart instead.

Since 2012, Target’s profits and sales have deteriorated with Target realising its first loss of A$195 million in 2016.


How Target has performed since then has been obscured by Wesfarmers combining the business into a Department Stores Division including Kmart and Kmart Tyre and Auto Service. Target’s results were thus no longer reported separately.

But Wesfarmers’ 2019 annual report noted its trading performance highlighted “the need for ongoing repositioning to further elevate quality and style, expand its digital capabilities, and differentiate the business from Kmart and other competitors”.

High couture and cheap kettles

One way Target confused shoppers was to offer collaborations with high-end fashion designers like Missoni, Stella McCartney, Dion Lee and Dannii Minogue, alongside $2 kids’ tops and cheap kitchenware.

The move frustrated customers unable to secure designer pieces and disenfranchised “value-seeking” customers. Many voted with their wallets, moving to Kmart.

Wesfarmers’ plans to differentiate Target from Kmart involved focusing on higher quality apparel, soft homewares and toys to compete against more specialty and middle market offerings.

But the middle market is a challenging sector. It is now dominated by “fast fashion” players offering on-trend clothing and home furnishing. The pressures have led to the collapse of other middle market chains.

Wesfarmers was very aware of the risks associated with this strategy.
Its 2017 annual report stated:

“Target’s strategy has been reset and the business is now focused on progressing changes to the operating model to better position the business to grow earnings into the future. This journey will be undertaken in an increasingly competitive apparel and general merchandise environment”.

Death of department stores

The attempted shift in focus to a middle market department store only created more problems.

Department stores worldwide have faced challenging times in recent years. The past year alone has seen department store icons including Barney’s, Debenhams and JCPenney file for bankruptcy or close for good. Closer to home, Harris Scarfe went into receivership in December 2019, while Myer and David Jones have looked to consolidate stores.

Department stores face many challenges from competition and changing consumer behaviour. However, a broader challenge is a declining middle class that has been the cornerstone of the sector’s customer base.

Target’s strategy to move further into the middle market was always doomed for limited success.

Pandemic impacts

Adding to department store woes is the COVID-19 pandemic.

Already reeling from a weak Christmas period and the effects of the bushfires, retailers were hoping for a return to spending. Instead, they have been faced with store closures and possibly permanent shifts in consumer behaviour.

While some retailers have simply tried to survive the lockdowns, others are re-evaluating their future. For Wesfarmers, this means shifting focus from the struggling Target to the more popular and profitable Kmart.

But though the pandemic has undoubtedly had an unprecedented and substantial impact on the retail industry, in some cases it only accelerating outcomes already on the cards.

So Target is unlikely to be the last retailer to undergo radical surgery. Retailers like the Accent Group and PAS Group have flagged similar plans.

Expect further announcements as retailers evaluate how to survive.The Conversation

About the Author:

Jason Pallant, Lecturer of Marketing, Swinburne University of Technology and Gary Mortimer, Professor of Marketing and Consumer Behaviour, Queensland University of Technology

This article is republished from The Conversation under a Creative Commons license. Read the original article.


Meet the struggling gold miners who are missing out on boom in the precious metal

By Sara Geenen, University of Antwerp and Boris Verbrugge, University of Antwerp

In Mukungwe, Democratic Republic of Congo, thousands of young men and women live in makeshift huts. They have no access to sanitation or health facilities. They work as manual drillers, carriers or timber specialists in narrow underground tunnels, which exposes them to everything from toxic metals to cave-ins and even suffocation.

They work in teams under different agreements with a local paymaster, sometimes sharing what they find, sometimes receiving a wage or payments in kind. Outside the pits, others work as rock crushers, water carriers, washers or cooks. Small buyers lurk around with hand-held scales, using old coins and toothpicks to weigh the gold. For miners lucky enough to extract a little precious metal, there are dollars to be made from the dust.

In the Philippines, men, women and children work underground. They pan for gold in rivers and creeks, or use hydraulic hoses to extract gold-bearing sediments. Young men even dive for gold in narrow pitch-dark shafts at the bottom of rivers and the ocean.

This is artisanal or small-scale gold mining (ASGM), which supports tens of millions worldwide. ASGM is a broad catch-all term for practices with two things in common: very labour-intensive work and only partial government regulation at best. This guarantees cheap and flexible workers, which drives down the cost of production.

Yet there’s nothing marginal about this mining. The likes of the garimpeiro in Brazil or Mozambique, galamsey in Ghana and ninja miners in Mongolia are often the backbone of local economies. They target small, diffuse deposits that are unprofitable for multinationals, or difficult to reach because of physical or political conditions. As we argue in our recent book, they supply at least one-fifth of all newly mined gold.

Gold mining and coronavirus

This mining is connected to global gold markets through multi-layered trading-networks. From the small buyer hanging around the mines, to the master trader moving gold across the border, to the sourcing agent sent by the Swiss refinery, supply chains are long and complex. Yet there is typically little difference between the global spot price of gold and the going rate outside the mine.

In theory, this puts sellers in a strong position now that gold prices are at eight-year highs. It could be a golden opportunity for those who finance these operations, which can be anyone from veteran miners to paramilitaries, but mine workers are not necessarily benefiting.

They are particularly vulnerable to coronavirus, since there is no social distancing in crowded mining tunnels. Many already have badly damaged lungs, and little access to doctors – let alone publicly funded healthcare.

Mining communities often depend on imported goods. Our contacts tell us that in mining areas in the Democratic Republic of the Congo, basic food prices have risen fivefold.

Then there is lockdown disruption. In some areas of the Philippines, for example, frantic government efforts to combat the virus are preventing miners and buyers from reaching mines. Exporters are stockpiling gold at international airports, waiting for commercial flights to resume and for Middle Eastern and Indian gold bazaars to reopen.

Thanks to this combination of soaring gold prices, supply chain restrictions and cash shortages, the difference between local and global gold prices has widened. In Burkina Faso, Sierra Leone and Peru, it is as much as 40%. Our contacts say that in parts of the Philippines, it exceeds 60%.

For gold traders with cash reserves and the skills and contacts to circumvent pandemic restrictions, this is a lifetime opportunity. In the African Great Lakes region, the NGO Impact reports on rich dealers using private jets to buy cheap gold.

Such buyers are often backed by high-level politicians and military and non-state armed groups. Mine workers often have little choice but to accept highly unequal terms of trade. These times expose the inequalities in the market, and the vulnerabilities of those doing the dirty work.

What should be done?

On the health front, governments must raise COVID-19 awareness and prevent it spreading in these communities. They should continue working with donors to encourage mining practices that limit people’s dust intake and exposure to toxic metals. Together, they need to develop public healthcare systems that extend to these informal workers.

Governments also need to restore miners’ access to the global market, perhaps buying ASGM gold even on a tax-free, no-questions-asked basis. Admittedly, state gold-buying programmes are tricky, as demonstrated in the Philippines, where all production is supposed to be bought and refined by the central bank, but traders have long smuggled gold to Hong Kong.

Governments could also build on responsible sourcing initiatives by the likes of the Responsible Jewellery Council and London Bullion Market Association. These only allow sourcing from “legitimate ASGM” that is tax-registered and formally regulated, or at least undertakes “good faith efforts” to operate legally.

Yet with complex supply chains and proving the origin of the gold difficult, these initiatives may push refineries to ignore small-scale mining altogether. These initiatives also detract from what arguably matters most: the unhealthy and exploitative conditions in most ASGM.

Instead, governments could push a more pragmatic solution, such as the Alliance for Responsible Mining’s CRAFT code, which doesn’t require miners to be part of a formal organisation, while also emphasising safety.

Responsible sourcing initiatives should prioritise working with governments and local organisations to improve public infrastructure and services in these mines. They should facilitate miners’ access to safe mining technologies and the financial services so that they can invest in them. Small-scale mining sustains millions of people: with so much else for governments to worry about, keeping these communities thriving should be the main priority.

About the Author:

Sara Geenen, Assistant professor in Globalisation, International Development and Poverty, University of Antwerp and Boris Verbrugge, Post-doctoral Researcher in Development Studies, University of Antwerp

This article is republished from The Conversation under a Creative Commons license. Read the original article.


Forex Technical Analysis & Forecast 22.05.2020

Article By RoboForex.com

EURUSD, “Euro vs US Dollar”

EURUSD is trading downwards to reach 1.0922. Later, the market may correct towards 1.0969 and then resume trading inside the downtrend with the target at 1.0840.

EURUSD
Risk Warning: the result of previous trading operations do not guarantee the same results in the future

GBPUSD, “Great Britain Pound vs US Dollar”

GBPUSD continues falling towards 1.2170. After that, the instrument may correct to reach 1.2222 and then continue trading downwards with the first target at 1.2100.

GBPUSD
Risk Warning: the result of previous trading operations do not guarantee the same results in the future

USDRUB, “US Dollar vs Russian Ruble”

USDRUB has extended the descending wave down to 70.70; right now, it is consolidating below this level. Today, the pair may correct towards 72.60 to test it from below and then resume trading inside the downtrend with the target at 69.44.

USDRUB
Risk Warning: the result of previous trading operations do not guarantee the same results in the future

USDJPY, “US Dollar vs Japanese Yen”

USDJPY is moving downwards to break 107.30. After that, the instrument may continue falling with the short-term target at 106.66.

USDJPY
Risk Warning: the result of previous trading operations do not guarantee the same results in the future

USDCHF, “US Dollar vs Swiss Franc”

After breaking 0.9700 to the upside, USDCHF is expected to continue growing towards 0.9737. Later, the market may start a new correction to reach 0.9696 and then form one more ascending structure with the first target at 0.9750.

USDCHF
Risk Warning: the result of previous trading operations do not guarantee the same results in the future

AUDUSD, “Australian Dollar vs US Dollar”

After reaching the downside target at 0.6533, AUDUSD is expected to consolidate above this level. If later the price breaks this range to the upside, the market may start a new correction to reach 0.6575; if to the downside – form a new descending structure with the target at 0.6478.

AUDUSD
Risk Warning: the result of previous trading operations do not guarantee the same results in the future

BRENT

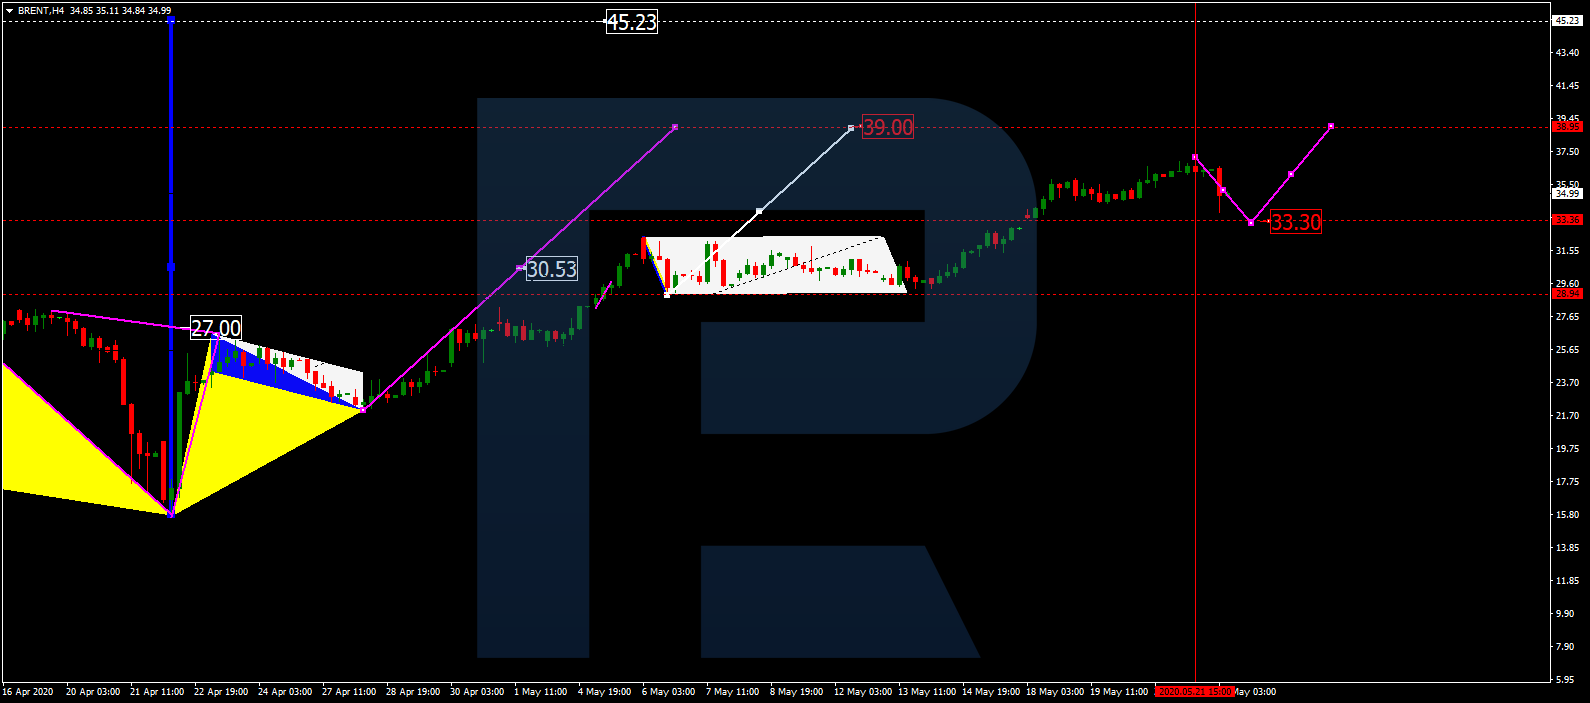
Brent is correcting towards 33.33. After that, the instrument may resume trading upwards with the short-term target at 39.00 and then start another correction towards 32.50.

BRENT
Risk Warning: the result of previous trading operations do not guarantee the same results in the future

XAUUSD, “Gold vs US Dollar”

After finishing the descending wave at 1721.80, Gold is expected to form one more ascending wave to reach 1737.20 (at least). After that, the instrument may start a new decline towards 1710.10 and complete a Flag correctional pattern.

GOLD
Risk Warning: the result of previous trading operations do not guarantee the same results in the future

BTCUSD, “Bitcoin vs US Dollar”

After completing the correction at 8888.80, BTCUSD is expected to consolidate near the lows. If later the price breaks this range to the upside, the market may start a new growth to break 9500.00 and then continue trading upwards with the target at 10150.00; if to the downside – form a new descending structure to reach 8300.00.

BITCOIN
Risk Warning: the result of previous trading operations do not guarantee the same results in the future

S&P 500

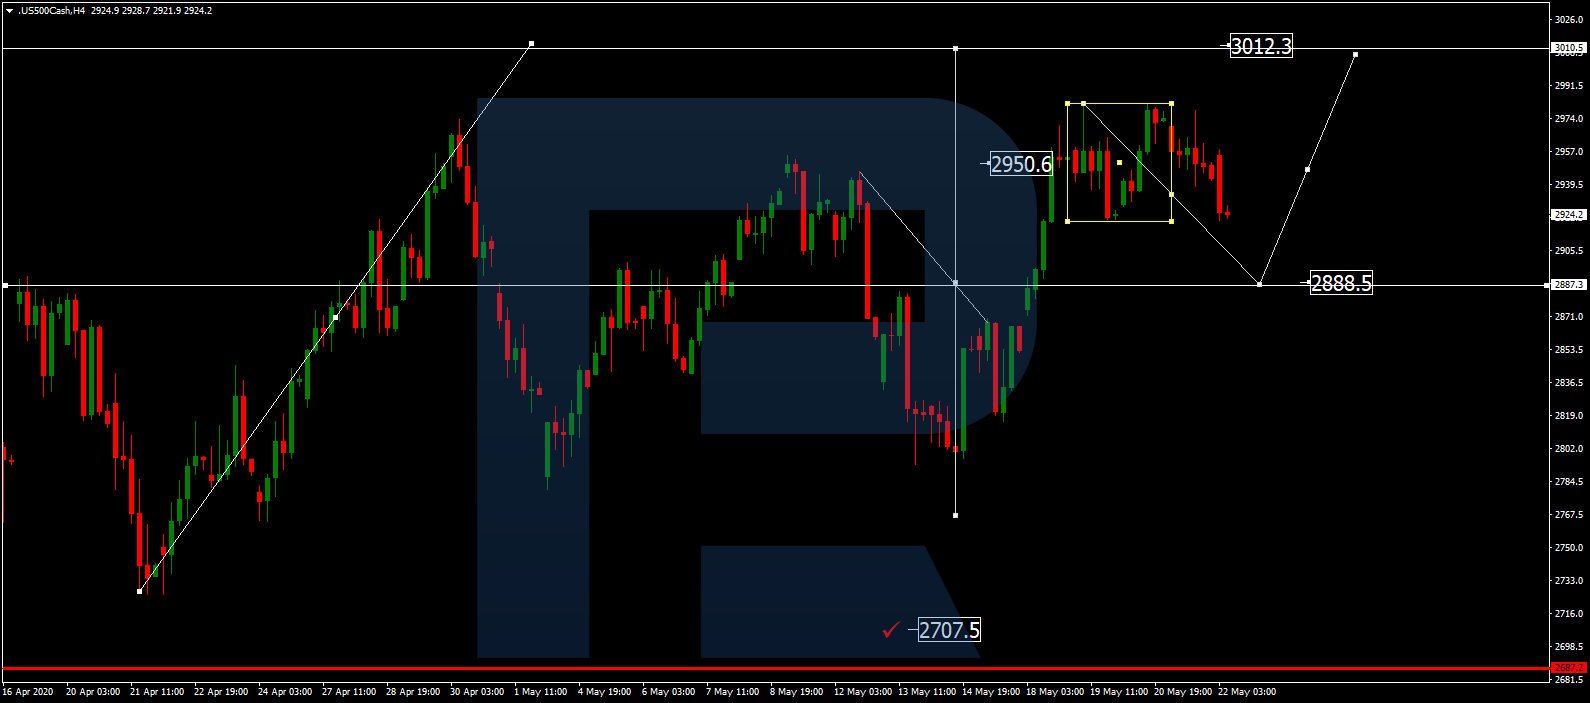
The Index is consolidating not far from the downside border. Possibly, the pair may break 2920.0 downwards and start a new correction to reach 2888.5. Later, the market may form one more ascending structure with the target at 3012.5.

S&P 500

Article By RoboForex.com

Attention!
Forecasts presented in this section only reflect the author’s private opinion and should not be considered as guidance for trading. RoboForex LP bears no responsibility for trading results based on trading recommendations described in these analytical reviews.

Fibonacci Retracements Analysis 22.05.2020 (BITCOIN, ETHEREUM)

Article By RoboForex.com

BTCUSD, “Bitcoin vs US Dollar”

As we can see in the H4 chart, some time ago, BTCUSD attempted to reach the high and tried to stay close to it for a while. However, bulls were not strong enough to continue pushing the asset upwards, and, as a result, the instrument started a new decline towards 23.6% fibo. In the nearest future, the price is expected to continue falling to reach 38.2%, 50.0%, and 61.8% fibo at 7727.00, 7002.00, and 627800 respectively.

BTCUSD_H4
Risk Warning: the result of previous trading operations do not guarantee the same results in the future

The H1 chart shows more detailed structure of the current correctional wave. We can see that the wave is approaching 23.6% fibo.

BTCUSD_H1
Risk Warning: the result of previous trading operations do not guarantee the same results in the future

ETHUSD, “Ethereum vs. US Dollar”

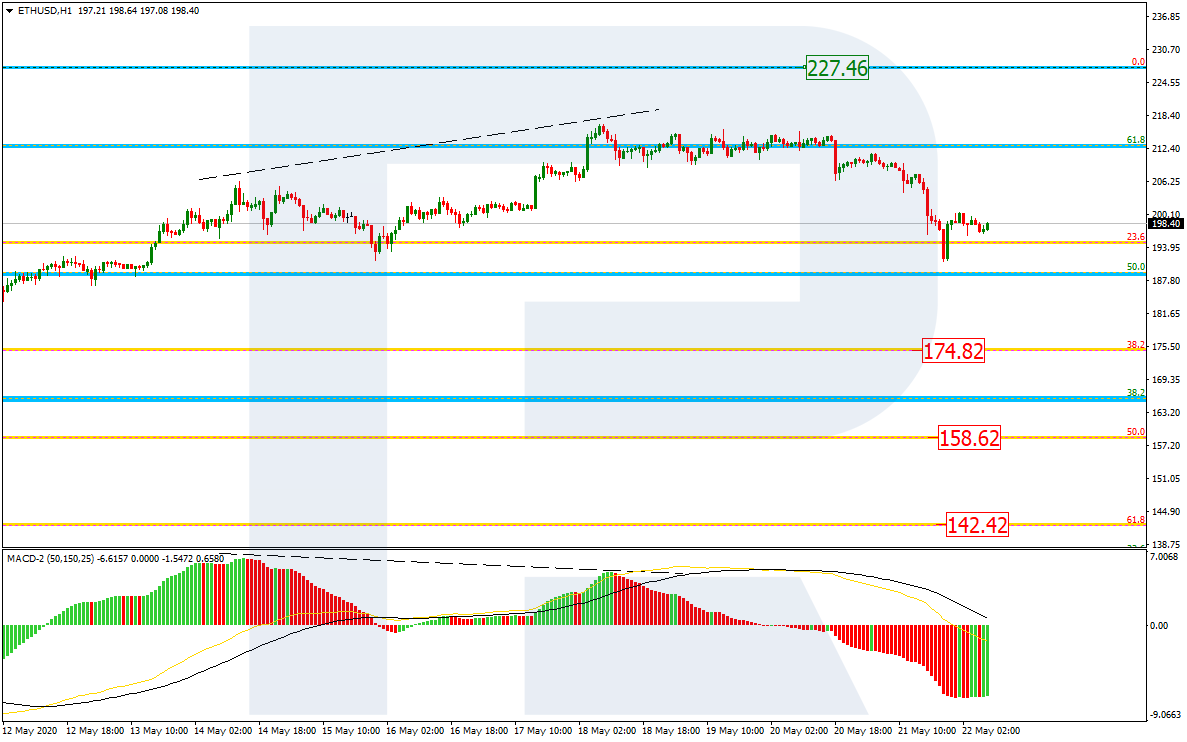
As we can see in the H4 chart, after re-testing 61.8% fibo and rebounding it, ETHUSD has failed to reach the high at 227.46; right now, it is moving downwards. After reaching 23.6% fibo, the descending wave may continue towards 38.2%, 50.0%, and 61.8% fibo at 174.82, 158.62, and 142.42 respectively.

ETHUSD_H4
Risk Warning: the result of previous trading operations do not guarantee the same results in the future

In the H1 chart, the divergence made the pair fall and reach 23.6% once again.

ETHEREUM_H1

Article By RoboForex.com

Attention!
Forecasts presented in this section only reflect the author’s private opinion and should not be considered as guidance for trading. RoboForex LP bears no responsibility for trading results based on trading recommendations described in these analytical reviews.

Demand for Risky Assets Has Weakened due to Tensions Between the US and China

by JustForex

The US currency has been growing against a basket of currency majors. The US dollar index (#DX) closed in the positive zone (+0.27%). The growing tension between the US and China after the PRC announced its intention to consider the Hong Kong national security bill, is in the spotlight. This bill provides for a ban on separatist activities and is aimed at countering terrorism and any outside interference. In turn, the United States has prepared a bill imposing sanctions against Chinese officials and organizations that monitor compliance with national security laws in Hong Kong.

Yesterday, ambiguous US economic data were published. The number of initial jobless claims has risen by 2,438K again, while experts predicted an increase by 2,400K. However, previous data was revised upwards from 2,981 K to 2,687 K. Philadelphia Fed manufacturing index fell by 43.1 instead of 41.5.

The “black gold” prices are consolidating. Currently, futures for the WTI crude oil are testing the $32.05 mark per barrel.

Market indicators

Yesterday, there was the bearish sentiment in the US stock market: #SPY (-0.69%), #DIA (-0.29%), #QQQ (-1.09%).

The 10-year US government bonds yield has declined. At the moment, the indicator is at the level of 0.64-0.65%.

The news feed on 2020.05.22:
  • – UK retail sales data at 09:00 (GMT+3:00);
    – ECB monetary policy meeting account at 14:30 (GMT+3:00);
    – Canada’s retail sales report at 15:30 (GMT+3:00).

by JustForex

The Analytical Overview of the Main Currency Pairs on 2020.05.22

by JustForex

The EUR/USD currency pair

Technical indicators of the currency pair:
  • Prev Open: 1.09794
  • Open: 1.09493
  • % chg. over the last day: -0.26
  • Day’s range: 1.09065 – 1.09573
  • 52 wk range: 1.0777 – 1.1494

EUR/USD quotes have been declining. The euro has updated local lows. Demand for risky assets has weakened amid a new wave of tension between Washington and Beijing. Donald Trump said the United States would react “very strongly” if China imposed national security laws in Hong Kong in response to last year’s democratic protests. The US Senate also passed a bill that allows the delisting of Chinese companies from stock exchanges. At the moment, the EUR/USD currency pair is consolidating in the range of 1.0900-1.0940. We expect the ECB meeting account. A trading instrument has the potential for further decline. We recommend opening positions from key levels.

The Economic News Feed for 22.05.2020:
    • At 14:30 (GMT+3:00), the ECB monetary policy meeting account will be published.
EUR/USD

Indicators do not give accurate signals: the price has fixed between 50 MA and 100 MA.

The MACD histogram is in the negative zone and below the signal line, which gives a strong signal to sell EUR/USD.

Stochastic Oscillator is in the neutral zone, the %K line has crossed the %D line. There are no signals at the moment.

Trading recommendations
      • Support levels: 1.0900, 1.0875, 1.0840
      • Resistance levels: 1.0940, 1.0975, 1.1000

If the price fixes below the round level of 1.0900, a further fall in EUR/USD quotes is expected. The movement is tending to 1.0875-1.0840.

An alternative could be the growth of EUR/USD quotes to 1.0970-1.0990.

The GBP/USD currency pair

Technical indicators of the currency pair:
  • Prev Open: 1.22340
  • Open: 1.22153
  • % chg. over the last day: -0.13
  • Day’s range: 1.21624 – 1.22334
  • 52 wk range: 1.1466 – 1.3516

The bearish sentiment prevails on the GBP/USD currency pair. Quotes have updated local lows. At the moment, the trading instrument is testing the support level of 1.2160. The 1.2210 mark is the nearest resistance. The demand for risky assets is still low. The British pound is under pressure due to a weak report on retail sales in the UK. We do not exclude a further drop in GBP/USD quotes. We recommend opening positions from key levels.

GBP/USD

Indicators do not give accurate signals: 50 MA has crossed 100 MA.

The MACD histogram has started declining, which indicates the development of a negative trend on the GBP/USD currency pair.

Stochastic Oscillator is in the neutral zone, the %K line is below the %D line, which indicates the bearish sentiment.

Trading recommendations
  • Support levels: 1.2160, 1.2120, 1.2075
  • Resistance levels: 1.2210, 1.2245, 1.2290

If the price fixes below 1.2160, a further drop in GBP/USD quotes is expected. The movement is tending to the round level of 1.2100.

An alternative could be the growth of the GBP/USD currency pair to 1.2240-1.2280.

The USD/CAD currency pair

Technical indicators of the currency pair:
  • Prev Open: 1.39005
  • Open: 1.39549
  • % chg. over the last day: +0.38
  • Day’s range: 1.39412 – 1.40350
  • 52 wk range: 1.2949 – 1.4668

The USD/CAD currency pair has been growing after a prolonged consolidation. During yesterday’s and today’s trading sessions, the growth of quotes has exceeded 130 points. At the moment, USD/CAD quotes are testing the “mirror” resistance of 1.4035. The 1.3990 mark is the nearest support. Investors have taken a wait-and-see attitude before the report on retail sales in Canada. We also recommend paying attention to the dynamics of “black gold” prices. Positions should be opened from key levels.

At 15:30 (GMT+3:00), data on retail sales will be published in Canada.

USD/CAD

Indicators do not give accurate signals: the price has crossed 100 MA.

The MACD histogram is in the positive zone and above the signal line, indicating the bullish sentiment.

Stochastic Oscillator is in the overbought zone, the %K line has crossed the %D line. There are no signals at the moment.

Trading recommendations
  • Support levels: 1.3990, 1.3960, 1.3910
  • Resistance levels: 1.4035, 1.4065, 1.4100

If the price fixes above 1.4035, further growth of the USD/CAD quotes is expected. The movement is tending to 1.4065-1.4100.

An alternative could be a decrease in the USD/CAD currency pair to 1.3970-1.3940.

The USD/JPY currency pair

Technical indicators of the currency pair:
  • Prev Open: 107.473
  • Open: 107.634
  • % chg. over the last day: +0.09
  • Day’s range: 107.322 – 107.763
  • 52 wk range: 101.19 – 112.41

The technical pattern is still ambiguous on the USD/JPY currency pair. The trading instrument is in a sideways trend. At the moment, the local support and resistance levels are 107.35 and 107.65, respectively. The demand for “safe-haven” currencies has grown significantly. USD/JPY quotes are tending to decline. Positions should be opened from key levels.

The Bank of Japan will allocate about $279 billion to support the small business affected by the COVID-19 epidemic and prevent a recession in the economy.

USD/JPY

Indicators do not give accurate signals: the price has fixed between 50 MA and 100 MA.

The MACD histogram has moved into the negative zone, indicating the bearish sentiment.

Stochastic Oscillator is in the neutral zone, the %K line is above the %D line, which gives a signal to buy USD/JPY.

Trading recommendations
  • Support levels: 107.35, 107.10, 106.80
  • Resistance levels: 107.65, 107.85, 108.05

If the price fixes below 107.35, USD/JPY quotes are expected to fall. The movement is tending to 107.10-106.80.

An alternative could be the growth of the USD/JPY currency pair to 107.90-108.10.

by JustForex

EUR/USD about to re-capture 1.1000 – 1.1200 to come?

By Admiral Markets

Source: Economic Events May 22, 2020 – Admiral Markets’ Forex Calendar

While the economic calendar is quite thin for the weekly close, and market participants may expect forex volatility to be subdued in expectation of the upcoming US bank holiday next Monday, the EUR/USD faces an extremely interesting short-term resistance zone around 1.1000.

In fact, a break higher, with a dynamic stint and quick follow through as high as 1.1200, became likely over the last few days. Because, on Monday, Germany and France’s Merkel and Macron proposed a 500 billion EU recovery fund that would offer grants to the European Union regions and sectors hit hardest by the coronavirus pandemic.

Indeed, one could see this as a first step towards a transfer union and in addition with the massive monetary stimulus from the ECB, recent Euro bullishness with further gains comes with no big surprise.

In addition to that, we see the US dollar staying under consistent pressure, and while we expect European yields to continue to rise, a sustainable drop in 10-year US Treasury yields below 0.60% is likely, too, resulting in a further narrowing of the yield differential between EU and US bonds, favouring gains in the EUR/USD.

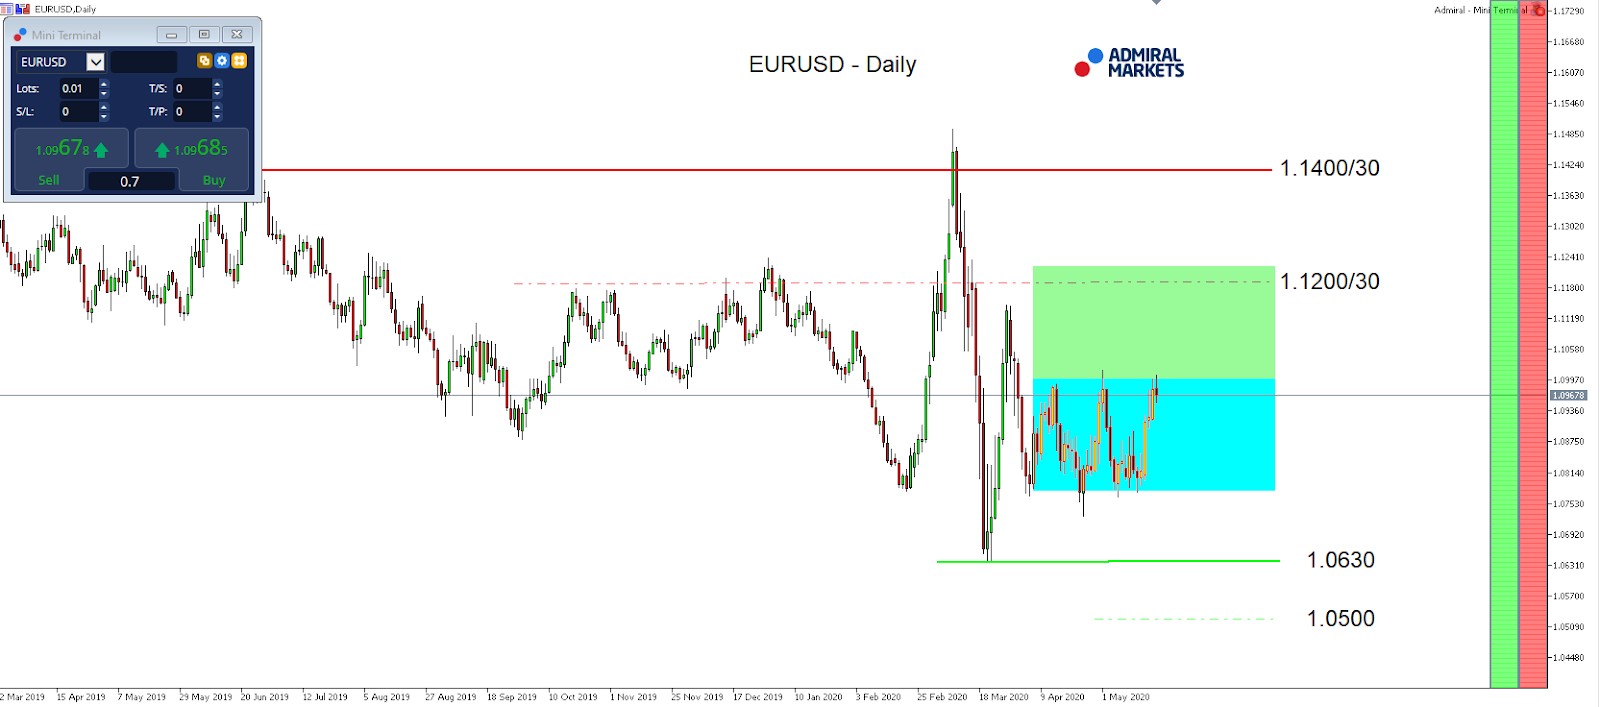
Technically, a break above 1.1000 coincides with a break out of the trading range between 1.0750/0800 and 1.1000 since the beginning of April, resulting in a projected target on the upside around 1.1200/1250:

Source: Admiral Markets MT5 with MT5-SE Add-on EUR/USD Daily chart (between March 22, 2019, to May 21, 2020). Accessed: May 21, 2020, at 10:00pm GMT – Please note: Past performance is not a reliable indicator of future results, or future performance.

In 2015, the value of the EUR/USD fell by 10.2%, in 2016 it fell by 3.2%, in 2017, it increased by 13.92%, 2018, it fell by 4.4%, 2019, it fell by 2.2%, meaning that after five years, it was down by 7.3%.

Discover the world’s #1 multi-asset platform

Admiral Markets offers professional traders the ability to trade with a custom, upgraded version of MetaTrader 5, allowing you to experience trading at a significantly higher, more rewarding level. Experience benefits such as the addition of the Market Heat Map, so you can compare various currency pairs to see which ones might be lucrative investments, access real-time trading data, and so much more. Click the banner below to start your FREE download of MT5 Supreme Edition!

Download MetaTrader 5 and begin trading today!

Disclaimer: The given data provides additional information regarding all analysis, estimates, prognosis, forecasts or other similar assessments or information (hereinafter “Analysis”) published on the website of Admiral Markets. Before making any investment decisions please pay close attention to the following:

  1. This is a marketing communication. The analysis is published for informative purposes only and are in no way to be construed as investment advice or recommendation. It has not been prepared in accordance with legal requirements designed to promote the independence of investment research, and that it is not subject to any prohibition on dealing ahead of the dissemination of investment research.
  2. Any investment decision is made by each client alone whereas Admiral Markets shall not be responsible for any loss or damage arising from any such decision, whether or not based on the Analysis.
  3. Each of the Analysis is prepared by an independent analyst (Jens Klatt, Professional Trader and Analyst, hereinafter “Author”) based on the Author’s personal estimations.
  4. To ensure that the interests of the clients would be protected and objectivity of the Analysis would not be damaged Admiral Markets has established relevant internal procedures for prevention and management of conflicts of interest.
  5. Whilst every reasonable effort is taken to ensure that all sources of the Analysis are reliable and that all information is presented, as much as possible, in an understandable, timely, precise and complete manner, Admiral Markets does not guarantee the accuracy or completeness of any information contained within the Analysis. The presented figures refer that refer to any past performance is not a reliable indicator of future results.
  6. The contents of the Analysis should not be construed as an express or implied promise, guarantee or implication by Admiral Markets that the client shall profit from the strategies therein or that losses in connection therewith may or shall be limited.
  7. Any kind of previous or modeled performance of financial instruments indicated within the Publication should not be construed as an express or implied promise, guarantee or implication by Admiral Markets for any future performance. The value of the financial instrument may both increase and decrease and the preservation of the asset value is not guaranteed.
  8. The projections included in the Analysis may be subject to additional fees, taxes or other charges, depending on the subject of the Publication. The price list applicable to the services provided by Admiral Markets is publicly available from the website of Admiral Markets.

Leveraged products (including contracts for difference) are speculative in nature and may result in losses or profit. Before you start trading, you should make sure that you understand all the risks.

By Admiral Markets

China as COVID-19 scapegoat

By Dan Steinbock

– After the disastrous mishandling of its COVID-19 battle, the Trump White House blames China for the virus, at the cost of American lives and worst contraction since the 1930s.

Ironically, President Trump thanked President Xi for China’s success in the virus battle in late January. But he adopted a very different tone as the White House mishandled the outbreak permitting the virus to spread in America [for the full story, see my COVID-19 report, The Tragedy of Missed Opportunities].

In fact, Trump’s own cabinet took an adversarial stance from the beginning. If the escalation will continue, that stance could result in a new Cold War and the Second Global Depression in the coming years.

Blaming China for Trump’s COVID-19 mishandling

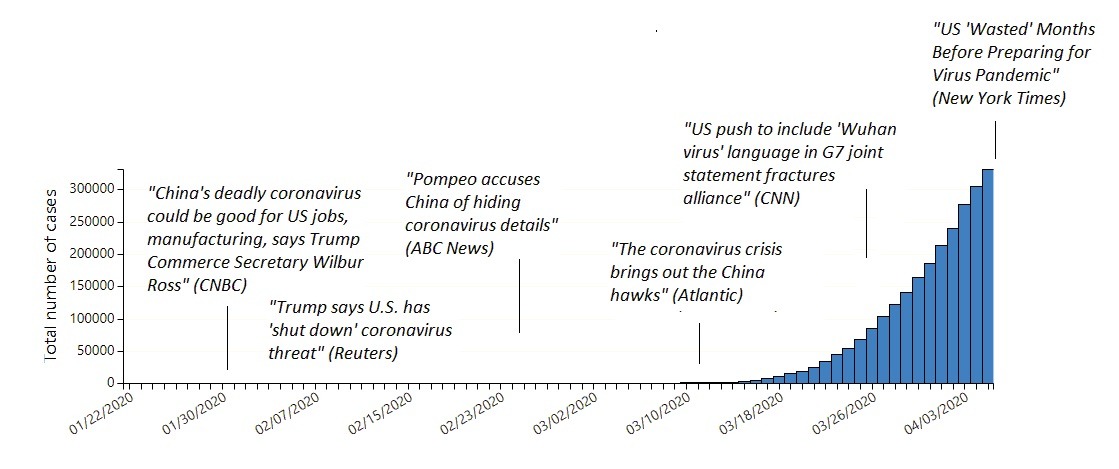
The efforts to exploit the crisis for political purposes began early in the year. On January 30, right after the ‘Phase 1’ trade deal and the national virus emergency in China, Commerce Secretary Wilbur Ross declared the outbreak in China would benefit US manufacturing and bring jobs back to America. He was seconded by Trump’s trade advisor, Peter Navarro, who pledged US tariffs on Chinese imports would not be lifted even if the deadly coronavirus weighs on China’s economy.

Despite the first novel coronavirus cases in the US, both Ross and Navarro apparently presumed the virus would not spread in America.

Between early January and mid-March, the Trump White House’s accusations against China intensified with broad criticism of the administration’s mishandling of the outbreak, particularly as US debate escalated over botched evacuations, faulty test kits and delays in testing, shortages of personal protective equipment (PPE) and additional PPE shortages due to tariff wars, failed responses and associated elevated health risks, inadequate quarantines, failed self-quarantines, premature exits from lockdowns and the list goes on.

That’s when politicized attacks were initiated by Secretary of State Mike Pompeo and Health and Human Services Secretary Alex Azar who blamed China for the U.S. virus crisis. Meanwhile, Trump sought to “talk down” the virus impact in the markets.

When the WHO declared the global emergency on Jan 30, Trump still claimed that “we have it very well under control.” Even in early March, he described the virus as “very mild” and said the infected could get better by “going to work.”

Ironically, as the Trump White House repeatedly labelled the virus a “China virus” or “Wuhan virus,” that fostered a perception that the outbreak would be limited to China, while it was actually exploding in America and Europe.

When these deflection efforts failed to halt public criticism of the administration, the Trump White House began to exploit even reputable media to launder unsubstantiated intelligence meant to ratchet up tensions with China. The hope is that scapegoating – the “Chinagate” – would steer attention away from the Trump administration’s catastrophic disastrous mishandling of the COVID-19 crisis.

That’s why the politicized efforts to re-redefine the COVID-19 as the “China virus” continued into late March (and prevail even today). That’s when the numbers of US virus cases and deaths began to soar.

Use of scapegoats in paranoid politics

Instead of international cooperation to beat the pandemic, the Trump White House and its Republican supporters are on a survival mode. They hope to ensure Trump’s second term. That’s why another critical moment was missed when Pompeo called for COVID-19 to be identified as the “Wuhan virus” at the G7 Summit in late March.

Obviously, European officials resisted the redefinition since the WHO had cautioned against giving the virus a geographic name because of its global nature. But in the process, precious time was missed as US domestic political priorities overrode the urgency for international cooperation against the global pandemic (Figure).

Figure China as the Scapegoat for U.S. Mishandling of the Pandemic

The purposeful use of projective bashing of targeted scapegoats has a long history in US politics. In the mid-1960s, Richard Hofstadter, the iconic historian of postwar liberal consensus, defined it as a recurring “paranoid style in American politics.”

In the effort to explain away the presence of class, ethnic, and immigration divisions in America, this style projects such divides onto other countries, real or imaginary adversaries, as evidenced by the 1950s McCarthyism, the Trump administration’s controversial ties with the U.S. alt-right movement, and Trump’s personal paranoid style that sparked warnings by leading American psychiatrists and psychologists already three years ago (The Dangerous Case of Donald Trump, 2017).

These views have been echoed by former US ambassador to China Max Baucus, who recently warned that he feared the Trump administration’s rhetoric against China was leading the US into an era “which is similar to Joe McCarthy back when he was red-baiting the State Department, attacking communism.”

Months of missed opportunities

The Trump administration knew about the virus risks already by January 3, when CDC Director Dr. Robert R. Redfield called Secretary of Health Azar, telling him China had discovered a new coronavirus. Azar made sure the National Security Council (NSC) knew about the virus because in early 2017 Trump had eliminated NSC’s global health unit, despite warnings about possible future pandemics.

As the New York Times has reported, the new virus team began daily meetings in the basement of the West Wing, yet no mobilization was initiated. Rather, a long debate began within the White House over “what to tell to the American public,” even as Trump, Pompeo and Azar blamed China for the lack of transparency.

Although the government’s leading scientists and health experts raised the alarm early and pushed for aggressive action, they faced resistance at the White House. Trump didn’t want markets to be spooked by panic. As a result, misguided political priorities continue to override science-based policies stressing public health.

The cult of secrecy in the White House has not eased. In mid-April, Dr Anthony Fauci, a key member of the virus task force, was asked by the CNN, whether earlier mitigation efforts could have saved more lives. Truthfully, he admitted: “If we had right from the very beginning shut everything down, it may have been a little bit different. But there was a lot of pushback about shutting things down back then.” Hours later, Trump retweeted a user who said it was “Time to #FireFauci.”

The recent confrontation between Trump and Fauci about the dangers of a premature exit from the lockdown is still another example of Trump’s political priorities, at the expense of American lives and U.S. economy.

Whatever the ultimate reason for the painfully long delay in the mobilization against the virus in America, the fact remains that, like Hong Kong and Singapore after January 3, the Trump White House could have begun the virus battle proactively.

For almost three months, it chose not to. And when it could no longer could hide its catastrophic mistake, the White House blamed China for the catastrophe.

About the Author:

Dr. Dan Steinbock is an internationally recognized strategist of the multipolar world and the founder of Difference Group. He has served at the India, China and America Institute (USA), Shanghai Institutes for International Studies (China) and the EU Center (Singapore). For more, see https://www.differencegroup.net

The commentary is based on Dr Steinbock’s briefing on May 16 and report, The Tragedy of Missed Opportunities, see https://www.differencegroup.net/coronavirus-briefs


Japanese Candlesticks Analysis 21.05.2020 (GOLD, NZDUSD, GBPUSD)

Article By RoboForex.com

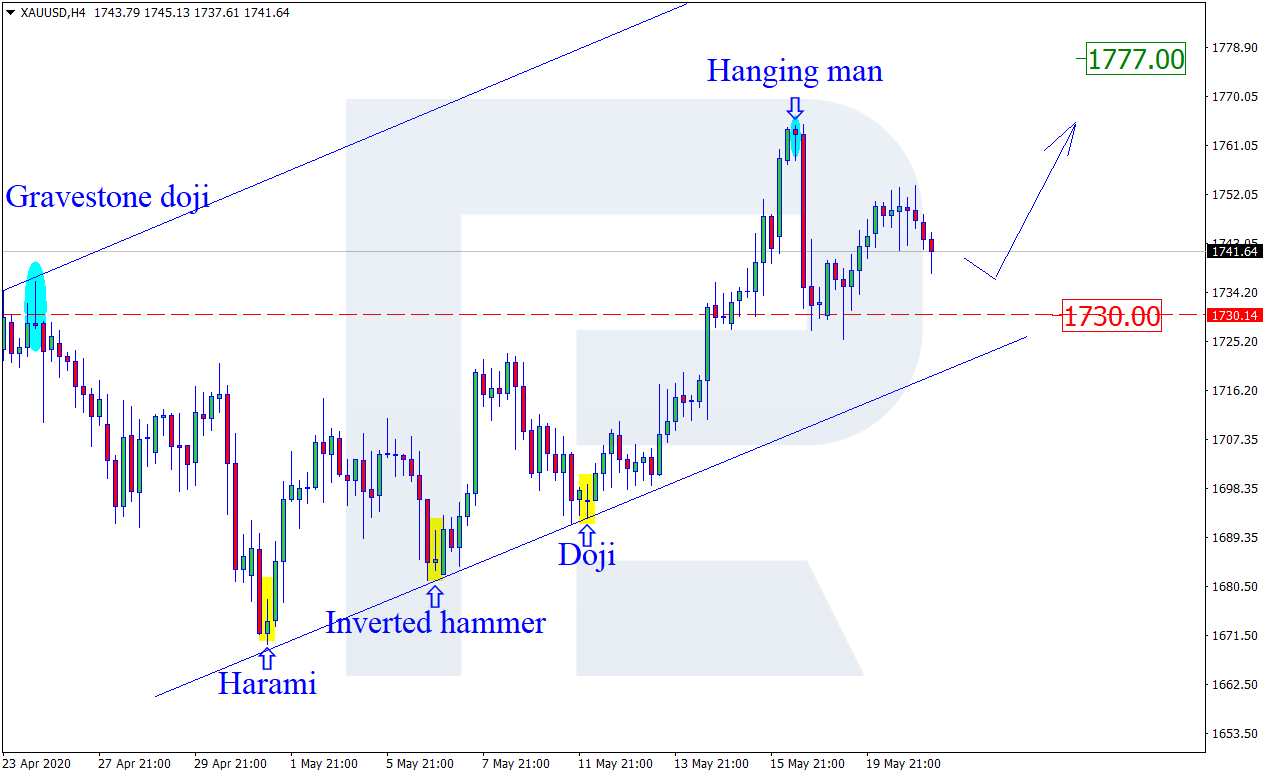
XAUUSD, “Gold vs US Dollar”

As we can see in the H4 chart, after forming a Hanging Man pattern, XAUUSD has reversed; right now, it is correcting downwards to reach 1730.00. If later the price rebounds from this level, the uptrend may resume. In this case, the upside target may be at 1777.00

XAUUSD
Risk Warning: the result of previous trading operations do not guarantee the same results in the future

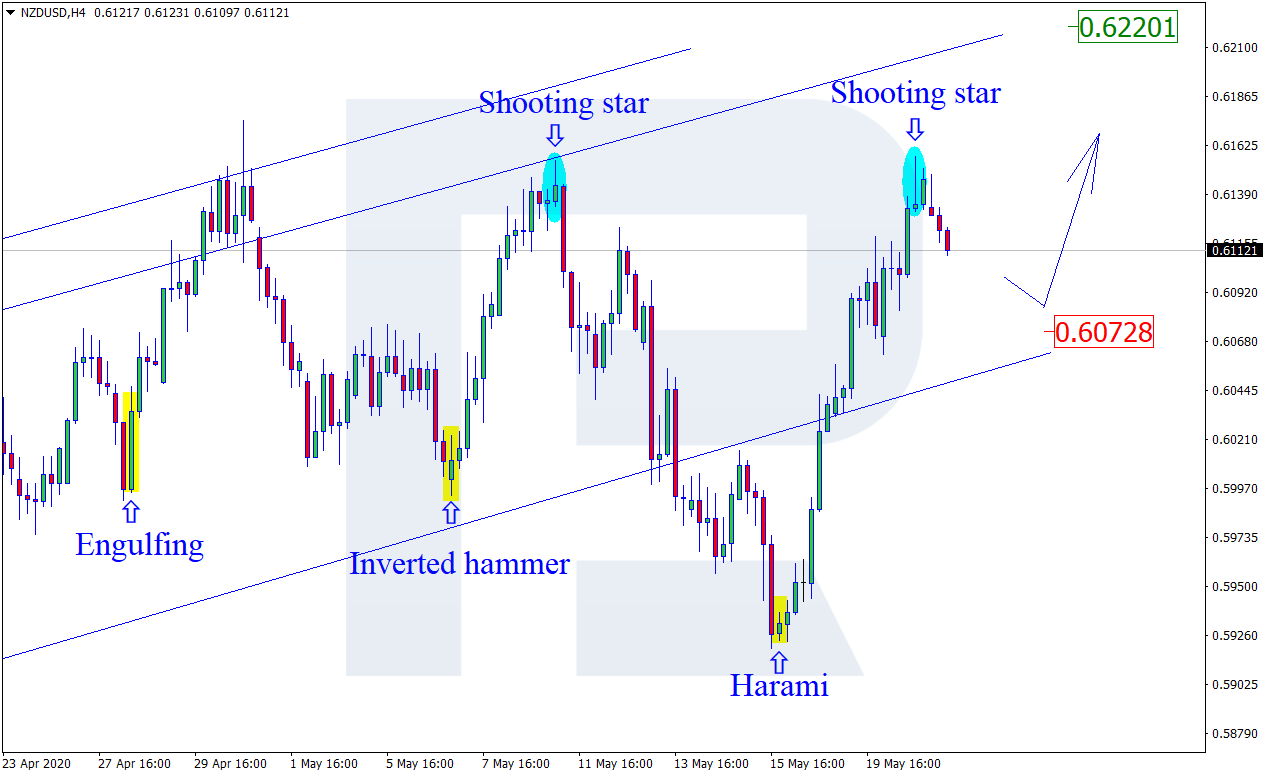
NZDUSD, “New Zealand vs. US Dollar”

As we can see in the H4 chart, NZDUSD is testing another resistance level; it has already formed a Shooting Star reversal pattern. At the moment, the pair is reversing. The current situation implies that the price may form a slight correction towards 0.6072 and then resume moving upwards. In this case, the upside target may be at 0.6220.

NZDUSD
Risk Warning: the result of previous trading operations do not guarantee the same results in the future

GBPUSD, “Great Britain Pound vs US Dollar”

As we can see in the H4 chart, after forming a Hammer pattern and rebounding from the support level, GBPUSD has reversed. At the moment, the pair is expected to continue forming the descending impulse. The downside target remains at 1.2010. However, there is another scenario, which implies that the instrument may return to 1.2340.

GBPUSD

Article By RoboForex.com

Attention!
Forecasts presented in this section only reflect the author’s private opinion and should not be considered as guidance for trading. RoboForex LP bears no responsibility for trading results based on trading recommendations described in these analytical reviews.

Ichimoku Cloud Analysis 21.05.2020 (USDCAD, NZDUSD, USDCHF)

Article By RoboForex.com

USDCAD, “US Dollar vs Canadian Dollar”

USDCAD is trading at 1.3940; the instrument is moving inside Ichimoku Cloud, thus indicating a sideways tendency. The markets could indicate that the price may test the cloud’s downside border at 1.3925 and then resume moving upwards to reach 1.4085. Another signal in favor of further uptrend will be a rebound from the descending channel’s upside border. However, the bullish scenario may no longer be valid if the price breaks the cloud’s downside border and fixes below 1.3875. In this case, the pair may continue falling towards 1.3795. To confirm further growth, the asset must break the upside border of the Triangle pattern and fix above 1.3995.

USDCAD
Risk Warning: the result of previous trading operations do not guarantee the same results in the future

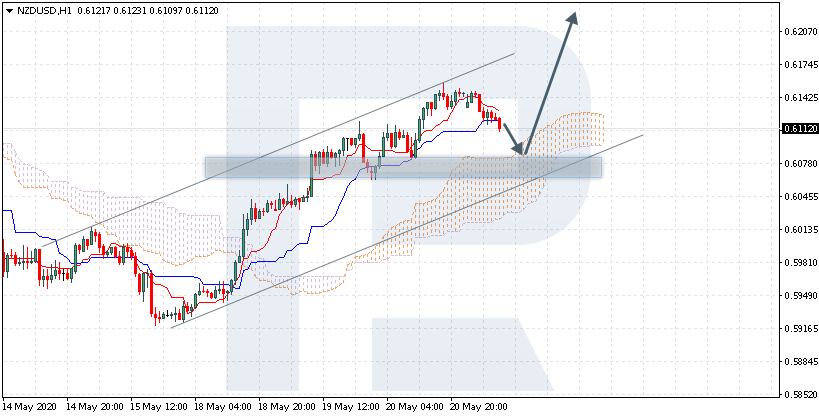
NZDUSD, “New Zealand Dollar vs US Dollar”

NZDUSD is trading at 0.6112; the instrument is moving above Ichimoku Cloud, thus indicating an ascending tendency. The markets could indicate that the price may test the cloud’s upside border at 0.6085 and then resume moving upwards to reach 0.6225. Another signal in favor of further uptrend will be a rebound from the rising channel’s downside border. However, the bullish scenario may be canceled if the price breaks the cloud’s downside border and fixes below 0.6015. In this case, the pair may continue falling towards 0.5925.

NZDUSD
Risk Warning: the result of previous trading operations do not guarantee the same results in the future

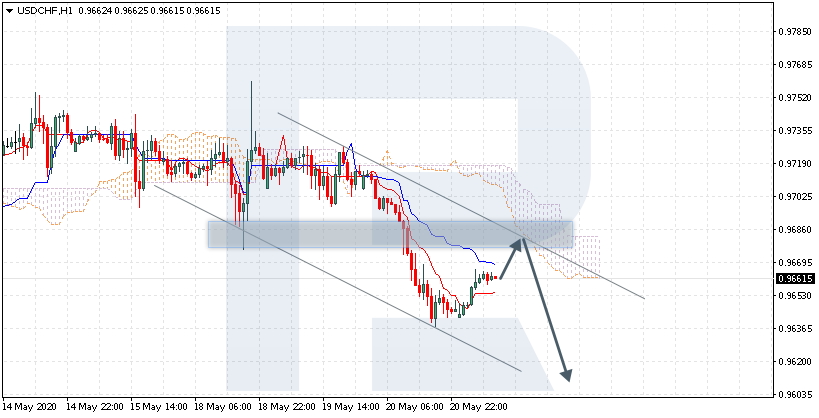
USDCHF, “US Dollar vs Swiss Franc”

USDCHF is trading at 0.9661; the instrument is moving below Ichimoku Cloud, thus indicating a descending tendency. The markets could indicate that the price may test the cloud’s downside border at 0.9685 and then resume moving downwards to reach 0.9625. Another signal in favor of further downtrend will be a rebound from the descending channel’s upside border. However, the bearish scenario may no longer be valid if the price breaks the cloud’s upside border and fixes above 0.9715. In this case, the pair may continue growing towards 0.9805.

USDCHF

Article By RoboForex.com

Attention!
Forecasts presented in this section only reflect the author’s private opinion and should not be considered as guidance for trading. RoboForex LP bears no responsibility for trading results based on trading recommendations described in these analytical reviews.