Author Archive for InvestMacro – Page 37

Ray Dalio Suggests USA Is Entering A Period Of Decline And New World Order

By TheTechnicalTraders

We find it interesting how researchers attempt to compare history, sometimes ancient history, to the applicable functions of today’s world and to attempt to translate the decline of empires in the past to what is happening in today’s world.  Ray Dalio appears to be suggesting the rise of the Chinese economy and economic capabilities is going to threaten to unseat the US as a world super-power.

Within Ray Dalio’s article, he suggests the following which seems to sum up his cycle theory:

“In brief, after the creation of a new set of rules establishes the new world order, there is typically a peaceful and prosperous period. As people get used to this they increasingly bet on the prosperity continuing, and they increasingly borrow money to do that, which eventually leads to a bubble.
As the prosperity increases the wealth gap grows. Eventually the debt bubble bursts, which leads to the printing of money and credit and increased internal conflict, which leads to some sort of wealth redistribution revolution that can be peaceful or violent. Typically at that time late in the cycle the leading empire that won the last economic and geopolitical war is less powerful relative to rival powers that prospered during the prosperous period, and with the bad economic conditions and the disagreements between powers there is typically some kind of war. Out of these debt, economic, domestic, and world-order breakdowns that take the forms of revolutions and wars come new winners and losers. Then the winners get together to create the new domestic and world orders.”

Our own research team has completed quite a bit of research into cycles and super-cycles and, although we agree with Mr. Dalio that past Empires have collapsed and been replaced with more efficient and emerging soon to be a new world leader. Yet, in every instance in the past, the world has been transitioning from a rather disconnected economic structure where ancient empires, or rather the last gasps of ancient empires and wealth, have become threatened, gone to war, and declined.

WWI initiated with the assassination of Archduke Franz Ferdinand in Sarajevo on June 28, 1914.  Nearly a month later, the great powers of Europe were aligned into two coalitions: the Triple Entente – consisting of France, Russia, and Britain – and the Triple Alliance of Germany, Austria-Hungary, and Italy.  Thus, the lines were drawn between ancient European empires that led to the beginning of a new structure of world empires.

Throughout history, the biggest world empires are structured, grow into superpowers, and begin to decline.  Most of these last well over 200 to 250+ years.

The Ottoman Empire started in the early 1300s and ended in the early 1600s because of a war with Persia – more than 300 years.

The Arab Empire, Mohammed, started in 632 and ended in 1258 – more than 600 years.

The Roman Empire began in 753 BC and ended in 23BC – over 700 years.

Chinese Qing Dynasty started in 1644 and ended in 1911 – over 250 years.

Chinese Ming Dynasty started in 1368 and ended in 1644 – almost 300 years.

America’s strength as a nation started to build in the late 1800s/early 1900s. Our rise to a world power came at a great expense in the 1930s and 1940s – fighting Hitler and the Japanese while saving most of Europe and SE Asia in the process. Then, we managed to rebuild most of these areas over a very short period of time.

Additionally, the idea that the current world would allow a nation like China to become a world-power – threatening world-order, capitalism, democracy, and current global geopolitical order seem alien to our researchers.  There is one thing Mr. Dalio seems to ignore in his theories – the world has a choice in the matter – just like we did when Adolf Hitler threatened western Europe and with Hideki Tojo threatened the US and most of SE Asia.  We have a choice in how we address the rise of China and how we protect our freedoms, rights, and futures from any threat China may present.

Currently, the world is moving away from a China-friendly relationship after the COVID-19 virus event has wreaked havoc across the globe.  China’s rise over the past 25+ years has mostly been on the success of selling China as a cheap manufacturing center for the US and other stronger economies.  The process of growing China has been to take advantage of the relationships they’ve built with foreign business/banking.  This is all starting to come to a sudden halt which may put extreme pressures on China’s banking and credit systems over the next 20+ years.

Before we continue, be sure to opt-in to our free market trend signals 
before closing this page, so you don’t miss our next special report!

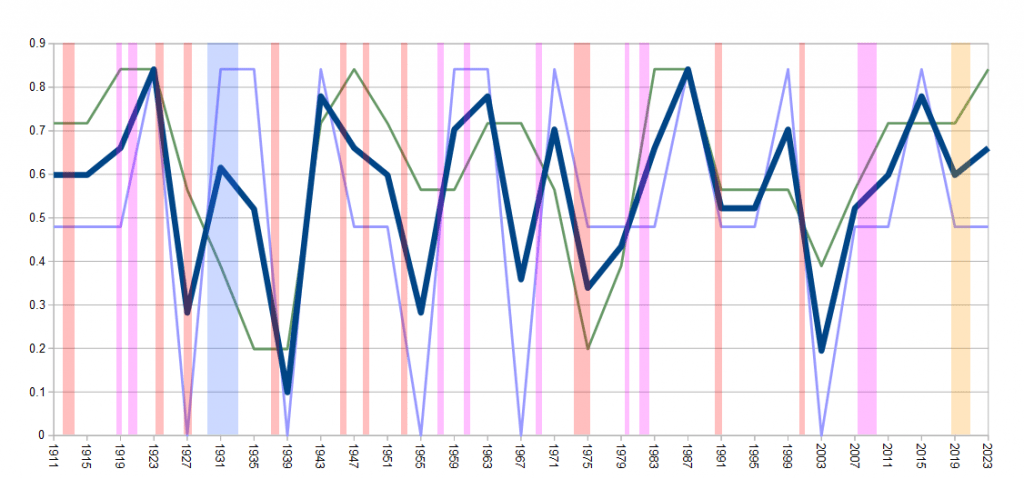
Our research team put together this chart to highlight the past 100+ years of cycle/super-cycle trends.  When you review this chart, pay attention to the deep collapse of the heavy blue line from 1923 through 1939 – the span of the Great Depression.  We’ve highlighted the area of the Great Depression in BLUE.  We’ve also highlighted recessions in RED and MAGENTA.  Red areas being recessions in cycle areas where the cycles are trending lower and Magenta are where recessions happened in upward trending cycles.  Near the end, we’ve highlighted an area in YELLOW where we believe a new recession will emerge.

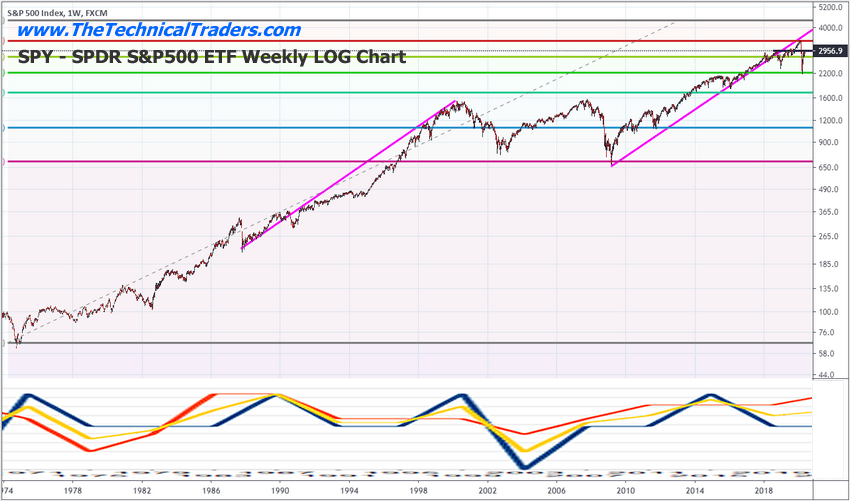
Now, as we align these cycle trends with price, we start to see a bigger picture emerge.  This SPY Weekly Log chart illustrates how our cycle analysis aligns with price trends quite well over the past 45+ years.  Our cycle research goes forward over 600 years and we can identify where and when price trends will likely set up, breakdown, or breakout as a result of our extensive cycle research.

Mr. Dalio’s comments, while somewhat valid in general scope, don’t necessarily translate into real-world processes.  With the amount of wealth and new global alliances, inter-connected economies and the recent push attempt to right the many wrongs of the past 30+ years, the world appears to be much more aligned towards restoring some proper order and developing a real future where nations are held accountable and central banks may be forced to adopt a more conservative capital process in the near future.

Without giving away too many details, our cycles are point to a very important cycle event that will take place in the near future.  Many people are completely unaware of when and how this event will take place.  In fact, many analysts are simply guessing as to what may happen over the next 20+ years whereas we’ve actually mapped out 500+ years of detailed price cycles for the global markets.

If you want to gain insight into the markets next big move or learn how our researchers attempt to stay ahead of the biggest market trends, then you owe it to yourself to visit TheTechnicalTraders.com to learn how we help our members create success and find great opportunities.

We can promise you one thing right now – the global markets are going to continue to be very interesting for technical traders over the next 10 to 20+ years.  You don’t want to miss the opportunities that are setting up in the global markets and we strongly believe everything you are reading about cycles from others is superficial in structure and content.

As a technical analyst and trader since 1997, I have been through a few bull/bear market cycles in stocks and commodities. I believe I have a good pulse on the market and timing key turning points for investing and short-term swing traders. 2020 is going to be an incredible year for skilled traders.  Don’t miss all the incredible moves and trade setups.

I hope you found this informative, and if you would like to get a pre-market video every day before the opening bell, along with my trade alerts. These simple to follow ETF swing trades have our trading accounts sitting at new high water marks yet again this week, not many traders can say that this year. Visit my Active ETF Trading Newsletter.

If you have any type of retirement account and are looking for signals when to own equities, bonds, or cash, be sure to become a member of my Long-Term Investing Signals which we issued a new signal for subscribers.

Ride my coattails as I navigate these financial markets and build wealth while others lose nearly everything they own during the next financial crisis.

Chris Vermeulen
Chief Market Strategies
Founder of Technical Traders Ltd.
TheTechnicalTraders.com

Europe’s Pandemic Dilemma

By Dan Steinbock

– In the ongoing battle against the global pandemic, belated responses will result in huge human costs and massive economic damage. In Europe, losses are climaxing in the 2nd quarter of 2020.

Before advanced economies – including those in Europe – began to flatten the epidemic curve, they fattened it for 6-8 weeks. These COVID-19 delays will prolong the global pandemic and cause secondary waves of imported infections and residual clusters both in Europe and worldwide (for the full story, see my report on the historical COVID damage: https://www.differencegroup.net/coronavirus-briefs ).

In the United States, the Trump administration’s futile effort to “protect the economy” (read: the markets) backfired disastrously. The European Union was more willing to battle the virus but was unable to do so proactively because it lacks the needed common institutions for effective response.

As the consequent political backlash will soon wash across Brussels and the continents major capitals, the EU federalists are likely to demand “more integration” to deter past policy delays in the future. In contrast, the advocates of sovereign states will insist on “less integration” to overcome the EU’s institutional deficiencies.

The current status quo – sub-optimal integration that undermines both the bloc’s and the sovereign states’ effective responses – is ridden with pitfalls.

Late mobilization in the euro area

On January 25, 2020, the European Centre for Disease Prevention and Control (ECDC) was still painting a fairly rosy picture about the virus spread: “Even if there are still many things unknown about 2019-nCoV [coronavirus], European countries have the necessary capacities to prevent and control an outbreak as soon as cases are detected,” it reported.

Yet, inadequate EU preparedness involves not just its small virus-alert agency, but delays at the highest levels of EU institutions.

In Brussels, the full continental response took a few days even longer than in the U.S., although some member states had been more proactive, and the most affected countries had to mobilize earlier.

On March 10, 2020, when Italy already had 9,200 confirmed cases and over 460 deaths, its EU ambassador Maurizio Massari pled for help. Just days later, Italian Foreign Minister Luigi Di Maio hailed the arrival of a Chinese plane loaded with medical equipment and doctors to help fight the coronavirus. “Many foreign ministers offered their solidarity and want to give us a hand … [and yet] the first aid arrived from China” said Di Maio in a pointed rebuke to the EU.

Subsequently, many European observers and policymakers suggested that Chinese aid efforts were a sinister ploy to divide Europe. What they set aside was the question why Brussels and individual European economies failed Italy at the time of its greatest need.

When the EU mobilization finally began – another two weeks after Massari’s pleas – the number of cases in Italy had soared tenfold, while the deaths had tripled.

6-8 weeks of delays

As part of the EU’s joint response to the COVID-19 outbreak, the European Parliament almost unanimously adopted three urgent proposals in an extraordinary plenary session, on March 26, 2020. Now Brussels hoped to mobilize up to €37 billion to support national health care systems, SMEs, labor markets and other vulnerable parts of its member economies. The EU also extended the EU Solidarity Fund to cover public health emergencies. The measures would make up to €800 million available for European countries in 2020.

However, the “urgent” proposals followed two months after multiple first cases in Europe and the WHO’s international emergency alert; that is, after 250,000 recorded cumulative cases and more than 14,000 cumulative deaths.

Although the European CDC had virus information after the first week of January, as did China, Hong Kong and Singapore, Brussels did not respond proactively. Nor did the EU take a stronger preemptive stance between the 1st week of January and the 30th day, when WHO chief Tedros declared the international emergency.

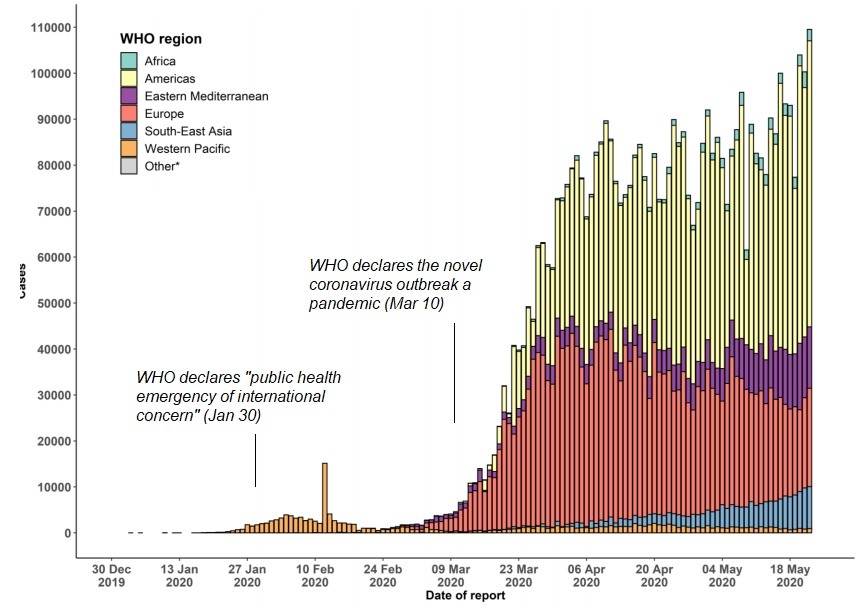
What’s even more distressing is that Brussels chose not to mobilize between January 30 and March 10, when the WHO declared the global pandemic. Instead, effective mobilization began only toward the end of March, which virtually ensured the extraordinary and protracted human costs and economic damage (Figure).

Figure   Human Costs of Coronavirus Complacency*

* Confirmed COVID-19 cases worldwide through May 23, 2020

Source: WHO, Difference Group.


European Commission President Ursula von der Leyen acknowledged that “the EU was not ready when the pandemic first began sweeping the continent, and member states did not offer enough support to hard-hit Italy.”

Despite the economic damage, the European Commission, as President Trump in the U.S., hoped to introduce early “exit strategies” to the lockdown measures, especially after Austria and Denmark announced plans to ease restrictive measures. After pressure by member states, the EC was forced to delay plans for exit.

Following the belated virus response, premature opening would have resulted in still another disaster.

Costs of complacency

Due to the belated response, prior efforts at fiscal support measures proved soon inadequate. So, by late April, European leaders gave Brussels green light for a huge €1 trillion stimulus package to ease the EU’s recovery from the coronavirus crisis.

However, markets are struggling. By year-end 2019, the Euro Stoxx 50 had recovered from 2,200 in 2012 back to 3,800; now the index is still hovering around 2,900. Despite mounting human costs and economic damage, the European Central Bank (ECB) responded only after its “emergency meeting” on March 18, 2020; that is, after 75,000 recorded cases and 11,000 deaths in Europe. That’s when the ECB moved ahead with large asset purchases and a new round of quantitative easing, while interest rate stayed at the zero-bound.

The delays in Brussels penalized severely the euro area’s annual GDP growth rate. In the 1st quarter in 2020, the bloc’s economy plunged -3.3% from a year earlier. But that was just a prelude to the expected carnage of -14.7% in the 2nd quarter.

Today, there were 2 million recorded cases and some 175,000 deaths in Europe. And by the 2nd quarter, the cases could climb to 2.4-2.7 million and deaths up to 225,000-235,000, respectively. These recorded losses are just a fraction of real losses. Without vaccination and therapies, the human costs will climb until the epidemic curves normalize, earliest by 2021.

After a disappointing start, Europe’s collective response to the coronavirus crisis was the “most impressive anywhere in the world”, said European Commission President Ursula von der Leyen in mid-April. Since the statement followed almost quarter of a year of missed opportunities, the self-congratulatory tone was not warranted.

This is the short version of an essay released by The European Financial Review (June/July), based on Dr Steinbock’s COVID-19 report

About the Author:

Dr. Dan Steinbock is an internationally recognized strategist of the multipolar world and the founder of Difference Group. He has served at the India, China and America Institute (USA), Shanghai Institutes for International Studies (China) and the EU Center (Singapore). For more, see https://www.differencegroup.net


Gold Under Pressure

By Dmitriy Gurkovskiy, Chief Analyst at RoboForex

Gold is retreating a little bit of Monday. The instrument is trading at 1728.60 USD; investors have been selling it for the second trading session in a row.

On one hand, investors are pretty inspired by the opportunity that quarantine restrictions may be removed in the near future. In this case, the most positive country is Japan, which is ready to cancel the status of emergency in five regions of the country ahead of the schedule. This positive moment indicates that the coronavirus pandemic is slowing down.

On the other hand, Gold can’t correct too much because there is a growing opportunity of another geopolitical conflict between the USA and China due to a new security law, which may interfere with the rights and freedom of the Hong Kong population. Risks are increasing as the White House may start to get involved in the situation.

Physical demand for Gold is rather moderate so far – this aspect provides neither support no risks.

As we can see in the H4 chart, XAU/USD is forming a wide consolidation range around 1737.00; right now, it is trading below this level and may continue falling towards 1710.10 as a correction. In general, the pair is forming a Flag pattern. After reaching the above-mentioned level, the price may start a new growth to reach 1800.00. From the technical point of view, this scenario is confirmed by MACD Oscillator: its signal line has broken 0 to the downside and is steadily moving within the negative histogram area, thus indicating further decline on the price chart. If the line leaves the area, the correction may be over.

In the H1 chart, after breaking 1730.00 downwards, XAU/USD is still falling; right now, it is trading to break the consolidation range at 1723.70 to the downside. Possibly, the pair may correct towards 1727.70 and then resume trading downwards to break 1715.00. Later, the market may continue moving inside the downtrend to reach 1710.10. From the technical point of view, this scenario is confirmed by Stochastic Oscillator: its signal line is moving to rebound from 20 upwards and then reach 50 again. After rebounding from 50 downwards, the line may return to 20.

Disclaimer

Any predictions contained herein are based on the authors’ particular opinion. This analysis shall not be treated as trading advice. RoboForex shall not be held liable for the results of the trades arising from relying upon trading recommendations and reviews contained herein.


Fibonacci Retracements Analysis 25.05.2020 (GOLD, USDCHF)

Article By RoboForex.com

XAUUSD, “Gold vs US Dollar”

As we can see in the H4 chart, after breaking the consolidation range and updating the high, XAUUSD is falling. The next upside targets were inside the post-correctional extension area between 138.2% and 161.8% fibo at 1798.90 and 1858.60 respectively, but the pair decided to test the previously-broken area. At the same time, there is a divergence on MACD, which indicates a possible correction towards 23.6%, 38.2%, and 50.0% fibo at 1690.70, 1645.40, and 1607.83 respectively.

GOLD_H4
Risk Warning: the result of previous trading operations do not guarantee the same results in the future

In the H1 chart, the pair is falling towards 23.6% fibo at 1690.70. The resistance is the high 1764.86.

GOLD
Risk Warning: the result of previous trading operations do not guarantee the same results in the future

USDCHF, “US Dollar vs Swiss Franc”

As we can see in the H4 chart, USDCHF continues the long-running correction between 38.2% and 61.8% fibo in the form of a Triangle inside a Flat. If the price breaks the resistance at 0.9743, the pair may continue growing to reach the high at 0.9901. Otherwise, the instrument may break the support at 0.9648 and then continue falling to reach 61.8% fibo at 0.9453.

USDCHF_H4
Risk Warning: the result of previous trading operations do not guarantee the same results in the future

In the H1 chart, the asset is correcting to the upside. After reaching 61.8% fibo, the correction has stopped. However, after a short-term pullback the instrument may rise to reach 76.0% fibo at 0.9749 and the high at 0.9784. The support is the low at 0.9638.

USDCHF_H1

Article By RoboForex.com

Attention!
Forecasts presented in this section only reflect the author’s private opinion and should not be considered as guidance for trading. RoboForex LP bears no responsibility for trading results based on trading recommendations described in these analytical reviews.

Forex Technical Analysis & Forecast 25.05.2020

Article By RoboForex.com

EURUSD, “Euro vs US Dollar”

EURUSD is still trading downwards to reach 1.0880. After reaching it, the pair may start consolidating. If later the price breaks this range to the upside, the market may correct towards 1.0915; if to the downside – resume trading inside the downtrend with the target at 1.0825.

EURUSD
Risk Warning: the result of previous trading operations do not guarantee the same results in the future

GBPUSD, “Great Britain Pound vs US Dollar”

After reaching the predicted downside target at 1.2170, GBPUSD is consolidating around this level. Possibly, the pair may fall towards 1.2155. However, if the price breaks 1.2190 to the upside, the market may form one more ascending structure to reach 1.2222 and then resume trading downwards with the target at 1.2070.

GBPUSD
Risk Warning: the result of previous trading operations do not guarantee the same results in the future

USDRUB, “US Dollar vs Russian Ruble”

USDRUB is correcting to the upside towards 72.15. Later, the market may resume trading inside the downtrend with the short-term target at 69.50.

USDRUB
Risk Warning: the result of previous trading operations do not guarantee the same results in the future

USDJPY, “US Dollar vs Japanese Yen”

After finishing the ascending structure at 107.70, USDJPY is expected to start another decline to break 107.25. After that, the instrument may continue falling with the short-term target at 106.66.

USDJPY
Risk Warning: the result of previous trading operations do not guarantee the same results in the future

USDCHF, “US Dollar vs Swiss Franc”

USDCHF is consolidating around 0.9717. According to the main scenario, the price is expected to continue growing towards 0.9737. Later, the market may start a new correction to reach 0.9669 and then form one more ascending structure with the target at 0.9750.

USDCHF
Risk Warning: the result of previous trading operations do not guarantee the same results in the future

AUDUSD, “Australian Dollar vs US Dollar”

After reaching the correctional target at 0.6545, AUDUSD is expected to form a new descending structure towards 0.6478. Later, the market may start another correction to reach 0.6500 and then resume trading downwards with the target at 0.6444.

AUDUSD
Risk Warning: the result of previous trading operations do not guarantee the same results in the future

BRENT

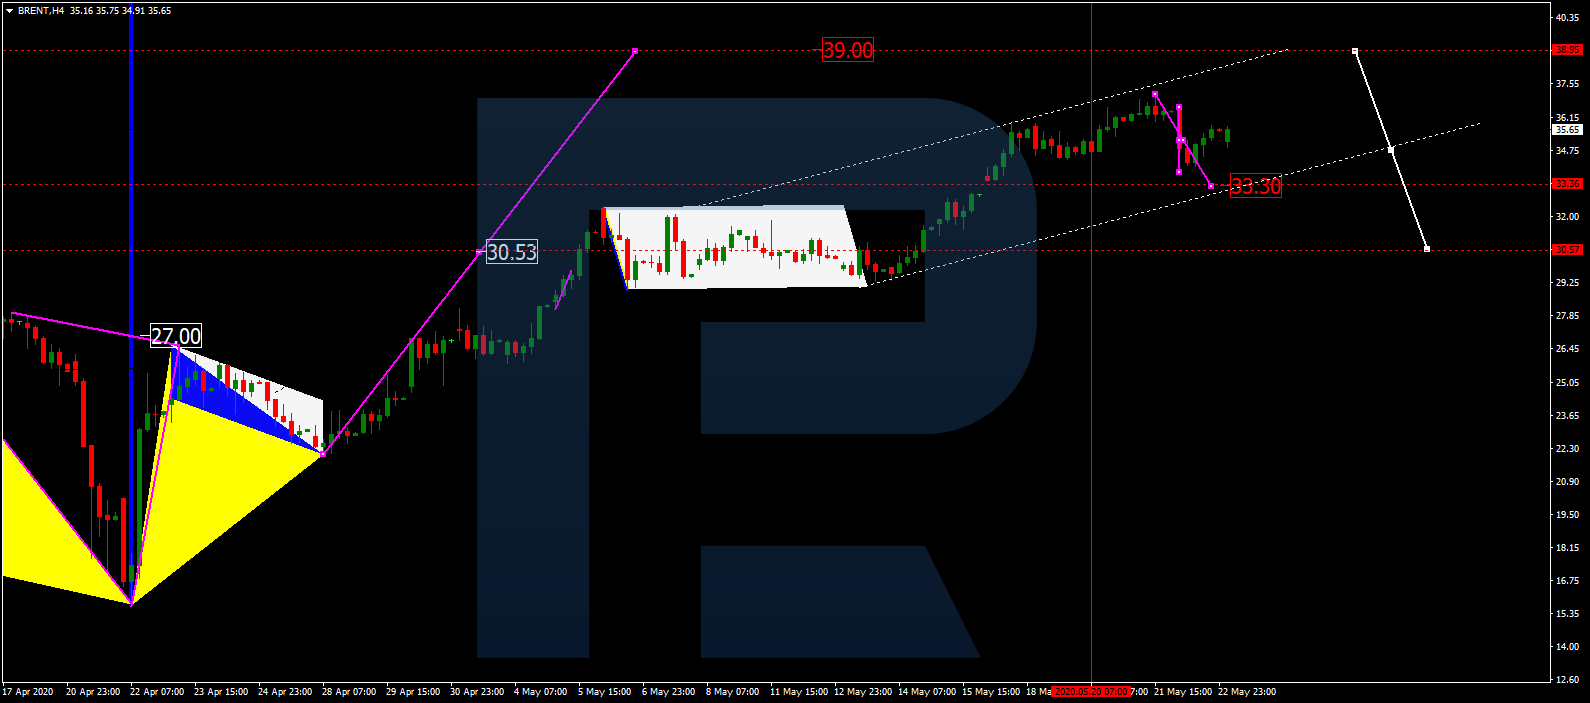
Brent is still consolidating around 35.15. Possibly, today the pair may expand the range down to 33.33 and then resume trading upwards with the short-term target at 39.00.

BRENT
Risk Warning: the result of previous trading operations do not guarantee the same results in the future

XAUUSD, “Gold vs US Dollar”

After finishing the correctional wave at 1737.20, Gold is expected to form a new descending structure to break 1724.95. After that, the instrument may continue falling towards 1710.10 and then start another growth with the target at 1750.00.

GOLD
Risk Warning: the result of previous trading operations do not guarantee the same results in the future

BTCUSD, “Bitcoin vs US Dollar”

After rebounding from 9290.00 downwards and finishing another correctional structure at 8700.00, BTCUSD is expected to start a new growth to break 9300.00. Later, the market may continue trading upwards with the target at 9800.00.

BITCOIN
Risk Warning: the result of previous trading operations do not guarantee the same results in the future

S&P 500

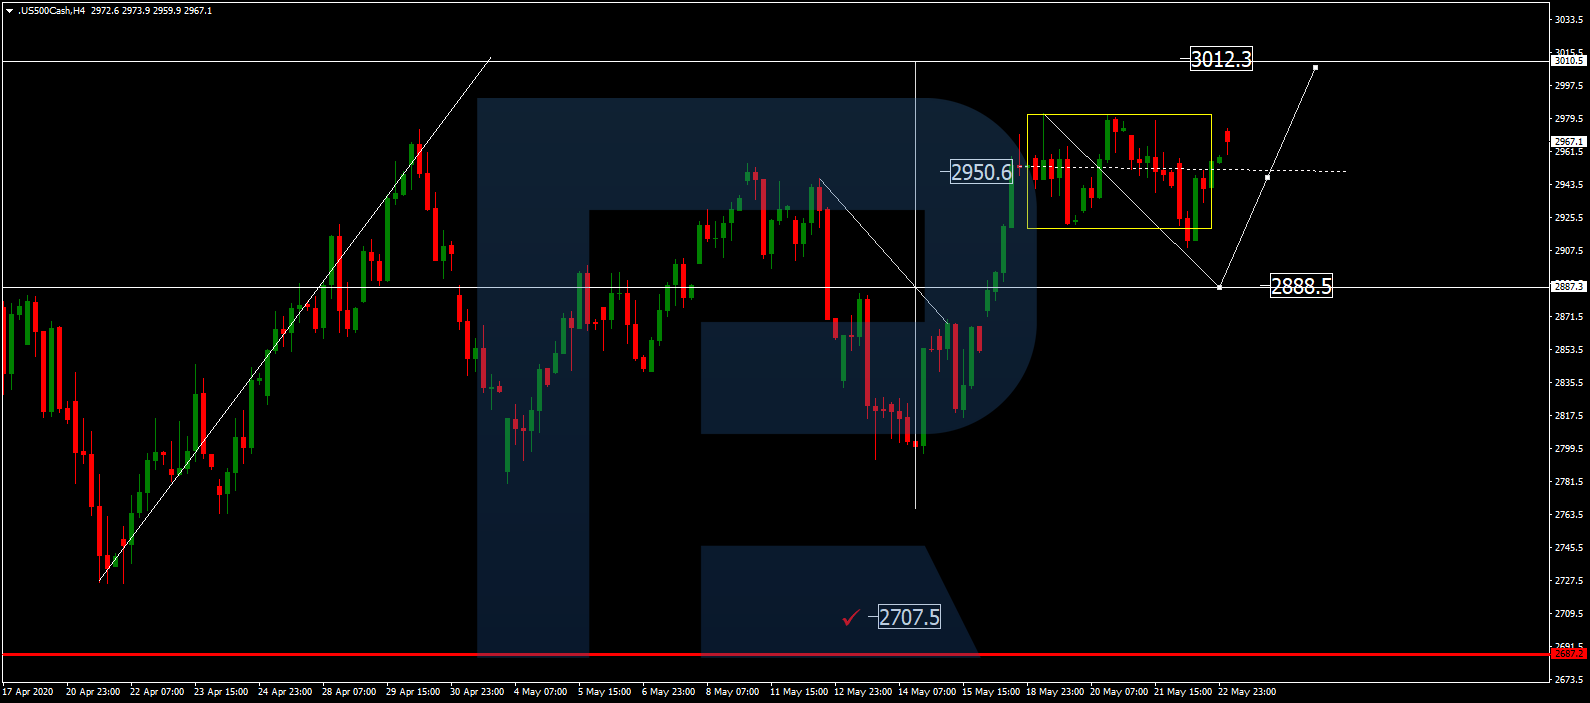
After failing to break 2900.0 downwards, the Index has rebounded to the upside; right now, it is growing to reach 2980.0. Possibly, today the pair may break this level and then continue trading upwards with the target at 3012.3.

S&P 500

Article By RoboForex.com

Attention!
Forecasts presented in this section only reflect the author’s private opinion and should not be considered as guidance for trading. RoboForex LP bears no responsibility for trading results based on trading recommendations described in these analytical reviews.

The Analytical Overview of the Main Currency Pairs on 2020.05.25

by JustForex

The EUR/USD currency pair

Technical indicators of the currency pair:
  • Prev Open: 1.09493
  • Open: 1.08955
  • % chg. over the last day: -0.44
  • Day’s range: 1.08707 – 1.09087
  • 52 wk range: 1.0777 – 1.1494

Sales prevail on the EUR/USD currency pair. The trading instrument has updated local lows. Demand for risky assets is still low enough amid rising tensions between the US and China. At the moment, EUR/USD quotes are testing the support level of 1.0870. The 1.0910 mark is already a “mirror” resistance. We expect economic releases from Germany. We recommend opening positions from key levels.

The Economic News Feed for 25.05.2020:

Germany’s GDP fell by 2.2% (q/q) in the first quarter, which met market expectations.

At 09:00 (GMT+3:00), the German IFO business climate index will be published.

EUR/USD

Indicators do not give accurate signals: the price has crossed 100 MA.

The MACD histogram is in the negative zone and continues to decline, which gives a strong signal to sell EUR/USD.

Stochastic Oscillator is in the oversold zone, the %K line has crossed the %D line. There are no signals at the moment.

Trading recommendations
  • Support levels: 1.0870, 1.0840, 1.0800
  • Resistance levels: 1.0910, 1.0940, 1.0975

If the price fixes below 1.0870, a further drop in EUR/USD quotes is expected. The movement is tending to 1.0840-1.0820.

An alternative could be the growth of EUR/USD quotes to 1.0930-1.0960.

The GBP/USD currency pair

Technical indicators of the currency pair:
  • Prev Open: 1.22153
  • Open: 1.21726
  • % chg. over the last day: -0.47
  • Day’s range: 1.21647 – 1.21917
  • 52 wk range: 1.1466 – 1.3516

The GBP/USD currency pair is consolidating. The technical pattern is ambiguous. The British pound is testing local support and resistance levels: 1.2160 and 1.2210, respectively. Financial market participants expect additional drivers. The tension between Washington and Beijing has come to the fore again. We recommend opening positions from key levels.

GBP/USD

Indicators signal the power of sellers: the price has fixed below 50 MA and 100 MA.

The MACD histogram is in the negative zone, indicating the bearish sentiment.

Stochastic Oscillator is in the neutral zone, the %K line has crossed the %D line. There are no signals at the moment.

Trading recommendations
  • Support levels: 1.2160, 1.2120, 1.2075
  • Resistance levels: 1.2210, 1.2245, 1.2290

If the price fixes below 1.2160, a further drop in GBP/USD quotes is expected. The movement is tending to the round level of 1.2100.

An alternative could be the growth of the GBP/USD currency pair to 1.2240-1.2280.

The USD/CAD currency pair

Technical indicators of the currency pair:
  • Prev Open: 1.39549
  • Open: 1.39882
  • % chg. over the last day: +0.30
  • Day’s range: 1.39789 – 1.40078
  • 52 wk range: 1.2949 – 1.4668

There is an ambiguous technical pattern on the USD/CAD currency pair. The loonie is currently consolidating. The local support and resistance levels are 1.3980 and 1.4020, respectively. Investors expect additional drivers. We recommend paying attention to the dynamics of oil quotes. Positions should be opened from key levels.

We recommend paying attention to the speech by the Governor of the Bank of Canada Poloz.

USD/CAD

Indicators do not give accurate signals: the price has fixed between 50 MA and 100 MA.

The MACD histogram is near the 0 mark.

Stochastic Oscillator is in the neutral zone, the %K line has crossed the %D line. There are no signals at the moment.

Trading recommendations
  • Support levels: 1.3980, 1.3960, 1.3910
  • Resistance levels: 1.4020, 1.4050, 1.4085

If the price fixes below 1.3980, a further drop in USD/CAD quotes is expected. The movement is tending to 1.3940-1.3920.

An alternative could be the growth of the USD/CAD currency pair to 1.4050-1.4080.

The USD/JPY currency pair

Technical indicators of the currency pair:
  • Prev Open: 107.634
  • Open: 107.572
  • % chg. over the last day: -0.03
  • Day’s range: 107.541 – 107.780
  • 52 wk range: 101.19 – 112.41

The USD/JPY currency pair continues to consolidate. The technical pattern is ambiguous. Currently, the local support and resistance levels are 107.60 and 107.85, respectively. The conflict between the US and China is in the spotlight. Demand for “safe haven” currencies is still at a fairly high level. Positions should be opened from key levels.

Today, the news feed on Japan’s economy is calm.

USD/JPY

Indicators do not give accurate signals: the price has crossed 50 MA.

The MACD histogram has started rising, indicating the bullish sentiment.

Stochastic Oscillator is in the neutral zone, the %K line is above the %D line, which gives a signal to buy USD/JPY.

Trading recommendations
  • Support levels: 107.60, 107.35, 107.10
  • Resistance levels: 107.85, 108.05

If the price fixes above 107.85, USD/JPY quotes are expected to rise. The movement is tending to 108.10-108.30.

An alternative could be a decrease in the USD/JPY currency pair to 107.40-107.20.

by JustForex

The Greenback Is Growing. Trading Activity Has Reduced due to Holidays

by JustForex

The US currency is rising again relative to a basket of currency majors. The US dollar index (#DX) closed in the positive zone (+0.49%) on Friday. The tension between the United States and China is in the spotlight after China announced its intention to consider the Hong Kong national security law. White House officials, in turn, said that the law could lead to US sanctions, which would further damage strained relations between countries.

The single currency is under pressure after the release of the last ECB meeting account, which was published on Friday. According to the protocol, the leadership of the Central Bank does not count on a quick recovery of the Eurozone economy after the crisis caused by the COVID-19 pandemic. Also, the regulator should be ready to adjust the bond and other instruments purchase program if the introduced incentive measures are not enough to restore the economy.

The “black gold” prices have become stable after a prolonged rally. Currently, WTI crude oil futures are testing the $33.45 mark per barrel.

Market indicators

On Friday, there was a variety of trends in the US stock market: #SPY (+0.19%), #DIA (-0.06%), #QQQ (-0.35%).

The 10-year US government bonds are consolidating. At the moment, the indicator is at the level of 0.65-0.66%.

The news feed on 2020.05.25:
  • – German GDP data at 09:00 (GMT+3:00);
    – German IFO business climate index at 11:00 (GMT+3:00).


UK financial markets will be closed due to Bank holidays, and US markets – due to Memorial Day.

by JustForex

RoboForex Adds New Cryptocurrency Pairs and Improves Conditions for Trading Digital Assets

May, 25th, 2020

Limassol, Cyprus

RoboForex, an international financial broker, increases the list of cryptocurrency pairs available for trading by adding ETH/BTC and LTC/BTC. Apart from this, the broker has significantly improved trading conditions for clients who use Pro-Standard and ECN accounts.

Until now, RoboForex clients who trade cryptocurrencies through MetaTrader 4 and MetaTrader 5 trading platforms could use only those cryptocurrency pairs that included fiat currencies, such as BTC/USD, ETH/USD, XRP/USD, LTC/USD, BCH/USD, EOS/USD, BTC/EUR, and ETH/EUR. From now on, the list will offer two more assets, which consist only of cryptocurrencies, ETH/BTC and LTC/BTC. These instruments are already available in MT4 and MT5 terminals.

In addition to the expansion of the list of available assets, RoboForex has improved conditions for trading digital currencies. The Company has significantly reduced spreads for trading cryptocurrencies on Pro-Standard accounts and decreased the commission for operations involving cryptoassets by 1.5 times on ECN ones.

Denis Golomedov, Chief Marketing Officer at RoboForex, is commenting: “We’ve added new instruments, which our clients wanted so much. Like I said earlier, a considerable part of them trade cryptocurrencies and we believe this area has great potential. To make our services more comfortable and attractive to clients, we’ve also improved conditions for trading cryptocurrencies for some of our account types, where we’ve decreased spreads and commissions. We’re not going to stop here and will consistently realize our plans involving new products and improvements in the interests of our clients.”

About RoboForex

RoboForex is a company, which delivers brokerage services. The company provides traders, who work on financial markets, with access to its proprietary trading platforms. RoboForex Ltd has the brokerage license IFSC/60/271/TS. More detailed information about the Company’s products and activities can be found on the official website at roboforex.com.


DAX30 bulls losing steam, but still in charge of the action – for now

By Admiral Markets

Source: Economic Events May 25, 2020 – Admiral Markets’ Forex Calendar

While the start into the week will probably be a bit slow in Equities given the US bank holiday “Memorial Day” (modified trading hours for Monday, May 25 can be found here), it still makes a lot of sense to give the DAX30 a close look with an eye on the upcoming days.

While the German DAX30 began with massive gains last week, driven by the comments from Fed chairman Powell on CBS’ “60 Minutes” and Merkel’s and Macron’s proposal of a 500 billion EU recovery fund that would offer grants to European Union regions and sectors hit hardest by the coronavirus pandemic, the German index lost some of its bullishness into the last weekly close.

In fact, on H1 a bearish divergence developed in the RSI(14), pointing to at least some diminishing bearish momentum.

Indeed, one could consider this divergence as confirmed after the drop below 11,000 points and now opening further bearish potential as low as 10,500/550 points in the days to come.

If DAX bulls can on the other hand re-capture 11,000 points and the bullish momentum continues over the next days, a break above the April highs around 11,350 points makes a re-test of the SMA(200) around 12,000/050 points a realistic option.

Source: Admiral Markets MT5 with MT5-SE Add-on DAX30 CFD Hourly chart (between May 5, 2020, to May 22, 2020). Accessed: May 22, 2020, at 10:00pm GMT

Source: Admiral Markets MT5 with MT5-SE Add-on DAX30 CFD Daily chart (between February 5, 2019, to May 22, 2020). Accessed: May 22, 2020, at 10:00pm GMT – Please note: Past performance is not a reliable indicator of future results, or future performance.

In 2015, the value of the DAX30 CFD increased by 9.56%, in 2016, it increased by 6.87%, in 2017, it increased by 12.51%, in 2018, it fell by 18.26%, in 2019, it increased by 26.44% meaning that after five years, it was up by 34.2%.

Check out Admiral Markets’ most competitive conditions on the DAX30 CFD and start trading on the DAX30 CFD with a low 0.8 point spread offering during the main Xetra trading hours!

Discover the world’s #1 multi-asset platform

Admiral Markets offers professional traders the ability to trade with a custom, upgraded version of MetaTrader 5, allowing you to experience trading at a significantly higher, more rewarding level. Experience benefits such as the addition of the Market Heat Map, so you can compare various currency pairs to see which ones might be lucrative investments, access real-time trading data, and so much more. Click the banner below to start your FREE download of MT5 Supreme Edition!

Download MetaTrader 5 and begin trading today!

Disclaimer: The given data provides additional information regarding all analysis, estimates, prognosis, forecasts or other similar assessments or information (hereinafter “Analysis”) published on the website of Admiral Markets. Before making any investment decisions please pay close attention to the following:

  1. This is a marketing communication. The analysis is published for informative purposes only and are in no way to be construed as investment advice or recommendation. It has not been prepared in accordance with legal requirements designed to promote the independence of investment research, and that it is not subject to any prohibition on dealing ahead of the dissemination of investment research.
  2. Any investment decision is made by each client alone whereas Admiral Markets shall not be responsible for any loss or damage arising from any such decision, whether or not based on the Analysis.
  3. Each of the Analysis is prepared by an independent analyst (Jens Klatt, Professional Trader and Analyst, hereinafter “Author”) based on the Author’s personal estimations.
  4. To ensure that the interests of the clients would be protected and objectivity of the Analysis would not be damaged Admiral Markets has established relevant internal procedures for prevention and management of conflicts of interest.
  5. Whilst every reasonable effort is taken to ensure that all sources of the Analysis are reliable and that all information is presented, as much as possible, in an understandable, timely, precise and complete manner, Admiral Markets does not guarantee the accuracy or completeness of any information contained within the Analysis. The presented figures refer that refer to any past performance is not a reliable indicator of future results.
  6. The contents of the Analysis should not be construed as an express or implied promise, guarantee or implication by Admiral Markets that the client shall profit from the strategies therein or that losses in connection therewith may or shall be limited.
  7. Any kind of previous or modeled performance of financial instruments indicated within the Publication should not be construed as an express or implied promise, guarantee or implication by Admiral Markets for any future performance. The value of the financial instrument may both increase and decrease and the preservation of the asset value is not guaranteed.
  8. The projections included in the Analysis may be subject to additional fees, taxes or other charges, depending on the subject of the Publication. The price list applicable to the services provided by Admiral Markets is publicly available from the website of Admiral Markets.

Leveraged products (including contracts for difference) are speculative in nature and may result in losses or profit. Before you start trading, you should make sure that you understand all the risks.

By Admiral Markets

Why Bear-Market Rallies Are So Tricky

By Elliott Wave International

– Many stock market investors believe that prices have already bottomed. Numerous banks, brokers and financial firms have issued statements saying as much.

Indeed, the May Elliott Wave Theorist, a monthly publication which has offered analysis of financial and social trends since 1979, noted:

On April 28, Bloomberg interviewed four money managers to answer the question of “Where to Invest $1 Million Right Now.” Cash was not mentioned.

All these professional financial observers might be right in their assessment that the bottom is in for stocks.

Then again, the stock market rise since the March 23 low might be a bear-market rally.

If so, it certainly has “done its job,” meaning, as one of our global analysts put it in Elliott Wave International’s May Global Market Perspective (a monthly publication which covers 40+ worldwide markets):

The job of [the first, big bear-market] rally is to recreate the optimism that existed at the previous highs.

One particular sentiment that the rally has “recreated” is known by the acronym FOMO, which stands for the “fear of missing out.”

A little background: Toward the end of 2019, the FOMO sentiment was prevalent. Indeed, our December 2019 Elliott Wave Financial Forecast (a monthly, U.S.-focused publication which covers stocks, bonds, gold, silver, the U.S. dollar, the economy and more) showed this chart and said:

Last week, the percentage of bulls polled in Investors Intelligence Advisors’ Survey rose to 58.1, a new 13-month extreme. … Last month we talked about the return of FOMO, the fear of missing out on stock gains; its last major outbreak occurred as stocks approached their January 2018 highs. In November, FOMO became far more entrenched. One Bloomberg commentator called it “the age-old fear of missing out” and stated, “The end of the year is coming, when investment managers will be judged on their performance. Those who are behind have an incentive to clamber into the market now, while there is still time.” In our experience, “to clamber” is generally not a sound investment strategy.

As you know, it wasn’t long thereafter that the stock market topped. The major price moves downward were historic.

Even so, the “fear of missing out” sentiment has returned — again.

Here’s an April 7 Bloomberg headline:

FOMO Overwhelms Stock Traders Who Have Begun Ignoring the Risks

Our May Elliott Wave Financial Forecast provides more insight:

According to Google News, the number of articles referencing FOMO and “stock market” increased from 227 in December 2019 to 244 in February 2020, right through the peak in the market. In March, the market’s decline was well established, still the FOMO news count rose to 267.

So, yes, the rally has indeed “recreated” the prior optimism. One might even argue that the level of optimism is now even higher.

So, should investors take the stance that the bottom is in – or, proceed with extreme caution?

Knowledge of the stock market’s Elliott wave pattern will help you to answer that question.

As the Wall Street classic book, Elliott Wave Principle: Key to Market Behavior, by Frost & Prechter, notes:

The primary value of the Wave Principle is that it provides a context for market analysis. This context provides both a basis for disciplined thinking and a perspective on the market’s general position and outlook.

You can read the entire, online version of Elliott Wave Principle: Key to Market Behavior, free!

You only need a Club EWI membership, which is also free. Club EWI is the world’s largest educational Elliott wave community and allows you to get Elliott wave insights on investing and trading, the economy and social trends that you will not find anywhere else.

This link gets you started: Elliott Wave Principle: Key to Market Behavior, 100% free.

<!>

This article was syndicated by Elliott Wave International and was originally published under the headline Why Bear-Market Rallies Are So Tricky. EWI is the world’s largest market forecasting firm. Its staff of full-time analysts led by Chartered Market Technician Robert Prechter provides 24-hour-a-day market analysis to institutional and private investors around the world.