Author Archive for InvestMacro – Page 31

Tiny plankton drive processes in the ocean that capture twice as much carbon as scientists thought

By Ken Buesseler, Woods Hole Oceanographic Institution

The Research Brief is a short take about interesting academic work.

The big idea

The ocean plays a major role in the global carbon cycle. The driving force comes from tiny plankton that produce organic carbon through photosynthesis, like plants on land.

When plankton die or are consumed, a set of processes known as the biological carbon pump carries sinking particles of carbon from the surface to the deep ocean in a process known as marine snowfall. Naturalist and writer Rachel Carson called it the “most stupendous snowfall on Earth.”

Some of this carbon is consumed by sea life, and a portion is chemically broken down. Much of it is carried to deep waters, where it can remain for hundreds to thousands of years. If the deep oceans didn’t store so much carbon, the Earth would be even warmer than it is today.

Ocean carbon storage is driven by phytoplankton blooms, like the turquoise swirls visible here in the North Sea and waters off Denmark. NASA

In a recent study, I worked with colleagues from the U.S., Australia and Canada to understand how efficiently the biological pump captures carbon as part of this marine snowfall. Past efforts to answer this question often measured marine snowfall at a set reference depth, such as 450 feet (150 meters). In contrast, we paid closer attention to the depth of something called the euphotic zone. This is the ocean layer close to the surface, where enough light penetrates for photosynthesis to happen.

We accounted more accurately for how deep the euphotic zone extends by using chlorophyll sensors, which indicate the presence of plankton. This approach revealed that the sunlit zone extends farther down in some regions of the ocean than in others. Taking this new information into account, we estimate that the biological pump carries twice as much heat-trapping carbon down from the surface ocean than previously thought.

A recent study shows that scientists have drastically underestimated how efficiently the ocean’s biological pump moves carbon from the surface to deep waters.

Why it matters

The biological pump phenomenon takes place over the entire ocean. That means that even small changes in its efficiency could significantly change atmospheric carbon dioxide levels and, as a result, global climate.

Moreover, light penetration varies regionally and seasonally throughout the oceans. It’s key to understand those differences so that ocean scientists can incorporate biological processes into better global climate models.

We also considered another ocean phenomenon that involves the largest animal migration on Earth. It’s called diel vertical migration, and happens around the globe. Every 24 hours, a massive wave of plankton and fish ascend from the twilight zone to feed at night at the surface, then descend back to darker waters in daytime.

Scientists think this process moves a lot of carbon from the surface to deeper waters. Our study suggests that the amount of carbon carried by these daily migrations must also be measured at the same boundary where light disappears, so that scientists can directly compare the marine snowfall to the active migration.
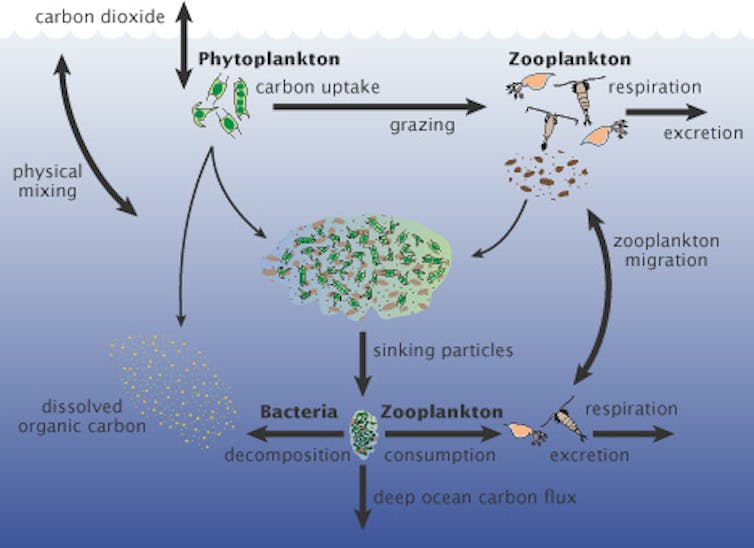
Phytoplankton in the ocean consume carbon dioxide as they photosynthesize. When they are eaten or decompose, some of the carbon they contain falls into the ocean depths via a process called the biological pump.
U.S. JGOFS

How we did it

For this study, we reviewed previous research on the biological pump. To compare results, we first determined how deep the sunlit region extended. We found this boundary at the depth where it became too dark to see any more chlorophyll pigments, which mark the presence of marine phytoplankton layers. Across the studies, that depth varied between 100 and 550 feet (30 to 170 meters).

Next, we estimated how much organic carbon sank into deeper waters in these studies, and measured how much remained in particles that sank another 330 feet (100 meters) deeper into the twilight zone. Many creatures live and feed in these deep waters, including fish, squid, worms and jellyfish. Some of them consume sinking carbon particles, reducing the amount of marine snowfall.

Comparing these two numbers gave us an estimate of how efficiently the biological pump was moving carbon into deep waters. The studies that we reviewed produced a wide range of values. Overall, we calculated that the biological pump was capturing twice as much carbon as previous studies that did not take into account the wide range of light penetration depths. Regional patterns also changed: Areas with shallow light penetration accounted for a higher percentage of carbon removal than areas with deeper light penetration.

The ocean twilight zone may hold more life than all of Earth’s fisheries combined, and up to 1 million undiscovered species.

What still isn’t known

Our study reveals that scientists need to use using a more systematic approach to defining the ocean’s vertical boundaries for organic carbon production and loss. This finding is timely, because the international oceanographic community is calling for more and better studies of the biological carbon pump and the ocean twilight zone.

The twilight zone could be profoundly affected if nations seek to develop new midwater fisheries, mine the seafloor for minerals or use it as a dumping ground for waste. Scientists are forming a collaborative effort called the Joint Exploration of the Twilight Zone Ocean Network, or JETZON, to set research priorities, promote new technologies and better coordinate twilight zone studies.

To compare these studies, researchers need a common set of metrics. For the biological carbon pump, we need to better understand how big this flow of carbon is, and how efficiently it is transported into deeper water for long-term storage. These processes will affect how Earth responds to rising greenhouse gas emissions and the warming they cause.

About the Author:

Ken Buesseler, Senior Scientist, Woods Hole Oceanographic Institution

This article is republished from The Conversation under a Creative Commons license. Read the original article.


Russia: How Financial “Complacency” Morphed into “Crisis”

By Elliott Wave International

– It’s been a tough year for Russia financially.

Of course, there’s been the big collapse in oil prices, plus — just like many other global stock indexes — Russian stocks are well off their highs.

That’s quite in contrast to 2019, when the RTSI index, a U.S. dollar-based index of 50 Russian companies, climbed 29%.

Shortly after registering that performance, Elliott Wave International’s January Global Market Perspective, a monthly publication which covers 40-plus worldwide markets, showed this chart and said:

Complacency toward financial risk stands at unprecedented extremes.

Our global analyst’s comment suggested that a change of trend was afoot, given that extremes in financial markets are akin to a rubber band that is stretched to the breaking point.

Well, here’s an update on the RTSI from the just-published June Global Market Perspective. An EWI global analyst notes:

The RTSI index … did worse than Europe’s broader indexes, losing more than half of its value from February to March. The stunning crash was followed by [a] rally that has since retraced about 50% of the decline.

In addition to stock prices being well off their highs, Russia’s economic output will contract at 6% this year and the jobless number is expected to double.

Plus, in April, the government projected that the budget deficit will hit 4% of GDP.

As the June Global Market Perspective also notes:

Russia’s last financial crisis in 2014-15 also came on the heels of a decline in oil prices, and the crisis culminated on December 15, 2014, when the ruble suddenly plummeted against the euro and dollar. … Russia is entering its current crisis from a much weaker financial position.

So, does this mean that the rally in Russian stocks is nearly over, or might the RTSI index climb the proverbial “wall of worry”?

Well, a March 27 Barron’s headline suggests that investors will eventually be rewarded:

Russia’s Stocks Are a Buy Only for Very Patient Investors

Elliott Wave International’s global analysts provide their own perspective on the big financial picture, yet they are also focused on what’s next for Russia financially and economically — as well as many other worldwide markets.

Indeed, EWI has recently published the valuable, free resource: 5 Global Insights You Need to Watch.

You see, EWI’s top 5 global experts share their latest forecasts for cryptocurrencies, crude oil, interest rates, deflation, and the futures of the European Union.

The result is a 5-video series (plus, two quick reads) — all in just 13 minutes.

And — you get it free with a fast Club EWI signup. Club EWI membership is also free.

Follow this link to get started: 5 Global Insights You Need to Watch.

This article was syndicated by Elliott Wave International and was originally published under the headline Russia: How Financial “Complacency” Morphed into “Crisis”. EWI is the world’s largest market forecasting firm. Its staff of full-time analysts led by Chartered Market Technician Robert Prechter provides 24-hour-a-day market analysis to institutional and private investors around the world.


Physicists hunt for room-temperature superconductors that could revolutionize the world’s energy system

By Pegor Aynajian, Binghamton University, State University of New York

Waste heat is all around you. On a small scale, if your phone or laptop feels warm, that’s because some of the energy powering the device is being transformed into unwanted heat.

On a larger scale, electric grids, such as high power lines, lose over 5% of their energy in the process of transmission. In an electric power industry that generated more than US$400 billion in 2018, that’s a tremendous amount of wasted money.

Globally, the computer systems of Google, Microsoft, Facebook and others require enormous amounts of energy to power massive cloud servers and data centers. Even more energy, to power water and air cooling systems, is required to offset the heat generated by these computers.

Where does this wasted heat come from? Electrons. These elementary particles of an atom move around and interact with other electrons and atoms. Because they have an electric charge, as they move through a material – like metals, which can easily conduct electricity – they scatter off other atoms and generate heat.

Superconductors are materials that address this problem by allowing energy to flow efficiently through them without generating unwanted heat. They have great potential and many cost-effective applications. They operate magnetically levitated trains, generate magnetic fields for MRI machines and recently have been used to build quantum computers, though a fully operating one does not yet exist.

But superconductors have an essential problem when it comes to other practical applications: They operate at ultra-low temperatures. There are no room-temperature superconductors. That “room-temperature” part is what scientists have been working on for more than a century. Billions of dollars have funded research to solve this problem. Scientists around the world, including me, are trying to understand the physics of superconductors and how they can be enhanced.

Understanding the mechanism

A superconductor is a material, such as a pure metal like aluminum or lead, that when cooled to ultra-low temperatures allows electricity to move through it with absolutely zero resistance. How a material becomes a superconductor at the microscopic level is not a simple question. It took the scientific community 45 years to understand and formulate a successful theory of superconductivity in 1956.

While physicists researched an understanding of the mechanisms of superconductivity, chemists mixed different elements, such as the rare metal niobium and tin, and tried recipes guided by other experiments to discover new and stronger superconductors. There was progress, but mostly incremental.

Simply put, superconductivity occurs when two electrons bind together at low temperatures. They form the building block of superconductors, the Cooper pair. Elementary physics and chemistry tell us that electrons repel each other. This holds true even for a potential superconductor like lead when it is above a certain temperature.

When the temperature falls to a certain point, though, the electrons become more amenable to pairing up. Instead of one electron opposing the other, a kind of “glue” emerges to hold them together.

Keeping matter cool

Discovered in 1911, the first superconductor was mercury (Hg), the basic element of old-fashioned thermometers. In order for mercury to become a superconductor, it had to be cooled to ultra-low temperatures. Kamerlingh Onnes was the first scientist who figured out exactly how to do that – by compressing and liquefying helium gas. During the process, once helium gas becomes a liquid, the temperature drops to -452 degrees Fahrenheit.

When Onnes was experimenting with mercury, he discovered that when it was placed inside a liquid helium container and cooled to very low temperatures, its electric resistance, the opposition of the electric current in the material, suddenly dropped to zero ohms, a unit of measurement that describes resistance. Not close to zero, but zero exactly. No resistance, no heat waste.

This meant that an electric current, once generated, would flow continuously with nothing to stop it, at least in the lab. Many superconducting materials were soon discovered, but practical applications were another matter.

These superconductors shared one problem – they needed to be cooled down. The amount of energy needed to cool a material down to its superconducting state was too expensive for daily applications. By the early 1980s, the research on superconductors had nearly reached its conclusion.

A surprising discovery

In a dramatic turn of events, a new kind of superconductor material was discovered in 1987 at IBM in Zurich, Switzerland. Within months, superconductors operating at less extreme temperatures were being synthesized globally. The material was a kind of a ceramic.

These new ceramic superconductors were made of copper and oxygen mixed with other elements such as lanthanum, barium and bismuth. They contradicted everything physicists thought they knew about making superconductors. Researchers had been looking for very good conductors, yet these ceramics were nearly insulators, meaning that very little electrical current can flow through. Magnetism destroyed conventional superconductors, yet these were themselves magnets.

Scientists were seeking materials where electrons were free to move around, yet in these materials, the electrons were locked in and confined. The scientists at IBM, Alex Müller and Georg Bednorz, had actually discovered a new kind of superconductor. These were the high-temperature superconductors. And they played by their own rules.

Elusive solutions

Scientists now have a new challenge. Three decades after the high-temperature superconductors were discovered, we are still struggling to understand how they work at the microscopic level. Creative experiments are being conducted every day in universities and research labs around the world.

In my laboratory, we have built a microscope known as a scanning tunneling microscope that helps our research team “see” the electrons at the surface of the material. This allows us to understand how electrons bind and form superconductivity at an atomic scale.

We have come a long way in our research and now know that electrons also pair up in these high-temperature superconductors. There is great value and utility in answering how high-temperature superconductors work because that may be the route to room-temperature superconductivity. If we succeed in making a room-temperature superconductor, then we can address the billions of dollars that it costs in wasted heat to transmit energy from power plants to cities.

More remarkably, solar energy harvested in the vast empty deserts around the world could be stored and transmitted without any loss of energy, which could power cities and dramatically reduce greenhouse gas emissions. The potential is hard to imagine. Finding the glue for room-temperature superconductors is the next million-dollar question.

About the Author:

Pegor Aynajian, Associate Professor of Physics, Binghamton University, State University of New York

This article is republished from The Conversation under a Creative Commons license. Read the original article.


Gold & Silver “Washout” – Get Ready For A Big Move Higher

By TheTechnicalTraders 

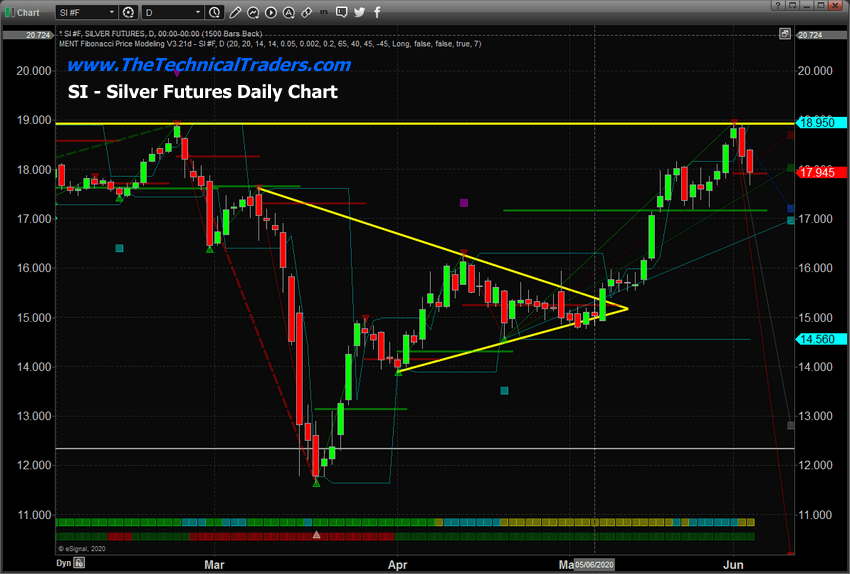
– Gold and Silver moved lower early on June 2nd and 3rd.  Our research team believes this is a “Washout Low” price rotation following a technical pattern that will prompt a much higher rally in precious metals.  This type of washout price rotation is fairly common before very big moves after Pennant/Flag formations or just after reaching major price trigger levels.

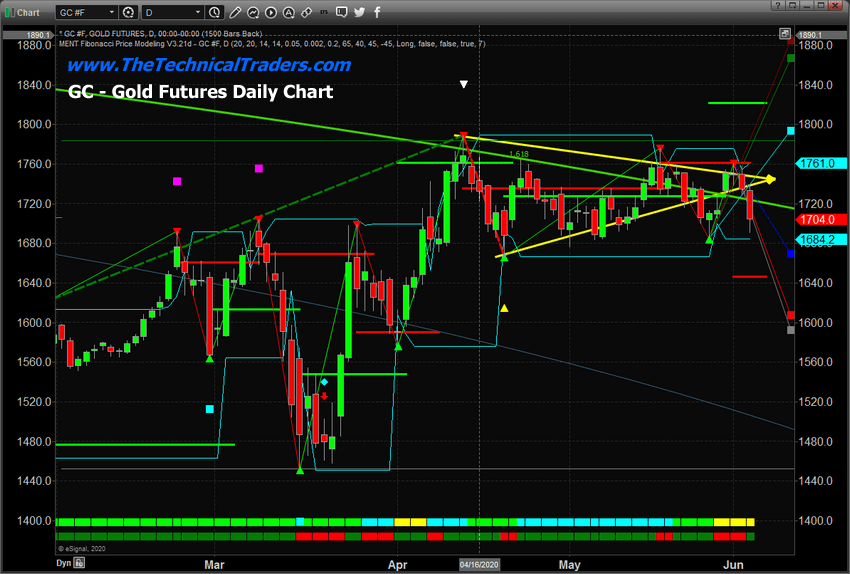
With Gold, a sideways Pennant/Flag formation has been setting up near our GREEN Fibonacci Price Amplitude Resistance Arc.  We believe the downward price rotation recently is a perfect setup for skilled technical traders to take advantage of lower entry price levels.  The GREEN Fibonacci Price Amplitude Arc will very likely be breached over the next 5 to 10 trading days and the price of Gold should rally well above $1850 in the process.  We believe this Washout Rotation is a process of running through the Long Stops just below recent price activity that will end with a defined upside price rally over the next 2 to 5+ weeks.

Before we continue, be sure to opt-in to our free market trend signals before closing this page, so you don’t miss our next special report!

Silver has set up a completely different type of price pattern – a true Double-Top pattern.  The downward price rotation recently in Silver is indicative of a weaker reaction to this massive resistance pattern and Double-Top.  The likelihood that Silver will find support above $17 and mount a further upside price rally over the next 2 to 5+ weeks is still very strong.  After the deep downward price collapse in Silver took place, just like what happened in 2009 and 2010, the upside potential for Silver is still massive – likely targeting $65 per ounce of higher.

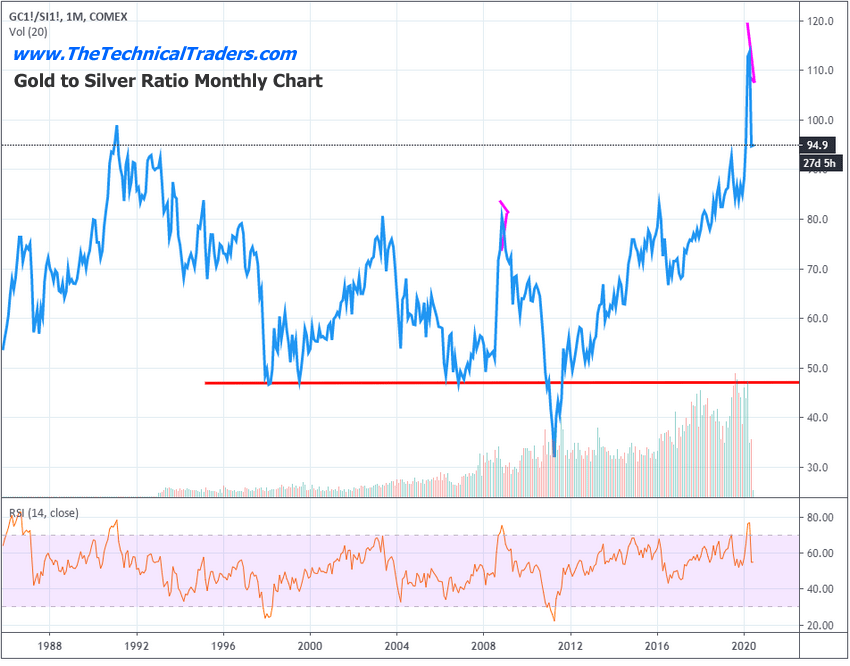
This current Gold to Silver Ratio Monthly chart highlights the recent collapse in the ratio level as Silver rallied from near $12 towards current levels near $18.  A similar spike in the Gold to Silver Ratio took place in 2008-09 – just before the broader market collapse in the US and Global markets took place.  This happens as the initial reaction to risk in the global markets pushes Gold prices a bit higher while Silver, the often overlooked store of value, typically declines in value.

Once the price of Silver starts to rally, pushing the Gold to Silver ratio below 60 typically, both Gold and Silver start to align in price and begin to rally together.  The current level of the Gold to Silver ratio is 94.9.  This suggests that both Gold and Silver have quite a way to go in terms of reaching the “alignment phase”.  Our researchers believe Gold will rally above $2100 to $2400 and Silver will rally above $40 to $50 before the two metals align and begin to rally together in almost equal strength.

Concluding Thoughts:

Pay attention to what happens to precious metals over the next 10 to 15+ days.  If our research is correct, both Gold and Silver will rally higher by about 7.5% to 14% – setting up new price highs for both metals.  When the washout pattern completes, usually a fairly aggressive price trend begins where new price highs are established fairly quickly. Get ready, this should be a really nice upside price swing in precious metals over the next 6+ months or longer.

The next few years are going to be full of incredible opportunities for skilled traders and investors.  Huge price swings, incredible revaluation events, and, eventually, an incredible upside rally will start again.

I’ve been trading since 1997 and I’ve lived through numerous market events.  The one thing I teach my members is that risk is always a big part of trading and that’s why I structure all of my research and trading signals around “finding profits while reducing overall risks”.  Sure, there are fast profits to be made in these wild market swings, but those types of trades are extremely risky for most people – and I don’t know of anyone that wants to risk 50 or 60% of their assets on a few wild trades.

I’m offering you the chance to learn to profit, as I do with my own money, from market trends that I hand-pick for my own trading.  These are not wild, crazy trades – these are simple, effective, and slower types of trades that consistently build wealth.  I issue about 4 to 8+ trades a month for my members and adjust trade allocation based on my proprietary allocation algo – the objective is to gain profits while managing overall risks.

You don’t have to spend days or weeks trying to learn my system.  You don’t have to try to learn to make these decisions on your own or follow the markets 24/7 – I do that for you.  All you have to do is follow my research and trading signals and start benefiting from my research and trades.  My new mobile app makes it simple – download the app, sign in and everything is delivered to your phone, tablet, or desktop.

I offer membership services for active traders, long-term investors, and wealth/asset managers.  Each of these services is driven by my own experience and my proprietary trading systems and modeling systems.  I have a small team of dedicated researchers and developers that do nothing but research and find trading signals for my members.  Our objective is to help you protect and grow your wealth.

Please take a moment to visit TheTechnicalTraders.com to learn more.  I can’t say it any better than this…  I want to help you create success while helping you protect and preserve your wealth – it’s that simple.

Chris Vermeulen
Chief Market Stragist
Founder of Technical Traders Ltd.


Ichimoku Cloud Analysis 04.06.2020 (EURUSD, XAUUSD, BTCUSD)

Article By RoboForex.com

EURUSD, “Euro vs US Dollar”

EURUSD is trading at 1.1217; the instrument is moving above Ichimoku Cloud, thus indicating an ascending tendency. The markets could indicate that the price may test the cloud’s upside border at 1.1185 and then resume moving upwards to reach 1.1350. Another signal in favor of further uptrend will be a rebound from the rising channel’s downside border. However, the bullish scenario may be canceled if the price breaks the cloud’s downside border and fixes below 1.1130. In this case, the pair may continue falling towards 1.1045.

EURUSD
Risk Warning: the result of previous trading operations do not guarantee the same results in the future

XAUUSD, “Gold vs US Dollar”

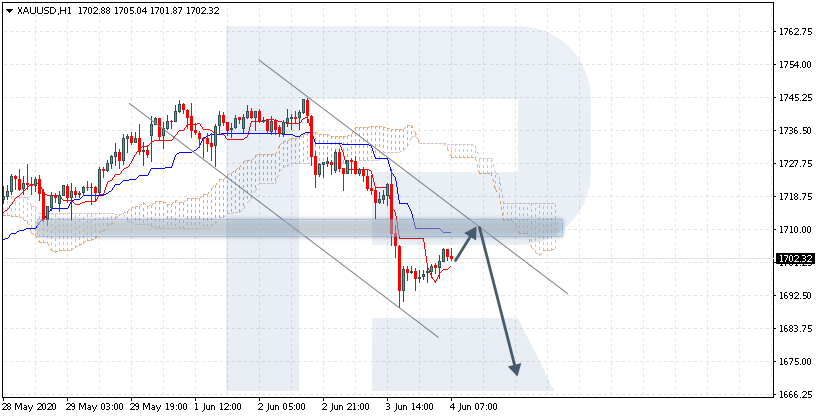
XAUUSD is trading at 1702.00; the instrument is moving below Ichimoku Cloud, thus indicating a descending tendency. The markets could indicate that the price may test Tenkan-Sen and Kijun-Sen at 1710.00 and then resume moving downwards to reach 1670.00. Another signal in favor of further downtrend will be a rebound from the descending channel’s upside border. However, the bearish scenario may no longer be valid if the price breaks the cloud’s upside border and fixes above 1725.00. In this case, the pair may continue growing towards 1755.00.

XAUUSD
Risk Warning: the result of previous trading operations do not guarantee the same results in the future

BTCUSD, “Bitcoin vs US Dollar”

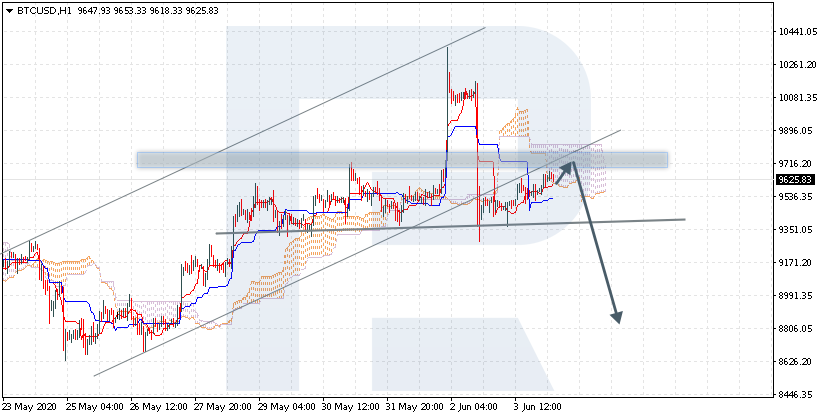
BTCUSD is trading at 9625.00; the instrument is moving inside Ichimoku Cloud, thus indicating a sideways tendency. The markets could indicate that the price may test the cloud’s upside border at 9715.00 and then resume moving downwards to reach 8805.00. Another signal in favor of further downtrend will be a rebound from the rising channel’s downside border. However, the bearish scenario may no longer be valid if the price breaks the cloud’s upside border and fixes above 9965.00. In this case, the pair may continue growing towards 10455.00. To confirm further decline, the asset must break the support level and fix below 9215.00, thus completing a Head & Shoulders reversal pattern.

BTCUSD

Article By RoboForex.com

Attention!
Forecasts presented in this section only reflect the author’s private opinion and should not be considered as guidance for trading. RoboForex LP bears no responsibility for trading results based on trading recommendations described in these analytical reviews.

Japanese Candlesticks Analysis 04.06.2020 (USDCAD, AUDUSD, USDCHF)

Article By RoboForex.com

USDCAD, “US Dollar vs Canadian Dollar”

As we can see in the H4 chart, the descending tendency continues. By now, USDCAD has formed a Hammer pattern not far from the support level. However, the price is not currently expected to reverse. Most likely, in the nearest future, the pair may correct for a while and then continue falling towards the support area at 1.3460.

USDCAD
Risk Warning: the result of previous trading operations do not guarantee the same results in the future

AUDUSD, “Australian Dollar vs US Dollar”

As we can see in the H4 chart, after testing another resistance level, AUDUSD is still trading upwards. By now, it has formed a Shooting Star pattern. At the moment, the price is expected to reverse and correct towards 0.6802. In the future, the pair is expected to resume the rising tendency. in this case, the upside target may be at 0.7070.

AUDUSD
Risk Warning: the result of previous trading operations do not guarantee the same results in the future

USDCHF, “US Dollar vs Swiss Franc”

As we can see in the H4 chart, USDCHF has formed several reversal patterns, such as Engulfing, while trading not far from the support area. At the moment, the pair is expected to return to 0.9587b and rebound from it. In this case, the upside target may be at 0.9685.

USDCHF

Article By RoboForex.com

Attention!
Forecasts presented in this section only reflect the author’s private opinion and should not be considered as guidance for trading. RoboForex LP bears no responsibility for trading results based on trading recommendations described in these analytical reviews.

ECB Meeting Is in the Focus of Attention

by JustForex

The US dollar has continued to decline against a basket of currency majors despite optimistic economic data. The dollar index (#DX) has updated local lows and closed in the negative zone (-0.41%). Thus, the number of people employed in the nonfarm sector decreased by 2,760K, while experts expected a larger reduction by 9,000K. ISM non-manufacturing PMI counted to 45.4 in May instead of 44.0. The conflict between the US and China is still in the spotlight. America has suspended China’s flights to the United States since June 16 after Beijing refused to allow United Airlines and Delta Air Lines to resume flights to China from June.

Investors have taken a wait-and-see attitude before today’s ECB meeting. It is expected that the regulator will keep the key marks of monetary policy at the same level. We recommend paying attention to the comments by representatives of the Central Bank. Yesterday, the Bank of Canada left the key interest rate unchanged at 0.25%.

The “black gold” prices have been declining. At the moment, futures for the WTI crude oil are testing the $36.55 mark per barrel.

Market indicators

Yesterday, there was the bullish sentiment in the US stock market: #SPY (+1.33%), #DIA (+2.06%), #QQQ (+0.45%).

The 10-year US government bonds yield has been growing. At the moment, the indicator is at the level of 0.75-0.76%.

The news feed on 2020.06.04:
  • – UK construction PMI at 11:30 (GMT+3:00);
  • – ECB interest rate decision at 14:45 (GMT+3:00);
  • – Initial jobless claims in the US at 15:30 (GMT+3:00).

by JustForex

The Analytical Overview of the Main Currency Pairs on 2020.06.04

by JustForex

The EUR/USD currency pair

Technical indicators of the currency pair:
  • Prev Open: 1.11648
  • Open: 1.12348
  • % chg. over the last day: +0.56
  • Day’s range: 1.12005 – 1.12366
  • 52 wk range: 1.0777 – 1.1494

Yesterday, the single currency continued its growth against the greenback. EUR/USD quotes have updated local highs again. The trading instrument is currently consolidating. The key range is 1.1185-1.1250. Investors have taken a wait-and-see attitude before today’s ECB meeting. It is expected that the regulator will keep the key marks of monetary policy at the same level. We recommend paying attention to the comments by representatives of the Central Bank. Financial market participants will also assess important economic releases from the US. Positions should be opened from key levels.

The Economic News Feed for 2020.06.04:
  • – ECB interest rate decision at 14:45 (GMT+3:00);
  • – Initial jobless claims in the US at 15:30 (GMT+3:00).
EUR/USD

Indicators do not give accurate signals: the price is testing 50 MA.

The MACD histogram is in the positive zone, but below the signal line, which gives a weak signal to buy EUR/USD.

Stochastic Oscillator is in the neutral zone, the %K line is above the %D line, which indicates the bullish sentiment.

Trading recommendations
  • Support levels: 1.1185, 1.1155, 1.1100
  • Resistance levels: 1.1250, 1.1300

If the price fixes above the level of 1.1250, further growth of EUR/USD quotes is expected. The movement is tending to 1.1300-1.1320.

An alternative could be a decrease in the EUR/USD currency pair to 1.1150-1.1100.

The GBP/USD currency pair

Technical indicators of the currency pair:
  • Prev Open: 1.25501
  • Open: 1.25710
  • % chg. over the last day: +0.19
  • Day’s range: 1.25245 – 1.25806
  • 52 wk range: 1.1466 – 1.3516

GBP/USD quotes have become stable. Financial market participants have started partially fixing positions on the British pound after a prolonged rally. In the near future, a technical correction of the trading instrument is possible. At the moment, the local support and resistance levels are 1.2525 and 1.2575, respectively. We expect economic reports from the UK and the US. We recommend opening positions from key levels.

At 11:30 (GMT+3:00), UK construction PMI will be published.

GBP/USD

Indicators do not give accurate signals: the price has crossed 50 MA.

The MACD histogram has moved into the negative zone, which indicates a possible correction of the GBP/USD currency pair.

Stochastic Oscillator is in the neutral zone, the %K line has crossed the %D line. There are no signals at the moment.

Trading recommendations
  • Support levels: 1.2525, 1.2480, 1.2425
  • Resistance levels: 1.2575, 1.2615

If the price fixes below 1.2525, GBP/USD quotes are expected to correct. The movement is tending to 1.2480-1.2440.

An alternative could be the growth of the GBP/USD currency pair to 1.2610-1.2650.

The USD/CAD currency pair

Technical indicators of the currency pair:
  • Prev Open: 1.35171
  • Open: 1.34964
  • % chg. over the last day: -0.17
  • Day’s range: 1.34901 – 1.35293
  • 52 wk range: 1.2949 – 1.4668

The USD/CAD currency pair continues to consolidate in the range of 1.3480-1.3540. In the near future, the technical correction of the trading instrument after a significant drop over the past two weeks is not ruled out. Financial market participants assess the Bank of Canada meeting. The regulator has kept the key interest rate at the same level of 0.25%. We recommend paying attention to the dynamics of “black gold” prices. Positions should be opened from key levels.

The news feed on Canada’s economy is calm enough.

USD/CAD

Indicators do not give accurate signals: the price has crossed 50 MA.

The MACD histogram is near the 0 mark.

Stochastic Oscillator is in the neutral zone, the %K line has crossed the %D line. There are no signals at the moment.

Trading recommendations
  • Support levels: 1.3480, 1.3450, 1.3400
  • Resistance levels: 1.3540, 1.3585, 1.3675

If the price fixes below 1.3480, a further drop in USD/CAD quotes is expected. The movement is tending to the round level of 1.3400.

An alternative could be the growth of the USD/CAD currency pair to 1.3600-1.3640.

The USD/JPY currency pair

Technical indicators of the currency pair:
  • Prev Open: 108.671
  • Open: 108.869
  • % chg. over the last day: +0.21
  • Day’s range: 108.802 – 109.147
  • 52 wk range: 101.19 – 112.41

The bullish sentiment prevails on the USD/JPY currency pair. The trading instrument has set new local highs. At the moment, USD/JPY quotes are testing the resistance level of 109.15. The 108.80 mark is already a “mirror” support. We do not exclude the further growth of the USD/JPY currency pair. We recommend paying attention to the dynamics of US government bonds yield. Positions should be opened from key levels.

The news feed on Japan’s economy is calm.

USD/JPY

Indicators signal the power of buyers: the price has fixed above 50 MA and 100 MA.

The MACD histogram is in the positive zone, indicating the bullish sentiment.

Stochastic Oscillator is in the neutral zone, the %K line has crossed the %D line. There are no signals at the moment.

Trading recommendations
  • Support levels: 108.80, 108.50, 108.30
  • Resistance levels: 109.15, 109.50

If the price fixes above 109.15, further growth of USD/JPY quotes is expected. The movement is tending to 109.50-109.70.

An alternative could be a decrease in the USD/JPY currency pair to 108.60-108.30.

by JustForex

South Africa must get ready for an inevitable loosening of trade ties with the US

By Mills Soko, University of the Witwatersrand

In six months’ time the world’s gaze will be trained on what is gearing up to be a contentious and hotly contested presidential election in the US. Irrespective of who emerges victorious between the incumbent President Donald Trump and the Democratic nominee Joe Biden South Africa needs to start thinking about what it stands to lose – or gain – from the new administration’s stance.

This is especially so in the area of economic relations. Since 1994, trade and investment ties between the US and South Africa have evolved against the backdrop of a complicated political and diplomatic setting. This has ranged from:

  • US disagreements with the Mandela government over its links with Cuba, Libya and the Palestine;
  • to the huge promise of the binational commission chaired by Al Gore and Thabo Mbeki;
  • to the bitter rancour over the Mbeki government’s HIV/Aids policies;
  • to the deadlock over government-sponsored land invasions in Zimbabwe; and
  • to the rifts over United Nations resolutions against Israel.

In 2003, the two countries failed to conclude a trade agreement amid mutual recriminations.

There have been successes along the way. These include America’s support of South Africa’s breakthrough in preventing bloodshed in Burundi and Pretoria’s leading role in the establishment of the African Union. But these have been outweighed by the low points.


Image by TeeFarm from Pixabay

Economic cooperation is the linchpin of the bilateral relationship. South Africa is America’s largest trade and investment partner in Africa. Over 600 American firms operate in South Africa. In 2017, US direct investment to South Africa was $7.3 billion, while the latter’s outward investment to the US amounted to $4.1 billion.

Under the African Growth and Opportunity Act (Agoa), trade between the two countries has thrived. Introduced by the Clinton administration in 2000, it allows African countries to export duty-free to the US market, provided these countries meet certain governance criteria. In 2018, total two-way trade was $18.9 billion, with South Africa recording a trade surplus of $2.1 billion.

But these fair winds might not blow forever. In light of the global shifts since the inception of Agoa two decades ago, US policy towards South Africa might in future be less generous and accommodating. South Africa would do well to make wise use of the remaining years of Agoa, which expires in 2025, to diversify its export markets and retool its economy.

Tetchy trade links

Agoa has been a boon for South African exports. Before its implementation, South African exports to the US consisted mainly of minerals and metals. Under Agoa exports have become diversified, including platinum, aluminium, steel, vehicles, wine and beer, fresh and processed fruit and vegetables, and essential oils.

Despite this progress, trade links have remained tetchy. The fractious relationship came under scrutiny when then Trade and Industry Minister Rob Davies met with his American counterpart, Michael Froman, in Paris in 2015 to seek a solution to a dispute that represented a litmus test in the changing trade dynamics between the two countries.

Dubbed the “chicken wars” the dispute centred on a demand by American chicken producers for their government to withdraw South Africa’s participation in Agoa. The call had been in response to the imposition by Pretoria of anti-dumping measures on US imports of chicken portions. Such measures are allowed under World Trade Organisation rules and are designed to protect domestic industries from unfairly priced imports.

Despite vociferous lobbying by chicken farmers against South Africa’s inclusion in a renewed Agoa agreement, the US senate approved a bill extending Agoa for 10 years, with South Africa included. In return, South Africa agreed to allow 65 000 tonnes of poultry imports from the US. Excluding South Africa from the new Agoa dispensation could have harmed the country’s trade.

Washington’s belligerent stance

Yet America’s trade policy towards South Africa is changing. This is underscored by the fact that although the US included South Africa in the revised Agoa it did so with stringent conditions. These included a stipulation that South Africa’s trade and investment policies would be subject to a review within 30 days of Agoa’s implementation. If the review found that the South African market was not sufficiently open to US products, the US could limit South Africa’s Agoa benefits or suspend its participation in the scheme. Significantly, the revised Agoa did not provide for increased access for South African products to the US market.

Washington’s increasingly belligerent stance had also been reflected in the array of demands it had made in its trade talks with Pretoria. Besides the row over chicken exports, the US pushed strongly for the withdrawal of the Private Security Industry Regulation Amendment Bill. The bill required foreign-owned security companies to sell at least 51% of their domestic businesses to South Africans.

The change in America’s trade posture towards South Africa is a consequence of global shifts as well as factors specific to South Africa. Agoa came into existence during globalisation’s finest hour and at the height of US economic boom. Since then, the global economic environment has deteriorated, and this has strengthened the influence of trade protectionists in the US.

Also, the US has been shaken by the rise of China as a formidable competitor. The US has used trade as a tool to reassert its position as the pre-eminent global economic power. The Trump administration’s debilitating trade war with Beijing should be viewed within that context.

In the case of South Africa, the Clinton administration’s rationale for including the country in the original Agoa scheme was to support its democratic consolidation and integration into the global economy. The US has, however, historically never regarded South Africa as a developing country in the same way it has viewed other African countries. This American view of South Africa dates back to the post-war years when the country was seen as a part of the developed “western bloc” that shaped the new world order. It is for this reason that when South Africa, in the early 1990s, applied to the World Trade Organisation for reclassification as a developing nation the US, supported by the European Union and Japan, objected.

Early this year the Trump administration revived this historical position on South Africa and revoked the country’s “developing country” status. This followed a similar decision by the US in respect of China and India. It means that these countries will no longer enjoy the preferential trade treatment extended to poor nations. A Biden electoral victory is unlikely to deviate from the path set by the current administration. Trade is one of the very few areas on which there remains strong bipartisan support.

Even self-proclaimed democratic socialists like Bernie Sanders have opposed free trade deals. Hilary Clinton, who lost against Trump in the 2016 poll, has a history of espousing inconsistent and ambivalent positions on trade. The outbreak of the coronavirus global pandemic, and the resultant damage it has inflicted on the US economy, will most likely reinforce bipartisan consensus on American trade policy.

What this means is that South Africa can no longer rely on Agoa as the centrepiece of its economic partnership with the US. Agoa is not a negotiated, reciprocal agreement: it is an American initiative that provides non-reciprocal trade preferences to African countries. The US can arbitrarily suspend or withdraw its benefits to participating nations.The Conversation

About the Author:

Mills Soko, Professor: International Business & Strategy, Wits Business School, University of the Witwatersrand

This article is republished from The Conversation under a Creative Commons license. Read the original article.
 

Fibonacci Retracements Analysis 03.06.2020 (GBPUSD, EURJPY)

Article By RoboForex.com

GBPUSD, “Great Britain Pound vs US Dollar”

As we see in the H4 chart, GBPUSD is moving towards the high at 1.2648. After breaking it, the pair may continue growing towards the next target, which is mid-term 50.0% fibo at 1.2892. However, there is another scenario, according to which the price may rebound from the high and form one more descending wave to reach 50.0% fibo at 1.2030 but it’s highly unlikely.

GBPUSD_H4
Risk Warning: the result of previous trading operations do not guarantee the same results in the future

The H1 chart shows a more detailed structure of the current ascending correction, which, after breaking 76.0% fibo, has almost reached the high. At the same time, there might be a divergence on MACD to indicate a pullback in the nearest future. The target of this pullback may be the local support at 61.8% (1.2425).

GBPUSD_H1
Risk Warning: the result of previous trading operations do not guarantee the same results in the future

EURJPY, “Euro vs. Japanese Yen”

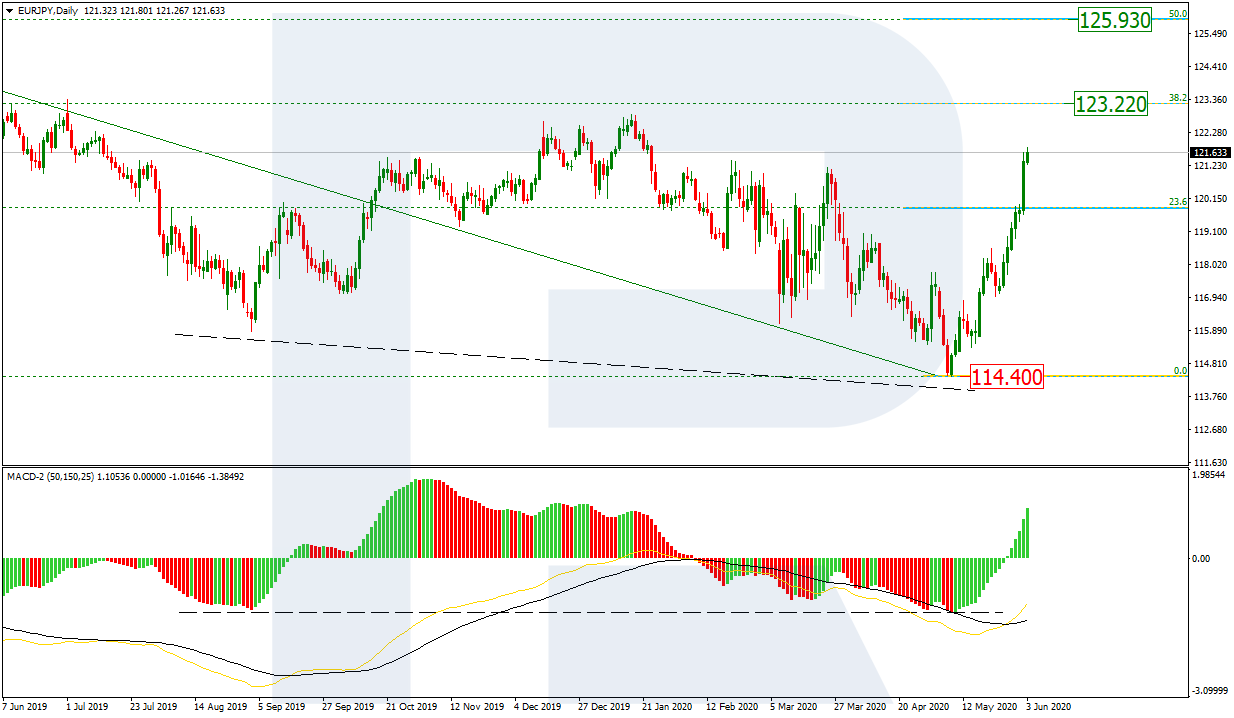
As we can see in the daily chart, the convergence of MACD made EURJPY start a new rising movement, which may be considered as a reversal and long-term wave. The pair has already broken 23.6% fibo and may continue growing towards 38.2% and 50.0% fibo at 123.22 and 125.93 respectively. The support is the low at 114.40.

EURJPY_D1
Risk Warning: the result of previous trading operations do not guarantee the same results in the future

The H4 chart shows that after breaking 76.0% fibo, the instrument may continue trading to reach the high at 122.87.

EURJPY_H4

Article By RoboForex.com

Attention!
Forecasts presented in this section only reflect the author’s private opinion and should not be considered as guidance for trading. RoboForex LP bears no responsibility for trading results based on trading recommendations described in these analytical reviews.