Author Archive for InvestMacro – Page 30

Oil Controlled by Good News

By Dmitriy Gurkovskiy, Chief Analyst at RoboForex

Early in the second week of June, Brent remains in the “black” and looks rather promising. Last weekend, investors got some good news and are now responding to it.

During the OPEC+ meeting that took place on Saturday, the cartel’s ministers agreed to expand the low oil output period for another month. It means that the oil production decline by 9.7 million bpd will continue until the end of July. During the second half of 2020, starting from August, the decline is expected to be 7.7 million bpd, while from January to and including April 2021 – 5.8 million bpd.

We remind you that the basis for the agreement wase production parameters of October 2018, excluding Saudi Arabia and Russia, whose baseline was 11 million bpd. This is the reason why the number varies for different countries.

This information is making the oil price rise. However, even with all things considered investors ignore the fact that Saudi Arabia raised prices for all buyers in July.

In the H4 chart, Brent is moving within the uptrend towards 43.43. Later, the market may correct to the downside to reach 38.70 and then form one more ascending wave with the target at 47.50. From the technical point of view, this scenario is confirmed by MACD Oscillator: its signal line is moving above 0; it has entered the histogram and is currently growing steadily.

As we can see in the H1 chart, Brent has broken 42.00 to the upside and may test this level from above. After that, the instrument may grow with the short-term target at 43.43 and then start a new correction to reach 38.70. Later the market may form one more ascending wave inside the uptrend towards 43.00. From the technical point of view, this scenario is confirmed by Stochastic Oscillator: its signal line is rebounding from 80 and is expected to correct towards 50. After that, the line is expected to resume moving to return to 80.

Disclaimer

Any predictions contained herein are based on the author’s particular opinion. This analysis shall not be treated as trading advice. RoboForex shall not be held liable for the results of the trades arising from relying upon trading recommendations and reviews contained herein.


Beware of the bearish divergence in DAX30, a short-term correction is likely

By Admiral Markets

Source: Economic Events June 8, 2020 – Admiral Markets’ Forex Calendar

The DAX went parabolic over the last week of trading by gaining further bullish momentum after the German index recaptured the SMA(200) around 12,000/050 points.

At first glance, it seemed quite optimistic to get to see a walk-through on the upside with a push as high as the region around the January lows around 12,850/900 points.

This came, despite social unrest in the US, and a very dark fundamental picture for the US economy as well as the European economy. The combination of an EU commission proposal of a 750 Billion-Euro fiscal stimulus package with 500 billion Euro in grants and 250 billion in loans for European Union regions as a first step toward a transfer union, the German governing coalition agreeing on an additional €130bn economic stimulus package which will see e.g. value-added tax rate cut from 19% to 16% and an ECB which boosted the size of its PEPP program on Thursday to 1.35 trillion Euros with being set to run through at least the end of June 2021, the DAX30 took off on the upside.

While the stock market has obviously completely decoupled from the real economy, given the German index’ with valuation at a Price-Earnings-Ratio of around 20, its highest level since the New Economy at 2000, the bullish performance is also a warning sign for ‘bears’.

Whatever driver the DAX30 currently finds, it is a clear bullish one, even though the technical mode on the upside seems very extended.

In fact, the first clear signs of a bearish divergence in the RSI(14) on H1 point to at least a short-term correction, a push back below 12,000 points activate a first target around 11,800/850 points and becomes likely with a break below 12,300/350 points.

Above 12,300/350 points the focus and target on the upside remains on the January lows around 12,850/900 points.

Source: Admiral Markets MT5 with MT5-SE Add-on DAX30 CFD Hourly chart (between May 19, 2020, to June 5, 2020). Accessed: June 5, 2020, at 10:00pm GMT

Source: Admiral Markets MT5 with MT5-SE Add-on DAX30 CFD Daily chart (between February 20, 2019, to June 5, 2020). Accessed: June 5, 2020, at 10:00pm GMT – Please note: Past performance is not a reliable indicator of future results, or future performance.

In 2015, the value of the DAX30 CFD increased by 9.56%, in 2016, it increased by 6.87%, in 2017, it increased by 12.51%, in 2018, it fell by 18.26%, in 2019, it increased by 26.44% meaning that after five years, it was up by 34.2%.

Discover the world’s #1 multi-asset platform

Admiral Markets offers professional traders the ability to trade with a custom, upgraded version of MetaTrader 5, allowing you to experience trading at a significantly higher, more rewarding level. Experience benefits such as the addition of the Market Heat Map, so you can compare various currency pairs to see which ones might be lucrative investments, access real-time trading data, and so much more. Click the banner below to start your FREE download of MT5 Supreme Edition!

Download MetaTrader 5 and begin trading today!

Disclaimer: The given data provides additional information regarding all analysis, estimates, prognosis, forecasts or other similar assessments or information (hereinafter “Analysis”) published on the website of Admiral Markets. Before making any investment decisions please pay close attention to the following:

  1. This is a marketing communication. The analysis is published for informative purposes only and are in no way to be construed as investment advice or recommendation. It has not been prepared in accordance with legal requirements designed to promote the independence of investment research, and that it is not subject to any prohibition on dealing ahead of the dissemination of investment research.
  2. Any investment decision is made by each client alone whereas Admiral Markets shall not be responsible for any loss or damage arising from any such decision, whether or not based on the Analysis.
  3. Each of the Analysis is prepared by an independent analyst (Jens Klatt, Professional Trader and Analyst, hereinafter “Author”) based on the Author’s personal estimations.
  4. To ensure that the interests of the clients would be protected and objectivity of the Analysis would not be damaged Admiral Markets has established relevant internal procedures for prevention and management of conflicts of interest.
  5. Whilst every reasonable effort is taken to ensure that all sources of the Analysis are reliable and that all information is presented, as much as possible, in an understandable, timely, precise and complete manner, Admiral Markets does not guarantee the accuracy or completeness of any information contained within the Analysis. The presented figures refer that refer to any past performance is not a reliable indicator of future results.
  6. The contents of the Analysis should not be construed as an express or implied promise, guarantee or implication by Admiral Markets that the client shall profit from the strategies therein or that losses in connection therewith may or shall be limited.
  7. Any kind of previous or modeled performance of financial instruments indicated within the Publication should not be construed as an express or implied promise, guarantee or implication by Admiral Markets for any future performance. The value of the financial instrument may both increase and decrease and the preservation of the asset value is not guaranteed.
  8. The projections included in the Analysis may be subject to additional fees, taxes or other charges, depending on the subject of the Publication. The price list applicable to the services provided by Admiral Markets is publicly available from the website of Admiral Markets.

Leveraged products (including contracts for difference) are speculative in nature and may result in losses or profit. Before you start trading, you should make sure that you understand all the risks

By Admiral Markets

Trump’s Final Gamble: From Chinagate to Hybrid Wars

By Dan Steinbock

– The disastrous failure of the Trump administration to contain COVID-19 will result in catastrophic 2nd quarter data. As a result, Trump is risking his re-election on domestic unrest, fatal geopolitics and a global depression.

The cold reality is that the Trump administration learned about the virus already on January 3, when CDC Director Dr. Robert R. Redfield informed Secretary of Health Alex Azar that China had discovered a new coronavirus. Yet no mobilization was initiated until toward late March (see my report here):

Indeed, the Trump White House missed three opportunities to contain the virus outbreak; in January (between CDC alert and WHO’s international emergency), the 1st quarter (between the WHO emergency and the pandemic alert) and the 2nd quarter (since social distancing began 6-8 weeks late and inadequately).

Instead of virus mobilization in early January, a long debate began within the White House over “what to tell to the American public,” while Azar and Secretary of State Mike Pompeo began repeated attacks against China. The consequent economic carnage is evident in the 2nd quarter free-fall (Table).

Table Human Costs and Economic Damage of the Pandemic

Human

Costs

Q4 2019 (#)  Q1 2020

(#)

  Q2 2020

(#)


Cumulative Cases


China:

US


1

0


China:

US:


82,500

140,600


China:

US:    


85,000

2.3 million+


Economic DamageQ4 2019 (%)  Q1 2020

(%)

  Q2 2020

(%)


GDP

Growth


China:      

US:                 


6.0%

2.1%


China:   

US:  


-6.8%

-4.8%


China:     

US:


3% to 4%

-38% to -45%

Source: WHO, IMF, Goldman Sachs, Morgan Stanley, Difference Group.

At the end of June, the US is likely to have more than 2.3 million cumulative cases and over 130,000 deaths. In the 1st quarter, US annual GDP growth contracted (-4.8%) but the real carnage will ensue with the 2nd quarter plunge (-38% to -45%), as I projected in April and major US investment banks have warned. The Atlanta Fed’s model expects a -52% plunge, however.

To survive its pandemic and economic failures, the Trump White House has initiated a series of measures in a hybrid war against China. In the absence of timely countervailing actions, these measures have potential to undermine global economic prospects in the short term and the promise of the Asian Century over time.

Southeast Asia will not remain immune to such headwinds.

From Chinagate to hybrid China Wars

As the Trump White House has targeted China as a its re-election scapegoat, the early victims include US-Sino high-level bilateral dialogue, trade and investment relations, US treasuries, military relations and destabilization in East Asia.

High-Level Dialogues. Undermining decades of US-Sino bilateral progress, President Trump has let US-Sino high-level economic, law enforcement and cultural dialogues freeze since fall 2017; the diplomatic and security dialogue since fall 2018.

Trade.  Trade tensions are re-escalating. After the Phase-I deal, China is obliged to buy $200 billion in additional US imports over two years on top of pre-trade war purchase levels. The truce would require 18% annual import growth from the US, which is challenging to China amid Trump protectionism and dire global prospects.

Investment. Before the trade wars, US investment to China averaged $15 billion per year, whereas Chinese investment in the US soared to $45 billion. US investment to China has persisted, but Chinese investment in the US has been forced to plunge to $5 billion. Thanks to Trump decoupling, over a decade of progress has been reversed. Nevertheless, seven of ten US companies do not plan to leave China.

Treasuries.  For years, Beijing invested much of its foreign exchange reserves in US assets, particularly US Treasury securities. In another low-probability but high-impact re-election scenario, Republicans are threatening Beijing with unilateral $1.1 trillion debt cancellation, while Democrats hope to de-list Chinese companies from US markets. As a result, Beijing is diversifying investments away from the US, while pumping over $1.4 trillion into the tech sector over to 2025.

Military Relations. Despite political differences, US-China military exchanges used to feature high-level visits, exchanges between defense officials, and functional interactions. According to Pentagon, these engagements have fallen by two-thirds in the Trump era, while bilateral tensions are rapidly escalating in South and East China Sea. Whether accidental or provoked, a conflict is a matter of time.

Special Administrative Regions.  Destabilization efforts in Chinese mainland’s proximity have escalated dramatically since 2017.

  •  Unlike previous administrations, the White House, in cooperation with Taiwan’s president Tsai Ing-wen, seeks to undermine decades of “One China” policies. If the past “strategic ambiguity” gives way to force, the geopolitical impact could destabilize East Asia.
  • Hong Kong. According to Washington, “pro-democracy forces” are threatened in Hong Kong. According to Beijing, cooperation between the White House, Congress, and Tsai government is fueled by a quest for “color revolution.” As Senate Intelligence Committee chair, radical-right Sen. Marco Rubio (R-FL) hopes to exploit the Hong Kong Human Rights and Democracy Actfor regime change in China as he has in Iran, Russia, Venezuela and elsewhere.
  • Financier of the Trump campaign and Republican conservatives, billionaire casino magnate Sheldon Adelson allowed the CIA to use of his Macau properties for US espionage in the early 2010s. More recently, his Sands Corp. played a critical role in an apparent spying operation targeting Julian Assange, when the CIA came under the control of Mike Pompeo, another Adelson ally.
  • Before Trump’s Hong Kong declaration,US lawmaker Scott Perry (R-PA), a retired Pennsylvania Army National Guard Brigadier General, has introduced a bill to recognize Tibet as a sovereign country.

From pandemic geopolitics to US debt crisis

In 2003, the Bush administration began its Iraq War under a pretext, presumably to achieve a domino-effect democracy across the Middle East. The consequent nightmare led to still another ‘forever war’ in the region, in which the costs soared to $3 trillion, as estimated by economist Joseph Stiglitz.

Barely two decades later, the Trump administration has initiated what in Beijing looks like a nascent hybrid war to win re-election. The economic costs of complacency, which are misplaced on China and WHO, are estimated at $9 trillion; that’s three times the costs of the Iraq War.

These tragic losses could pale with the imminent new policy mistakes. In what I have termed a Great Power Conflicts scenario, lingering pandemic risks would result in intense trade and technology wars, “hot” geopolitical conflicts and a long, multi-year global depression. This is the current path of the Trump White House, which is predicated on leveraging US economy to the hilt.

US debt has soared to $26 trillion that puts US debt-to-GDP ratio to 120% (at par with that of Italy amid its debt crisis in 2011-12), which the White House and the Fed will soon have to further increase.

Due to the central role of US in the world economy, such economic leverage – coupled with the human costs of the pandemic and deadly geopolitics – is pushing global prospects toward the edge of global depression.

About the Author:

Dr. Steinbock is the founder of Difference Group. He has served at the India, China and America Institute (USA), Shanghai Institutes for International Studies (China) and the EU Center (Singapore). For more, see https://www.differencegroup.net 

This is a short version of a commentary published by China-US Focus on June 5, 2020.


Hydrogen cars won’t overtake electric vehicles because they’re hampered by the laws of science

By Tom Baxter, University of Aberdeen

Hydrogen has long been touted as the future for passenger cars. The hydrogen fuel cell electric vehicle (FCEV), which simply runs on pressurised hydrogen from a fuelling station, produces zero carbon emissions from its exhaust. It can be filled as quickly as a fossil-fuel equivalent and offers a similar driving distance to petrol. It has some heavyweight backing, with Toyota for instance launching the second-generation Mirai later in 2020.

The Canadian Hydrogen and Fuel Cell Association recently produced a report extolling hydrogen vehicles. Among other points, it said that the carbon footprint is an order of magnitude better than electric vehicles: 2.7g of carbon dioxide per kilometre compared to 20.9g.

All the same, I think hydrogen fuel cells are a flawed concept. I do think hydrogen will play a significant role in achieving net zero carbon emissions by replacing natural gas in industrial and domestic heating. But I struggle to see how hydrogen can compete with electric vehicles, and this view has been reinforced by two recent pronouncements

A report by BloombergNEF concluded:

The bulk of the car, bus and light-truck market looks set to adopt [battery electric technology], which are a cheaper solution than fuel cells.

Volkswagen, meanwhile, made a statement comparing the energy efficiency of the technologies. “The conclusion is clear” said the company. “In the case of the passenger car, everything speaks in favour of the battery and practically nothing speaks in favour of hydrogen.”

Hydrogen’s efficiency problem

The reason why hydrogen is inefficient is because the energy must move from wire to gas to wire in order to power a car. This is sometimes called the energy vector transition.

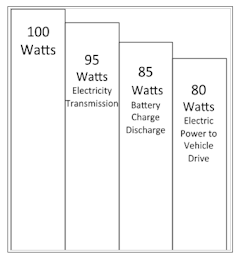
Let’s take 100 watts of electricity produced by a renewable source such as a wind turbine. To power an FCEV, that energy has to be converted into hydrogen, possibly by passing it through water (the electrolysis process). This is around 75% energy-efficient, so around one-quarter of the electricity is automatically lost.

The hydrogen produced has to be compressed, chilled and transported to the hydrogen station, a process that is around 90% efficient. Once inside the vehicle, the hydrogen needs converted into electricity, which is 60% efficient. Finally the electricity used in the motor to move the vehicle is is around 95% efficient. Put together, only 38% of the original electricity – 38 watts out of 100 – are used.

With electric vehicles, the energy runs on wires all the way from the source to the car. The same 100 watts of power from the same turbine loses about 5% of efficiency in this journey through the grid (in the case of hydrogen, I’m assuming the conversion takes place onsite at the wind farm).

Energy efficiency in electric vehicles.

You lose a further 10% of energy from charging and discharging the lithium-ion battery, plus another 5% from using the electricity to make the vehicle move. So you are down to 80 watts – as shown in the figure opposite.

In other words, the hydrogen fuel cell requires double the amount of energy. To quote BMW: “The overall efficiency in the power-to-vehicle-drive energy chain is therefore only half the level of [an electric vehicle].”

Swap shops

There are around 5 million electric vehicles on the roads, and sales have been rising strongly. This is at best only around 0.5% of the global total, though still in a different league to hydrogen, which had achieved around 7,500 car sales worldwide by the end of 2019.

Hydrogen still has very few refuelling stations and building them is hardly going to be a priority during the coronavirus pandemic, yet enthusiasts for the longer term point to several benefits over electric vehicles: drivers can refuel much more quickly and drive much further per “tank”. Like me, many people remain reluctant to buy an electric car for these reasons.

China, with electric vehicle sales of more than one million a year, is demonstrating how these issues can be addressed. The infrastructure is being built for owners to be able to drive into forecourts and swap batteries quickly. NIO, the Shanghai-based car manufacturer, claims a three-minute swap time at these stations.

China is planning to build a large number of them. BJEV, the electric-car subsidiary of motor manufacturer BAIC, is investing €1.3 billion (£1.2 billion) to build 3,000 battery charging stations across the country in the next couple of years.

Not only is this an answer to the “range anxiety” of prospective electric car owners, it also addresses their high cost. Batteries make up about 25% of the average sale price of electric vehicles, which is still some way higher than petrol or diesel equivalents.

By using the swap concept, the battery could be rented, with part of the swap cost being a fee for rental. That would reduce the purchase cost and incentivise public uptake. The swap batteries could also be charged using surplus renewable electricity – a huge environmental positive.

Admittedly, this concept would require a degree of standardisation in battery technology that may not be to the liking of European car manufacturers. The fact that battery technology could soon make it possible to power cars for a million miles might make the business model more attractive.

It may not be workable with heavier vehicles such as vans or trucks, since they need very big batteries. Here, hydrogen may indeed come out on top – as BloombergNEF predicted in its recent report.

Finally a word on the claims on carbon emissions from that Canadian Hydrogen and Fuel Cell Association report I mentioned earlier. I checked the source of the statistics, which revealed they were comparing hydrogen made from purely renwewable electricity with electric vehicles powered by electricity from fossil fuels.

If both were charged using renewable electricity, the carbon footprint would be similar. The original report was funded by industry consortium H2 Mobility, so it’s a good example of the need to be careful with information in this area.The Conversation

About the Author:

Tom Baxter, Senior Lecturer in Chemical Engineering, University of Aberdeen

This article is republished from The Conversation under a Creative Commons license. Read the original article.


Forex Technical Analysis & Forecast 05.06.2020

Article By RoboForex.com

EURUSD, “Euro vs US Dollar”

After finishing the correction at 1.1192, EURUSD continues moving upwards to reach 1.1360; right now, it is consolidating above 1.1310. Possibly, the pair may break the range to the upside and reach 1.1380 or even extend this wave up to 1.1412. After that, the instrument may resume trading downwards with the target at 1.1287.

EURUSD
Risk Warning: the result of previous trading operations do not guarantee the same results in the future

GBPUSD, “Great Britain Pound vs US Dollar”

After breaking 1.2568 to the upside, GBPUSD is expected to trade upwards and reach 1.2650. After that, the instrument may start a new decline to return to 1.2568, thus forming a new consolidation range between these two levels. If later the price breaks the range to the upside, the market may grow to reach 1.2780; if to the downside – resume trading downwards.

GBPUSD
Risk Warning: the result of previous trading operations do not guarantee the same results in the future

USDRUB, “US Dollar vs Russian Ruble”

USDRUB is finishing the correction at 69.60. Later, the market may resume trading inside the downtrend with the target at 67.80.

USDRUB
Risk Warning: the result of previous trading operations do not guarantee the same results in the future

USDJPY, “US Dollar vs Japanese Yen”

After completing the correction at 108.70, USDJPY is growing to break 109.14 to the upside. Possibly, the pair may reach 109.70 and then start another decline towards 108.12.

USDJPY
Risk Warning: the result of previous trading operations do not guarantee the same results in the future

USDCHF, “US Dollar vs Swiss Franc”

After finishing the descending wave at 0.9550, USDCHF is consolidating near the lows. If later the price breaks the range to the upside at 0.9565, the market may grow to reach 0.9590; if to the downside at 0.9545 – resume trading downwards with the target at 0.9525.

USDCHF
Risk Warning: the result of previous trading operations do not guarantee the same results in the future

AUDUSD, “Australian Dollar vs US Dollar”

After breaking 0.6934 to the upside, AUDUSD is expected to continue growing towards 0.7014. Later, the market may fall to break 0.6934 and then form a new descending structure with the target at 0.6868.

AUDUSD
Risk Warning: the result of previous trading operations do not guarantee the same results in the future

BRENT

After breaking 40.00, Brent is expected to continue growing towards 41.00. After that, the instrument may correct to reach 38.70 and then resume trading upwards with the target at 45.50.

BRENT
Risk Warning: the result of previous trading operations do not guarantee the same results in the future

XAUUSD, “Gold vs US Dollar”

After finishing the ascending wave at 1720.40, Gold is moving downwards to reach 1704.60. Later, the market may break it and then continue trading downwards with the target at 1690.30.

GOLD
Risk Warning: the result of previous trading operations do not guarantee the same results in the future

BTCUSD, “Bitcoin vs US Dollar”

BTCUSD has finished the ascending structure at 9700.00. Today, the pair may continue trading upwards towards 10000.00 and then start another decline with the first target at 9000.00.

BITCOIN
Risk Warning: the result of previous trading operations do not guarantee the same results in the future

S&P 500

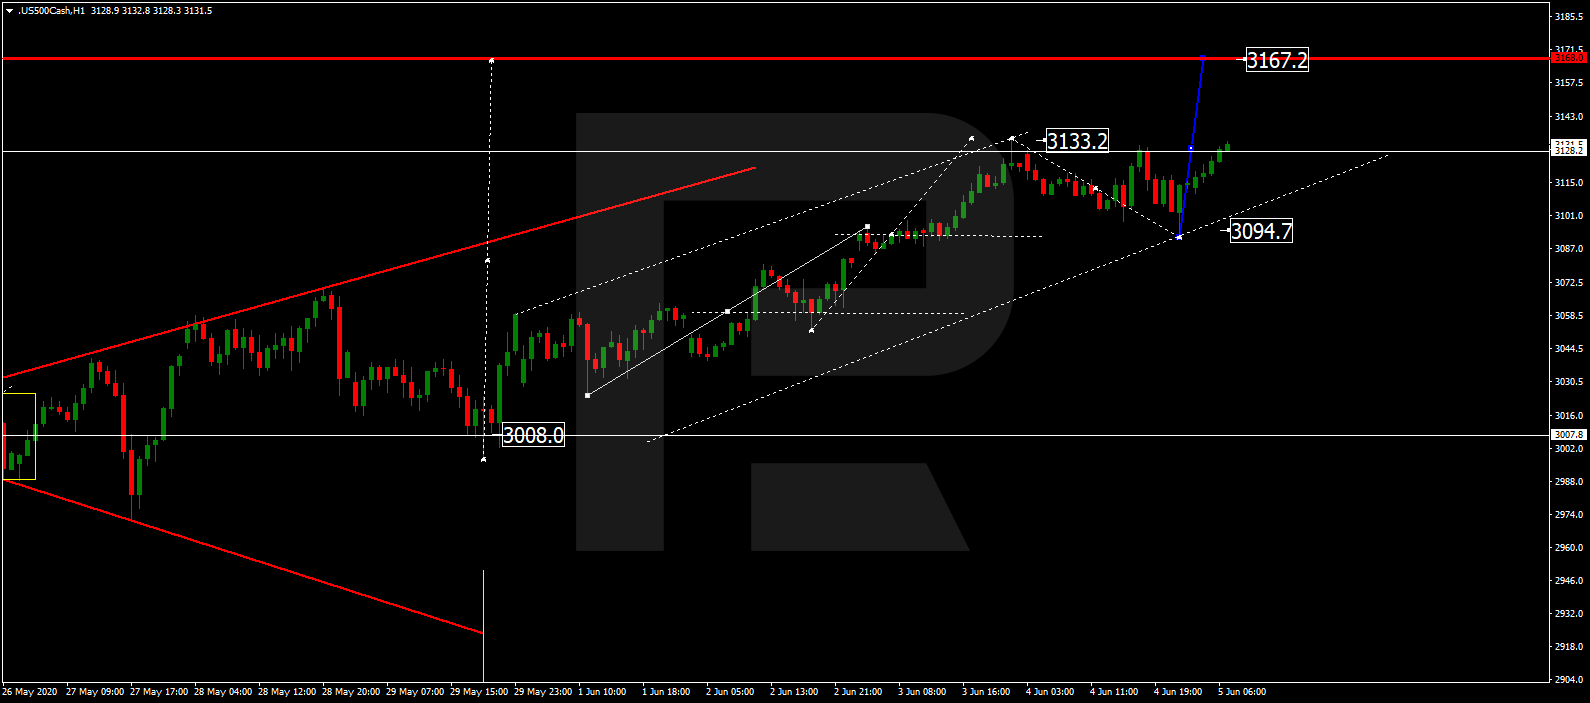
The Index has completed the correctional wave at 3094.0; right now, it is moving upwards. Possibly, today the asset may break 3133.3 and reach the next target at 3167.2. After that, the instrument may start consolidating close to the highs.

S&P 500

Article By RoboForex.com

Attention!
Forecasts presented in this section only reflect the author’s private opinion and should not be considered as guidance for trading. RoboForex LP bears no responsibility for trading results based on trading recommendations described in these analytical reviews.

Fibonacci Retracements Analysis 05.06.2020 (BITCOIN, ETHEREUM)

Article By RoboForex.com

BTCUSD, “Bitcoin vs US Dollar”

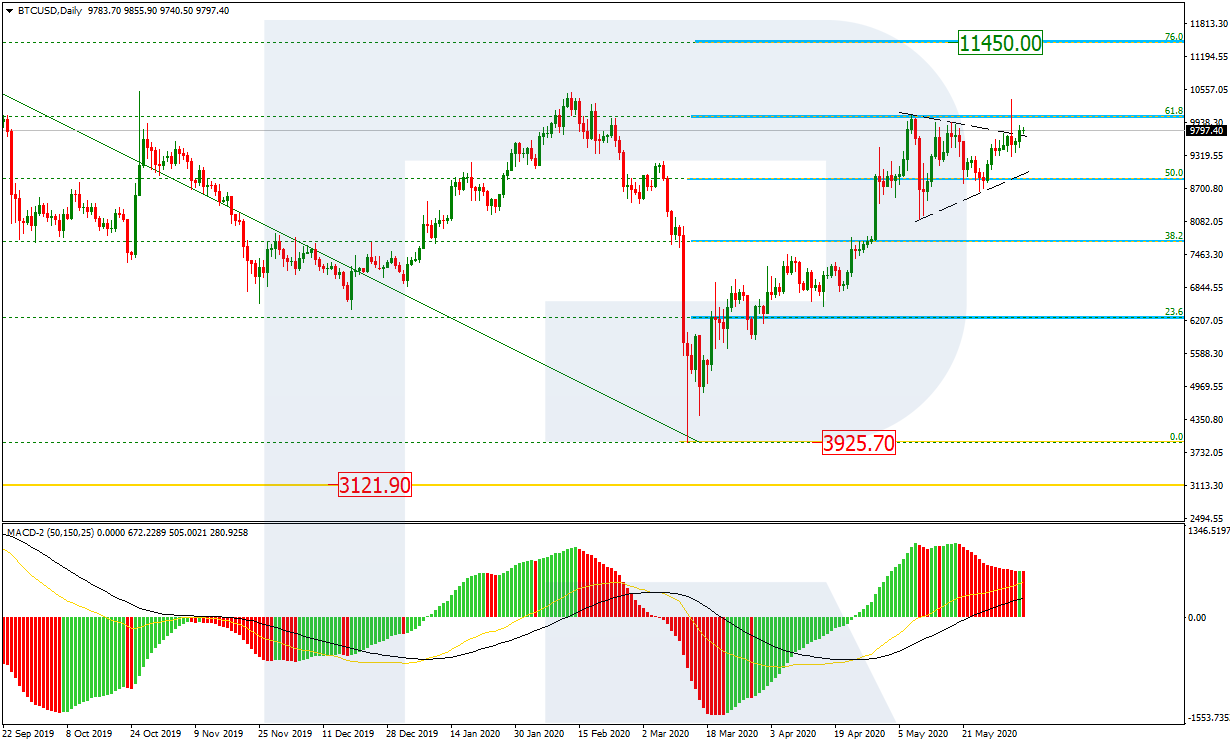
As we can see in the daily chart, after breaking a Triangle pattern to the upside and updating the high, BTCUSD has failed to break 61.8% fibo. At the moment, the pair is trading not far from the above-mentioned pattern again. The next upside target may be 76.0% fibo at 11450.00. However, the fact that the instrument is slowing down along with a divergence on MACD indicates a possible reversal and a new decline.

BTCUSD
Risk Warning: the result of previous trading operations do not guarantee the same results in the future

In the H4 chart, after reaching the high at 10505.60, BTCUSD has quickly rebounded. At the same time, we can see a divergence on MACD, which may indicate a possible trend reversal. The first signal to confirm this scenario will be a breakout of the support at 8925.50. After that, the instrument may continue falling to reach 23.6%, 38.2%, and 50.0% fibo at 8846.00, 7907.00, and 7153.20 respectively.

BITCOIN
Risk Warning: the result of previous trading operations do not guarantee the same results in the future

ETHUSD, “Ethereum vs. US Dollar”

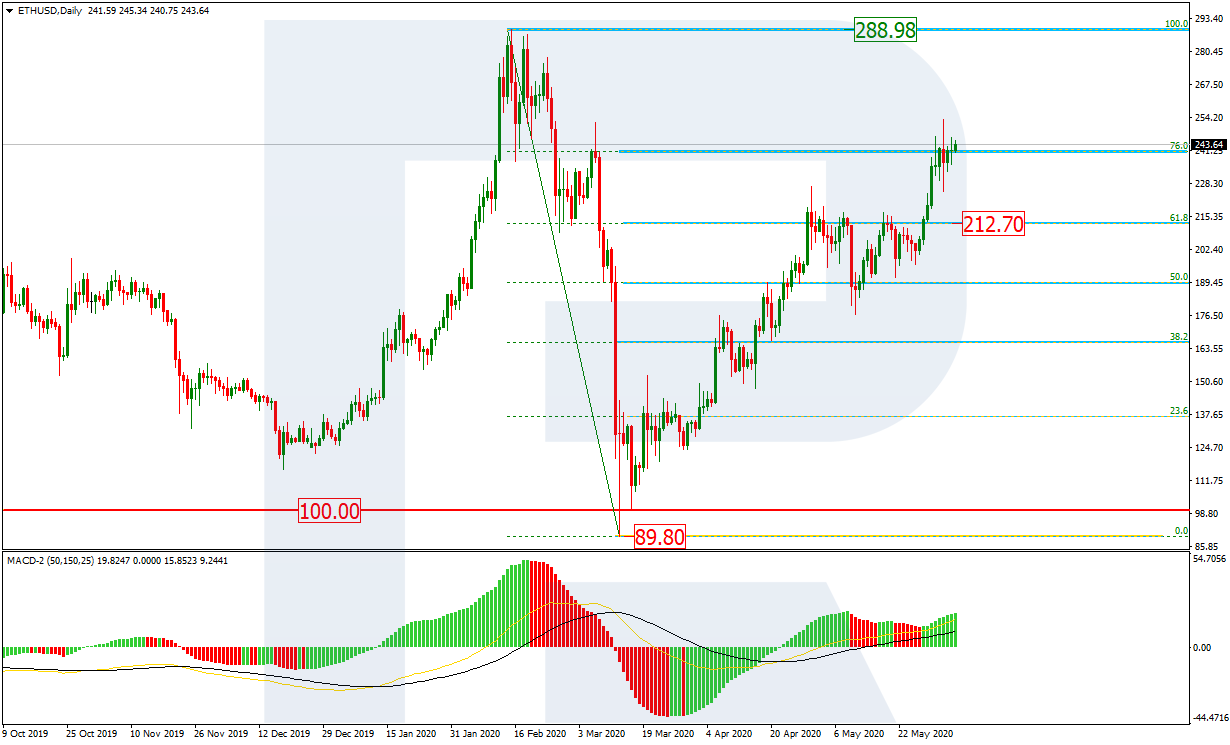
As we can see in the daily chart, after finishing a short-term correction around 61.8% fibo, ETHUSD has reached 76.0% fibo. Possibly, the pair may grow towards the fractal high at 288.98. At the same time, there might be a divergence on MACD to indicate a possible reversal. However, the key signal in favor of further decline will be a breakout of the support at 212.70..

ETHEREUM
Risk Warning: the result of previous trading operations do not guarantee the same results in the future

As we can see in the H4 chart, the local divergence made ETHUSD start a new correction to the downside. The correctional targets are 23.6%, 38.2%, and 50.0% fibo at 214.90, 191.00, and 171.60 respectively. However, if the instrument breaks the high at 253.47, the price may continue trading upwards.

ETHUSD

Article By RoboForex.com

Attention!
Forecasts presented in this section only reflect the author’s private opinion and should not be considered as guidance for trading. RoboForex LP bears no responsibility for trading results based on trading recommendations described in these analytical reviews.

The Analytical Overview of the Main Currency Pairs on 2020.06.05

by JustForex

The EUR/USD currency pair

Technical indicators of the currency pair:
  • Prev Open: 1.12348
  • Open: 1.13372
  • % chg. over the last day: +0.93
  • Day’s range: 1.13260 – 1.13837
  • 52 wk range: 1.0777 – 1.1494

The EUR/USD currency pair continues to show a steady uptrend. Since the beginning of this week, quotes growth has exceeded 250 points. Investors assess the ECB meeting. The regulator has kept key interest rates unchanged. The Central Bank has increased the crisis bond-buying program by 600 billion euros instead of the expected 500 billion. Currently, EUR/USD quotes are consolidating in the range of 1.1315-1.1380. Investors have taken a wait-and-see attitude before today’s US labor market report for May. Experts forecast quite pessimistic labor statistics. We recommend paying attention to the difference between the actual and forecasted values. Positions should be opened from key levels.

The Economic News Feed for 2020.06.05:
  • At 15:30 (GMT+3:00), a report on the US labor market will be published.
EUR/USD

Indicators signal the power of buyers: the price has fixed above 50 MA and 100 MA.

The MACD histogram is in the positive zone, indicating the bullish sentiment.

Stochastic Oscillator is near the overbought zone, the %K line has crossed the %D line. There are no signals at the moment.

Trading recommendations
  • Support levels: 1.1315, 1.1250, 1.1190
  • Resistance levels: 1.1380, 1.1450

If the price fixes above 1.1380, further growth of EUR/USD quotes is expected. The movement is tending to 1.1430-1.1450.

An alternative could be a decrease in the EUR/USD currency pair to 1.1260-1.1230.

The GBP/USD currency pair

Technical indicators of the currency pair:
  • Prev Open: 1.25710
  • Open: 1.25966
  • % chg. over the last day: +0.17
  • Day’s range: 1.25840 – 1.26903
  • 52 wk range: 1.1466 – 1.3516

GBP/USD quotes show a pronounced uptrend. The British pound has approached the $1.27 mark. The 1.2610 level is already a “mirror” support. The demand for risky assets is still high. At the moment, financial market participants have taken a wait-and-see attitude before labor statistics in the US for May. We recommend opening positions from key levels.

The news feed on the UK economy is calm today.

GBP/USD

Indicators signal the power of buyers: the price has fixed above 50 MA and 100 MA.

The MACD histogram is in the positive zone and above the signal line, which gives a strong signal to buy GBP/USD.

Stochastic Oscillator is near the overbought zone, the %K line has crossed the %D line. There are no signals at the moment.

Trading recommendations
  • Support levels: 1.2610, 1.2525, 1.2480
  • Resistance levels: 1.2685, 1.2750, 1.2800

If the price fixes above 1.2685, further growth of GBP/USD quotes is expected. The movement is tending to 1.2750-1.2780.

An alternative could be a decrease in the GBP/USD currency pair to 1.2560-1.2530.

The USD/CAD currency pair

Technical indicators of the currency pair:
  • Prev Open: 1.34964
  • Open: 1.34962
  • % chg. over the last day: -0.01
  • Day’s range: 1.34621 – 1.35126
  • 52 wk range: 1.2949 – 1.4668

USD/CAD quotes continue to consolidate. There is no defined trend. At the moment, the local support and resistance levels are 1.3460 and 1.3520, respectively. We expect the release of reports on the labor market in the United States and Canada. We also recommend paying attention to the dynamics of “black gold” prices. Positions should be opened from key levels.

The News Feed on Canada’s Economy:
  • – Data on the labor market of Canada at 15:30 (GMT+3:00);
  • – Ivey PMI at 17:00 (GMT+3:00).
USD/CAD

Indicators do not give accurate signals: the price has crossed 50 MA.

The MACD histogram has started declining, which indicates the development of bearish sentiment.

Stochastic Oscillator is near the oversold zone, the %K line has crossed the %D line. There are no signals at the moment.

Trading recommendations
  • Support levels: 1.3460, 1.3400
  • Resistance levels: 1.3520, 1.3585, 1.3675

If the price fixes below 1.3460, a further drop in USD/CAD quotes is expected. The movement is tending to the round level of 1.3400.

An alternative could be the growth of the USD/CAD currency pair to 1.3560-1.3600.

The USD/JPY currency pair

Technical indicators of the currency pair:
  • Prev Open: 108.869
  • Open: 109.147
  • % chg. over the last day: +0.22
  • Day’s range: 109.044 – 109.427
  • 52 wk range: 101.19 – 112.41

Purchases still prevail on the USD/JPY currency pair. The trading instrument has updated local highs again. At the moment, USD/JPY quotes are testing the resistance level of 109.40. The 109.10 mark is already a “mirror” support. Further growth of the USD/JPY currency pair is possible. We recommend paying attention to the report on the US labor market. Positions should be opened from key levels.

The news feed on Japan’s economy is calm.

USD/JPY

Indicators signal the power of buyers: the price has fixed above 50 MA and 100 MA.

The MACD histogram is in the positive zone, indicating the bullish sentiment.

Stochastic Oscillator is near the overbought zone, the %K line has crossed the %D line. There are no signals at the moment.

Trading recommendations
  • Support levels: 109.10, 108.85, 108.60
  • Resistance levels: 109.40, 110.00

If the price fixes above 109.40, further growth of the USD/JPY quotes is expected. The movement is tending to 110.00-110.20.

An alternative could be a decrease in the USD/JPY currency pair to 108.80-108.50.

by JustForex

Investors Expect Reports on the Labor Market of the US and Canada

by JustForex

The US dollar has continued to decline against a basket of currency majors. The US currency is under pressure due to weak economic data. Thus, initial jobless claims increased again and counted to 1,877K, which exceeded the expectations of experts who predicted 1,800K. Investors expect the publication of reports on the US and Canadian labor markets. Yesterday, the dollar index (#DX) updated local lows again and closed in the negative zone (-0.62%).

The single currency has been growing relative to a basket of currencies after the ECB meeting. Following the meeting, the regulator announced that it had expanded the Pandemic Emergency Purchase Program (PEPP) by 600 billion euros, and also reported that it would continue to buy assets under the PEPP at least until the end of June 2021. At the same time, the ECB has kept key interest rates at the same level.

The “black gold” prices have been growing. Currently, futures for the WTI crude oil are testing the $38.10 mark per barrel.

Market indicators

Yesterday, there was the bearish sentiment in the US stock market: #SPY (-0.26%), #DIA (-0.06%), #QQQ (-0.70%).

The 10-year US government bonds yield has grown again. At the moment, the indicator is at the level of 0.85-0.86%.

The news feed on 2020.06.05:
  • – US labor market data at 15:30 (GMT+3:00);
  • – Data on the labor market of Canada at 15:30 (GMT+3:00);
  • – Ivey PMI in Canada at 17:00 (GMT+3:00).

by JustForex

Is the EUR/USD to re-test 1.1000 if NFP’s are solid?

By Admiral Markets

Source: Economic Events June 5, 2020 – Admiral Markets’ Forex Calendar

While the EUR/USD kept its bullish momentum after the sustainable break above 1.1000, which has laid the path up to 1.1200 as an initial target, so today could be the starting point of a corrective move back towards 1.1000.

This could be driven by today’s Non-Farm Payrolls report. While the data is expected to come in at -8 million, Wednesday’s ADP employment report leaves some room for optimism: while private businesses in the US fired 2.76 million workers in May, figures nevertheless beat the market forecasts of a 9 million drop.

Still, the EU commission’s proposal of a 750 Billion-Euro fiscal stimulus package with 500 billion Euro in grants and 250 billion in loans can be considered a first step toward a transfer union, leaving the Euro with an overall bullish tendency. That might be especially true, after the ECB boosted the size of its PEPP program yesterday to 1.35 trillion Euros with being set to run through at least the end of June 2021.

That said, a corrective move in the EUR/USD finds a solid support and potential Long-trigger around 1.1000, the breakout region, with the overall target above 1.1200/30 around 1.1400/50 staying active.

Source: Admiral Markets MT5 with MT5SE Add-on EUR/USD Daily chart (between April 5, 2019, to June 4, 2020). Accessed: June 4, 2020, at 10:00pm GMT – Please note: Past performance is not a reliable indicator of future results, or future performance.

In 2015, the value of the EUR/USD fell by 10.2%, in 2016, it fell by 3.2%, in 2017, it increased by 13.92%, 2018, it fell by 4.4%, 2019, it fell by 2.2%, meaning that after five years, it was down by 7.3%.

Discover the world’s #1 multi-asset platform

Admiral Markets offers professional traders the ability to trade with a custom, upgraded version of MetaTrader 5, allowing you to experience trading at a significantly higher, more rewarding level. Experience benefits such as the addition of the Market Heat Map, so you can compare various currency pairs to see which ones might be lucrative investments, access real-time trading data, and so much more. Click the banner below to start your FREE download of MT5 Supreme Edition!

Download MetaTrader 5 and begin trading today!

Disclaimer: The given data provides additional information regarding all analysis, estimates, prognosis, forecasts or other similar assessments or information (hereinafter “Analysis”) published on the website of Admiral Markets. Before making any investment decisions please pay close attention to the following:

  1. This is a marketing communication. The analysis is published for informative purposes only and are in no way to be construed as investment advice or recommendation. It has not been prepared in accordance with legal requirements designed to promote the independence of investment research, and that it is not subject to any prohibition on dealing ahead of the dissemination of investment research.
  2. Any investment decision is made by each client alone whereas Admiral Markets shall not be responsible for any loss or damage arising from any such decision, whether or not based on the Analysis.
  3. Each of the Analysis is prepared by an independent analyst (Jens Klatt, Professional Trader and Analyst, hereinafter “Author”) based on the Author’s personal estimations.
  4. To ensure that the interests of the clients would be protected and objectivity of the Analysis would not be damaged Admiral Markets has established relevant internal procedures for prevention and management of conflicts of interest.
  5. Whilst every reasonable effort is taken to ensure that all sources of the Analysis are reliable and that all information is presented, as much as possible, in an understandable, timely, precise and complete manner, Admiral Markets does not guarantee the accuracy or completeness of any information contained within the Analysis. The presented figures refer that refer to any past performance is not a reliable indicator of future results.
  6. The contents of the Analysis should not be construed as an express or implied promise, guarantee or implication by Admiral Markets that the client shall profit from the strategies therein or that losses in connection therewith may or shall be limited.
  7. Any kind of previous or modeled performance of financial instruments indicated within the Publication should not be construed as an express or implied promise, guarantee or implication by Admiral Markets for any future performance. The value of the financial instrument may both increase and decrease and the preservation of the asset value is not guaranteed.
  8. The projections included in the Analysis may be subject to additional fees, taxes or other charges, depending on the subject of the Publication. The price list applicable to the services provided by Admiral Markets is publicly available from the website of Admiral Markets.

Leveraged products (including contracts for difference) are speculative in nature and may result in losses or profit. Before you start trading, you should make sure that you understand all the risks

By Admiral Markets

Why Bitcoin is likely to soar in value: deVere CEO

By George Prior

– Bitcoin – already one of the year’s best-performing assets – is likely to “soar in value” this year with central banks’ money printing agendas and a spike in public interest.

This is the bullish comment from the CEO of deVere Group, one of the world’s largest financial advisory and fintech organzsations.

It follows a wider positive investor sentiment regarding the leading cryptocurrency. This week Bloomberg analysts said in a note that it could jump to $20,000 in 2020.

Mr Green affirms: “Bitcoin price is already up around 30% from the beginning of the year, putting it on track to be one of the year’s best-performing assets.

“I believe it would be surprising not to see Bitcoin soar in value further throughout this year for three key reasons.

“First, the massive money-printing, or quantitative easing, programmes currently being rolled-out by central banks around the globe devalue traditional currencies and provide a boost for other recognised stores of value, such as Bitcoin and gold.

“Second, the global health emergency has been accelerating the demand and need for digital money.

“And third is that it is a legitimate hedge against longer-term inflation concerns.”

He continues: “Globally, we have seen client interest in Bitcoin, and other cryptocurrencies such as ETH, spike since the beginning of May.

“There’s been about a 25% month-on-month jump in enquiries about deVere Crypto, our crypto exchange app.

“We largely attribute this to the pandemic collectively focusing minds on readjusting to a new world.

“Of course, our lives in this new era, which was on its way but which has been ushered in faster due to Covid-19, will be increasingly tech-driven.  This includes our financial lives, meaning digital currencies such as Bitcoin, amongst other fintech [financial technology] solutions.”

Geopolitical risks, including the heightening of U.S.-China tensions, Brexit and the U.S. presidential election can also be “expected to serve as a boost for Bitcoin” says Mr Green.

“Investors will increase exposure to decentralized, non-sovereign, secure digital currencies, such as Bitcoin, to help shield them from the potential issues in traditional markets.”

The deVere CEO concludes: “2020’s global public health emergency, the record-shattering policies implemented to soothe economic downturns, political uncertainty and social unrest can be expected to drive the price of Bitcoin upwards.”

About:

deVere Group is one of the world’s largest independent advisors of specialist global financial solutions to international, local mass affluent, and high-net-worth clients.  It has a network of more than 70 offices across the world, over 80,000 clients and $12bn under advisement.