Author Archive for InvestMacro – Page 29

A few superspreaders transmit the majority of coronavirus cases

By Elizabeth McGraw, Pennsylvania State University

The coronavirus has traveled the globe, infecting one person at a time. Some sick people might not spread the virus much further, but some people infected with the SARS-CoV-2 are what epidemiologists call “superspreaders.”

Elizabeth McGraw, the director of the Center for Infectious Disease Dynamics at Pennsylvania State University, explains the evidence and why superspreaders can be crucial to a disease’s transmission.

What is a superspreader?

Early in the outbreak, researchers estimated that a person carrying SARS-CoV-2
would, on average, infect another two to three people. More recent studies have argued, however, that this number may actually be higher.

As early as January, though, there were reports out of Wuhan, China, of a single patient who infected 14 health care workers. That qualifies him as a super spreader: someone who is responsible for infecting an especially large number of other people.

Since then, epidemiologists have tracked a number of other instances of SARS-CoV-2 superspreading. In South Korea, around 40 people who attended a single church service were infected at the same time. At a choir practice of 61 people in Washington state, 32 attendees contracted confirmed COVID-19 and 20 more came down with probable cases. In Chicago, before social distancing was in place, one person that attended a dinner, a funeral and then a birthday party was responsible for 15 new infections.

During any disease outbreak, epidemiologists want to quickly figure out whether superspreaders are part of the picture. Their existence can accelerate the rate of new infections or substantially expand the geographic distribution of the disease.

What are the characteristics of a superspreader?

Whether someone is a superspreader or not will depend on some combination of the pathogen, the patient’s biology and their environment or behavior.

Some infected individuals might shed more virus into the environment than others if their immune system has trouble subduing the invader. Additionally, asymptomatic individualsup to 50% of all those who get COVID-19 – will continue their normal activities, inadvertently infecting more people. Even people who ultimately do show symptoms are capable of transmitting the virus during a pre-symptomatic phase.

A person’s behaviors, travel patterns and degree of contact with others can also contribute to superspreading. An infected shopkeeper might come in contact with a large number of people and goods each day. An international business traveler may crisscross the globe in a short period of time. A sick health care worker might come in contact with large numbers of people who are especially susceptible, given the presence of other underlying illnesses.

Public protests – where it’s challenging to keep social distance and people might be raising their voices or coughing from tear gas – are conducive to superspreading.

How big a part of COVID-19 are superspreaders?

Several recent preprint studies, which haven’t yet been peer-reviewed, have shed light on the role of superspreading in COVID-19’s dispersion around the globe.

Researchers in Hong Kong examined a number of disease clusters by using contact tracing to track down everyone with whom individual COVID-19 patients had interacted. In the process, they identified multiple situations where a single person was responsible for as many as six or eight new infections.

The researchers estimated that only 20% of all those infected with SARS-CoV-2 were responsible for 80% of all local transmission. Importantly, they also showed that these transmission events were associated with people who had more social contacts – beyond just family members – highlighting the need to rapidly isolate people as soon as they test positive or show symptoms.

Another study by researchers in Israel took a different approach. They compared the genetic sequences of coronavirus samples from patients inside the country to those from other places. Based on how different the genomes were, they could identify each time SARS-CoV-2 entered Israel and then follow how it spread domestically.

These scientists estimated that 80% of community transmission events – one person spreading the coronavirus to another – could be tracked back to just 1-10% of sick individuals.

And when another research group modeled the variation in how many other SARS-CoV-2 infections a single infected person tends to cause, they also found there were occasionally individuals who were very infectious. These people accounted for over 80% of transmissions in a population.

When have superspreaders played a key role in an outbreak?

Officials quarantined ‘Typhoid’ Mary Mallon in a hospital.
Wikimedia Commons

There are a number of historical examples of superspreaders. The most famous is Typhoid Mary, who in the early 20th century purportedly infected 51 people with typhoid through the food she prepared as a cook.

During the last two decades, superspreaders have started a number of measles outbreaks in the United States. Sick, unvaccinated individuals visited densely crowded places like schools, hospitals, airplanes and theme parks where they infected many others.

Superspreaders have also played a key role in the outbreaks of other coronaviruses, including SARS in 2003 and MERS in 2015. For both SARS and MERS, superspreading mainly occurred in hospitals, with scores of people being infected at a time.

Can superspreading occur in all infectious diseases?

Yes. Researchers have identified superspreaders in outbreaks of diseases caused by bacteria, such as tuberculosis, as well as those caused by viruses, including measles and Ebola. Just as appears to be the case with the coronavirus, some scientists estimate that in an outbreak of any given pathogen, 20% of the population is usually responsible for causing over 80% of all cases of the disease.

The good news is that the right control practices specific to how pathogens are transmitted – hand-washing, masks, quarantine, vaccination, reducing social contacts and so on – can slow the transmission rate and halt a pandemic.

This is an updated version of an article originally published on Jan. 30, 2020.

About the Author:

Elizabeth McGraw, Professor of Entomology and Director of the Center for Infectious Disease Dynamics, Pennsylvania State University

This article is republished from The Conversation under a Creative Commons license. Read the original article.


Japanese Candlesticks Analysis 09.06.2020 (USDCAD, AUDUSD, USDCHF)

Article By RoboForex.com

USDCAD, “US Dollar vs Canadian Dollar”

As we can see in the H4 chart, the descending tendency continues. By now, USDCAD has formed another Hammer pattern not far from the support level. However, considering that the current downtrend is really active, the price is not expected to reverse. Most likely, in the nearest future, the pair may correct for a while and then resume trading downwards to reach 1.3300.

USDCAD
Risk Warning: the result of previous trading operations do not guarantee the same results in the future

AUDUSD, “Australian Dollar vs US Dollar”

As we can see in the H4 chart, after breaking another resistance level, AUDUSD is still trading upwards. By now, it has formed a Shooting Star pattern. At the moment, the price is expected to reverse and form a slight correction towards 0.6945. In the future, the pair is expected to resume the rising tendency. In this case, the upside target may be at 0.7085.

AUDUSD
Risk Warning: the result of previous trading operations do not guarantee the same results in the future

USDCHF, “US Dollar vs Swiss Franc”

As we can see in the H4 chart, USDCHF has formed several reversal patterns, such as Hammer, while trading not far from the support area. At the moment, the pair is reversing. The upside target is 0.9628. However, there might be another scenario, according to which the instrument may break the support level and continue trading downwards. In this case, the downside target may be at 0.9525.

USDCHF

Article By RoboForex.com

Attention!
Forecasts presented in this section only reflect the author’s private opinion and should not be considered as guidance for trading. RoboForex LP bears no responsibility for trading results based on trading recommendations described in these analytical reviews.

Ichimoku Cloud Analysis 09.06.2020 (GBPUSD, USDCAD, AUDUSD)

Article By RoboForex.com

GBPUSD, “Great Britain Pound vs US Dollar”

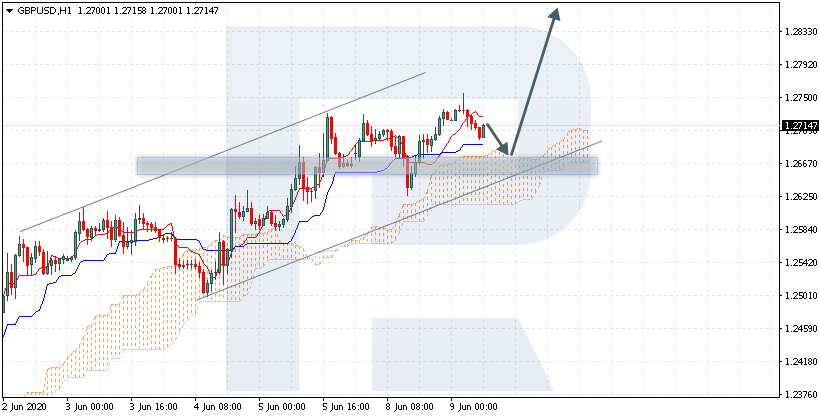
GBPUSD is trading at 1.2714; the instrument is moving above Ichimoku Cloud, thus indicating an ascending tendency. The markets could indicate that the price may test the cloud’s upside border at 1.2670 and then resume moving upwards to reach 1.2845. Another signal in favor of further uptrend will be a rebound from the rising channel’s downside border. However, the bullish scenario may no longer be valid if the price breaks the cloud’s downside border and fixes below 1.2585. In this case, the pair may continue falling towards 1.2495.

GBPUSD
Risk Warning: the result of previous trading operations do not guarantee the same results in the future

USDCAD, “US Dollar vs Canadian Dollar”

USDCAD is trading at 1.3387; the instrument is moving below Ichimoku Cloud, thus indicating a descending tendency. The markets could indicate that the price may test the cloud’s downside border at 1.3425 and then resume moving downwards to reach 1.3275. Another signal in favor of further downtrend will be a rebound from the descending channel’s upside border. However, the bearish scenario may no longer be valid if the price breaks the cloud’s upside border and fixes above 1.3505. In this case, the pair may continue growing towards 1.3595.

USDCAD
Risk Warning: the result of previous trading operations do not guarantee the same results in the future

AUDUSD, “Australian Dollar vs US Dollar”

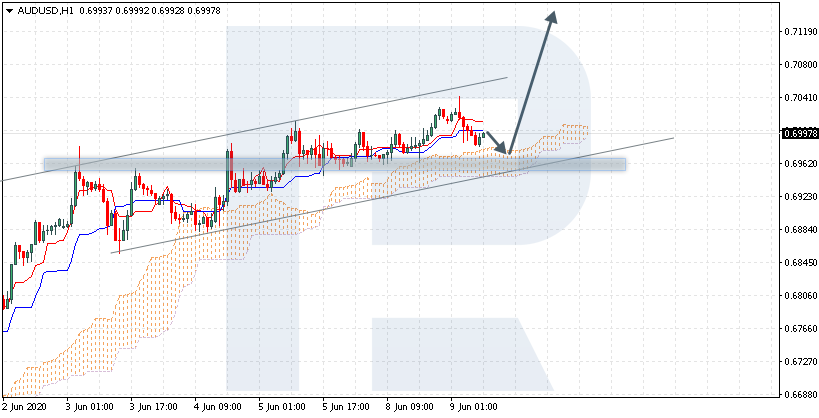
AUDUSD is trading at 0.6997; the instrument is moving above Ichimoku Cloud, thus indicating an ascending tendency. The markets could indicate that the price may test the cloud’s upside border at 0.6995 and then resume moving upwards to reach 0.7105. Another signal in favor of further uptrend will be a rebound from the rising channel’s downside border. However, the bullish scenario may no longer be valid if the price breaks the cloud’s downside border and fixes below 0.6920. In this case, the pair may continue falling towards 0.6830.

AUDUSD

Article By RoboForex.com

Attention!
Forecasts presented in this section only reflect the author’s private opinion and should not be considered as guidance for trading. RoboForex LP bears no responsibility for trading results based on trading recommendations described in these analytical reviews.

Currency Majors Have Become Stable. Investors Expect the Fed Meeting

by JustForex

Currency majors have become stable after a significant rally last week. Financial market participants have started partially fixing positions before the Fed meeting, which will be held tomorrow. As experts forecast, the regulator will keep the key marks of monetary policy unchanged. We recommend paying attention to the comments by representatives of the Central Bank.

According to preliminary data, in the first quarter, Eurozone GDP will decline by 3.6% (q/q) compared to market expectations of 3.8%. Investors expect up-to-date information regarding the conflict between Washington and Beijing.

The “black gold” prices are consolidating. Currently, futures for the WTI crude oil are testing the $37.85 mark per barrel. At 23:30, API weekly crude oil stock will be published.

Market indicators

Yesterday, there was the bullish sentiment in the US stock market: #SPY (+1.21%), #DIA (+1.75%), #QQQ (+0.78%).

The 10-year US government bonds yield has fallen again. At the moment, the indicator is at the level of 0.82-0.83%.

The news feed on 2020.06.09:
  • – JOLTS job openings at 17:00 (GMT+3:00).

by JustForex


26% of clients now seek responsible ESG investments: deVere

By George Prior

More than a quarter of all clients are currently considering or are already actively engaged in responsible and sustainable investing, reveals one of the world’s largest independent financial advisory and fintech organizations.

deVere Group reports that since the beginning of May, 26% of clients around the world are eyeing exposure to or are now part of the environmental, social and governance (ESG) “megatrend.”

The CEO and founder, Nigel Green notes: “The fundamentals that ESG investing represent and champion have become more highly valued by investors than ever before in the last few months.

“Why? It is the Covid-19 effect, which has shifted the values of our society.

“The global pandemic has brought into laser-like focus how the health of our planet affects human health which, in turn, affects the way we all live and work.

“These shifts in values and new economic realities have meant that companies’ responses to the public health emergency are being carefully scrutinised by investors in terms of their social and governance policies too.

“These include employees’ rights, consumer protections, board diversity, corporate transparency and stakeholder accountability.

“Firms which have responded well and which have strong ESG credentials are being rewarded by investors.

“Indeed, responsible investing funds secured historic levels of capital in the first quarter of 2020, despite the extreme jitters of traditional markets.”

But, says Mr Green, it isn’t all about values and conscience. It’s also about profits.

“ESG funds continue to out-perform the wider market and typically have lower volatility over the long-term.  Naturally, investors are being increasingly attracted to the market-beating returns.”

Of the 26% finding, Mr Green says that this figure is only set to grow.  “As millennials, who are statistically more likely to seek responsible investment options, become the major beneficiaries of the largest intergenerational transfer of wealth – an estimated $30tn in the next few years – we can expect both retail and institutional investors to continue to pile into ESG.”

Last month, the deVere CEO said alongside technology, ESG investing is the “investment megatrend of the decade.”

He noted: “It’s often said in investing that a ‘trend is a friend.’ A megatrend is likely, therefore, to be your best friend.

“Megatrends – like the advancing technology and the search for purposeful profits through ESG funds – affect how we live every day, therefore they impact global markets and investor outcomes.”

Mr Green concludes: “There’s no doubt that once a ‘quirk’, ESG investing is becoming increasingly mainstream.”

About:

deVere Group is one of the world’s largest independent advisors of specialist global financial solutions to international, local mass affluent, and high-net-worth clients.  It has a network of more than 70 offices across the world, over 80,000 clients and $12bn under advisement.


The Big Jobs Number and How to Trade It – Part II

By TheTechnicalTraders

In the first part of this research article, we attempting to highlight how the huge jobs number shocked the market into a big upside price move on Friday, June 5, 2020, and how the underlying data continues to suggest we have quite a bit of work to do before the US economy supports current stock market price levels.  In this second part of our research article, we’ll continue to share data and charts that we believe paint a very real picture for skilled technical traders.

The huge upside price rally in the US stock market after the 2.5 million jobs number was posted at 8:30 am pushed the stock market higher by 3.5%+.  This is an incredible rally in terms of how primed the stock market was for this type of great news.  Yet, as we continue to try to suggest, we are still moderately cautious of this rally in terms of sustainability after the destruction to the US and the global economy as a result of the COVID-19 virus event.

Our researchers believe the current numbers may be slightly skewed because of the extreme contraction event that took place over the past 60+ days.  Additionally, many of these numbers are calculated using a modeling system that attempts to normalize outlier data.  Currently, with the markets pushing well into a bullish territory and the NASDAQ reaching new all-time highs, we can’t argue that the US stock market appears to want to move higher on any news (good or bad).

Before you continue, be sure to opt-in to our free market trend signals before closing this page, so you don’t miss our next special report!

NASDAQ (NQ) E-MINI FUTURES DAILY

This NQ Daily chart highlights the incredible rally we’ve seen in the tech-heavy NASDAQ.  After recovering nearly 50% from the March lows, the NQ began to set up an upward sloping wedge formation near the middle of April.  This tightening wedge formation has apex’ed recently just as we got the new jobs number today.

In an unbelievable upside price rally, the NQ is now trading at the highest levels EVER.  After 38 million jobs lost, the US economy operating at only a fraction of what it was in January, huge consumer displacement factors, and thousands of pending solvency issues – hey, why not push the NASDAQ up to new all-time highs.  This makes no sense to us at the moment.

NAS100/GC DAILY RATIO CHART

The reality is that this incredible rally in the stock market may have already become a speculator “bubble” – a euphoric over-reaction to the deep decline related to the COVID-19 virus event.  Earnings and future revenues typically drive valuation growth higher.  Take a look at this NAS100 to Gold ratio chart to understand what has really happened in the markets over the past 4+ years.  The peak in values in October 2018 coincided with the US Fed action to raise interest rates which prompted a massive decline in the US stock markets throughout the end of 2018.  Near Christmas, 2018, the markets bottomed and began to rally higher.  Notice the peak in 2019 was not higher than the peak in 2018?  This suggests the real valuation peak in the market coincided with the peak Fed Funds Rate level in October 2018.

Additionally, the downward price channel that has setup in this ratio chart suggests the wild trending in the markets while Gold has pushed moderately higher has prompted a sideways pennant/flag formation.   The previous peak, in early 2020, and the current peak are well above the upper pennant level – this suggests an over-exaggeration of price advancement.  This type of ratio activity is very reminiscent of 2005 to 2007 – where the stock market rallied and gold rallied, eventually leading to the breakdown in the stock market in 2008-09 and a much deeper breakdown in this ratio.

US ISM NON-MANUFACTURING BUSINESS ACTIVITY INDEX

The current economic data does not support a US stock market rallying to new all-time highs – unless you attempt to account for investor over-enthusiasm and exuberance.  The business activity data over the past few months have shown the deepest decline over the past 20+ years.  There has never been a print of this indicator below 30, ever, except April 2020.  Even at the height of the 2008-09 housing/credit market crisis or the 911 terrorist attacks, US businesses continued to operate at moderate levels.

(Source: https://www.investing.com/economic-calendar/ism-non-manufacturing-business-activity-1484 )

US UNEMPLOYMENT RATE MONTHLY

The unemployment rates are still far higher than at any time in over 70+ years – everything is fine.  Why not push the stock market price levels higher by another 20 to 25% – right?  These people will eventually find work somewhere – sometime??  The consumers will eventually re-engage in the economy and push income and revenue levels higher – but not right now.

(Source: https://www.investing.com/economic-calendar/unemployment-rate-300 )

US ISM MANUFACTURING INDEX MONTHLY

The ISM Manufacturing Index suggests manufacturers are operating 25 to 45% or below capacity levels from early January/February 2020.  This will translate into bottom-line revenue data in the near future and likely result in much lower forward earnings guidance.

(Source: https://www.investing.com/economic-calendar/ism-manufacturing-pmi-173 )

Our continued warnings may go unheeded by the masses – and maybe we are wrong.  Yet we continue to advise our clients to be very cautious of this upside price rally as we believe the technical factors driving this market are skewed.  Speculators and investors are caught up in an elated buying phase when real data suggests more moderate price valuations.  We are still very concerned about the risks of a breakdown in the markets related to a sudden shift in trader/speculator thinking.

Very similar to the enthusiasm of 2006 to 2008, traders can sometimes fall into a trap that expectations do not correlate with real data/technicals – and this can be dangerous.  If you play these upside moves very cautiously and target the best asset for your investment objectives, you can do very well while this rally pushes higher.  Yet, you also have to be very aware of the risks of a breakdown in price related to the tightening economic conditions and price channels.

YM – DOW JONES E-MINI FUTURES 30 MINUTE CHART

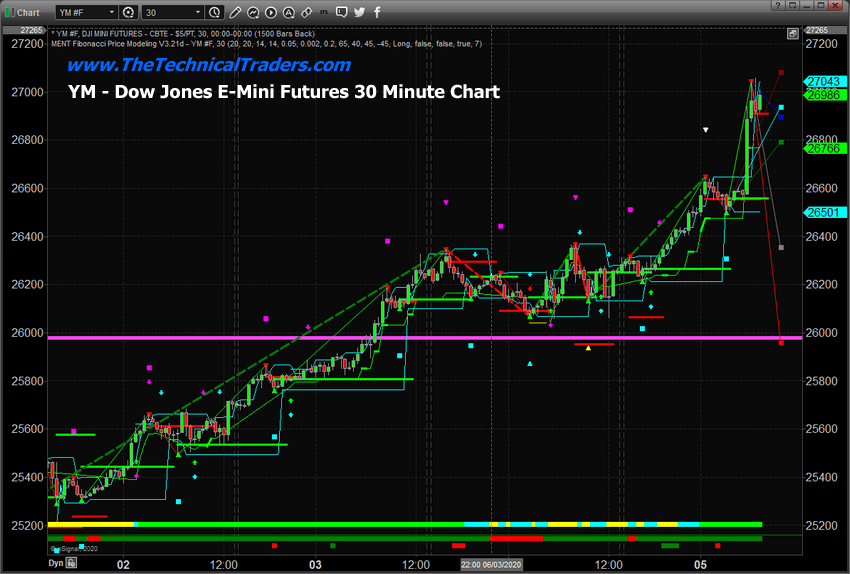
This YM 30-minute chart highlights the incredible rally that took place very early in trading on June 5, 2020 – just after the jobs number hit.  The traders and speculators want anything that seems positive after months of uncertainty related to the COVID-19 virus event.  This bias towards anything positive suggests traders will attempt to push price levels into a feeding frenzy – ignoring all risks and other data.  No Fear is an excellent description of what is happening right now in the US stock market – traders have absolutely no fear of any downside risks.  We’ve seen this before – and it usually ends badly for some people (remember the DOT COM rally?).

Concluding Thoughts

Our opinion is that traders should stay moderately cautious near these current levels.  Even though it appears the markets can do nothing wrong and speculators will likely be telling you “this is the opportunity of a lifetime – just buy anything right now”, our experience is that these types of crazy, euphoric rallies are very dangerous.  Price breakdowns come fast and hard in markets like this – they happen quickly.

Cover your open long trades with moderate stop levels.  Be picky about what you invest in and target quick gains.  Remember the market can act irrationally much longer than many people can stay whole.  The shorts are under severe pressure right now, but the data is pointing to a very different outcome in our opinion.  We urge you to stay cautious right now – this seems very similar to the exuberance that we saw in 2006-2008 – just before it all fell apart.

As a technical analyst and trader since 1997, I have been through a few bull/bear market cycles in stocks and commodities. I believe I have a good pulse on the market and timing key turning points for investing and short-term swing traders. 2020 is an incredible year for traders and investors.  Don’t miss all the incredible trends and trade setups.

Subscribers of my Active ETF Swing Trading Newsletter had our trading accounts close at a new high watermark. We not only exited the equities market as it started to roll over in February, but we profited from the sell-off in a very controlled way with TLT bonds for a 20% gain, and we closed out another winning trade on Friday.

Chris Vermeulen
Chief Market Strategies
Founder of Technical Traders Ltd.

TheTechnicalTraders.com


The Analytical Overview of the Main Currency Pairs on 2020.06.09

by JustForex

The EUR/USD currency pair

Technical indicators of the currency pair:
  • Prev Open: 1.12933
  • Open: 1.12949
  • % chg. over the last day: -0.20
  • Day’s range: 1.12552 – 1.13148
  • 52 wk range: 1.0777 – 1.1494

The EUR/USD currency pair has become stable. Investors have started partially fixing positions before the Fed meeting. The trading instrument is testing the following key support and resistance levels: 1.1250 and 1.1320, respectively. In the near future, the technical correction of EUR/USD quotes is possible after a significant rally last week. We recommend following current information regarding the conflict between Washington and Beijing. Positions should be opened from key levels.

The Economic News Feed for 2020.06.09:
  • – Preliminary data on Eurozone GDP at 12:00 (GMT+3:00);
  • – JOLTS job openings at 17:00 (GMT+3:00).
EUR/USD

Indicators do not give accurate signals: the price has fixed between 50 MA and 100 MA.

The MACD histogram has started declining, which indicates the development of the correction movement.

Stochastic Oscillator is in the oversold zone, the %K line has crossed the %D line. There are no signals at the moment.

Trading recommendations
  • Support levels: 1.1250, 1.1195, 1.1155
  • Resistance levels: 1.1320, 1.1380

If the price fixes above 1.1320, EUR/USD purchases should be considered. The movement is tending to 1.1380-1.1420.

An alternative could be a decrease in the EUR/USD currency pair to 1.1200-1.1180.

The GBP/USD currency pair

Technical indicators of the currency pair:
  • Prev Open: 1.26758
  • Open: 1.27232
  • % chg. over the last day: +0.04
  • Day’s range: 1.26592 – 1.27556
  • 52 wk range: 1.1466 – 1.3516

GBP/USD quotes have become stable after prolonged growth. Currently, the British pound is being traded in a flat. There is no defined trend. Financial market participants have taken a wait-and-see attitude before the Fed meeting. The key range is 1.2635-1.2740. In the near future, a technical correction of the trading instrument is possible. We recommend opening positions from key levels.

The news feed on the UK economy is calm today.

GBP/USD

Indicators do not give accurate signals: the price has crossed 50 MA.

The MACD histogram is near the 0 mark.

Stochastic Oscillator is near the oversold zone, the %K line has crossed the %D line. There are no signals at the moment.

Trading recommendations
  • Support levels: 1.2635, 1.2585, 1.2500
  • Resistance levels: 1.2740, 1.2800

If the price fixes above 1.2740, further growth of GBP/USD quotes is expected. The movement is tending to 1.2800-1.2830.

An alternative could be a decrease in the GBP/USD currency pair to 1.2580-1.2550.

The USD/CAD currency pair

Technical indicators of the currency pair:
  • Prev Open: 1.34098
  • Open: 1.33753
  • % chg. over the last day: -0.10
  • Day’s range: 1.33598 – 1.34565
  • 52 wk range: 1.2949 – 1.4668

The USD/CAD currency pair has been growing. The trading instrument has updated local highs. The loonie is currently consolidating in the range of 1.3400-1.3465. In the near future, the technical correction of USD/CAD quotes is possible after a prolonged fall. We recommend paying attention to the dynamics of “black gold” prices. Positions should be opened from key levels.

Today, the publication of important economic releases from Canada is not expected.

USD/CAD

Indicators do not give accurate signals: the price has crossed 50 MA.

The MACD histogram has started growing, which indicates the development of bullish sentiment.

Stochastic Oscillator is in the overbought zone, the %K line has crossed the %D line. There are no signals at the moment.

Trading recommendations
  • Support levels: 1.3400, 1.3360
  • Resistance levels: 1.3465, 1.3530, 1.3570

If the price fixes above 1.3465, further growth of USD/CAD quotes is expected. The movement is tending to 1.3530-1.3570.

An alternative could be a decrease in the USD/CAD currency pair to 1.3360-1.3320.

The USD/JPY currency pair

Technical indicators of the currency pair:
  • Prev Open: 109.589
  • Open: 108.434
  • % chg. over the last day: -1.09
  • Day’s range: 107.793 – 108.543
  • 52 wk range: 101.19 – 112.41

There are aggressive sales on the USD/JPY currency pair. During yesterday’s and today’s trading sessions, the drop in quotes exceeded 170 points. The trading instrument has set new local lows. At the moment, USD/JPY quotes are consolidating in the range of 107.90-108.25. The yen has the potential for further growth against the greenback. Positions should be opened from key levels.

The news feed on Japan’s economy is calm.

USD/JPY

Indicators signal the power of sellers: the price has fixed below 100 MA.

The MACD histogram is in the negative zone, indicating the bearish sentiment.

Stochastic Oscillator is in the neutral zone, the %K line has started crossing the %D line. There are no signals at the moment.

Trading recommendations
  • Support levels: 107.90, 107.60, 107.40
  • Resistance levels: 108.25, 108.55

If the price fixes below 107.90, a further drop in USD/JPY quotes is expected. The movement is tending to 107.60-107.40.

An alternative could be the growth of the USD/JPY currency pair to 108.50-108.80.

by JustForex

Forex Technical Analysis & Forecast 08.06.2020

Article By RoboForex.com

EURUSD, “Euro vs US Dollar”

After finishing another ascending structure at 1.1380, EURUSD is correcting downwards to reach 1.1270. Possibly, the pair may reach this level and then grow towards, thus forming a new consolidation range between these two levels. If later the price breaks the range to the downside, the market may fall to reach 1.1174; if to the upside – resume trading upwards with the target at 1.1400.

EURUSD
Risk Warning: the result of previous trading operations do not guarantee the same results in the future

GBPUSD, “Great Britain Pound vs US Dollar”

GBPUSD is trading upwards. Today, the pair may reach 1.2740 or even extend this ascending structure up to 1.2770. After that, the instrument may start a new decline with the target at 1.2615.

GBPUSD
Risk Warning: the result of previous trading operations do not guarantee the same results in the future

USDRUB, “US Dollar vs Russian Ruble”

USDRUB is falling to reach 67.55. Later, the market may resume growing to break 68.40 and then continue the correction towards 70.00. After that, the instrument may resume trading inside the downtrend.

USDRUB
Risk Warning: the result of previous trading operations do not guarantee the same results in the future

USDJPY, “US Dollar vs Japanese Yen”

USDJPY is correcting towards 109.35. Possibly, the pair may reach this level and then form one more ascending structure with the target at 110.10. Later, the market may start another correction towards 108.77.

USDJPY
Risk Warning: the result of previous trading operations do not guarantee the same results in the future

USDCHF, “US Dollar vs Swiss Franc”

USDCHF is still growing towards 0.9666. After that, the instrument may start a new correction with the target at 0.9600.

USDCHF
Risk Warning: the result of previous trading operations do not guarantee the same results in the future

AUDUSD, “Australian Dollar vs US Dollar”

AUDUSD is growing towards 0.7020. Possibly, the pair may reach this level and then start another correction to break 0.6926. Later, the market may continue falling with the target at 0.6787.

AUDUSD
Risk Warning: the result of previous trading operations do not guarantee the same results in the future

BRENT

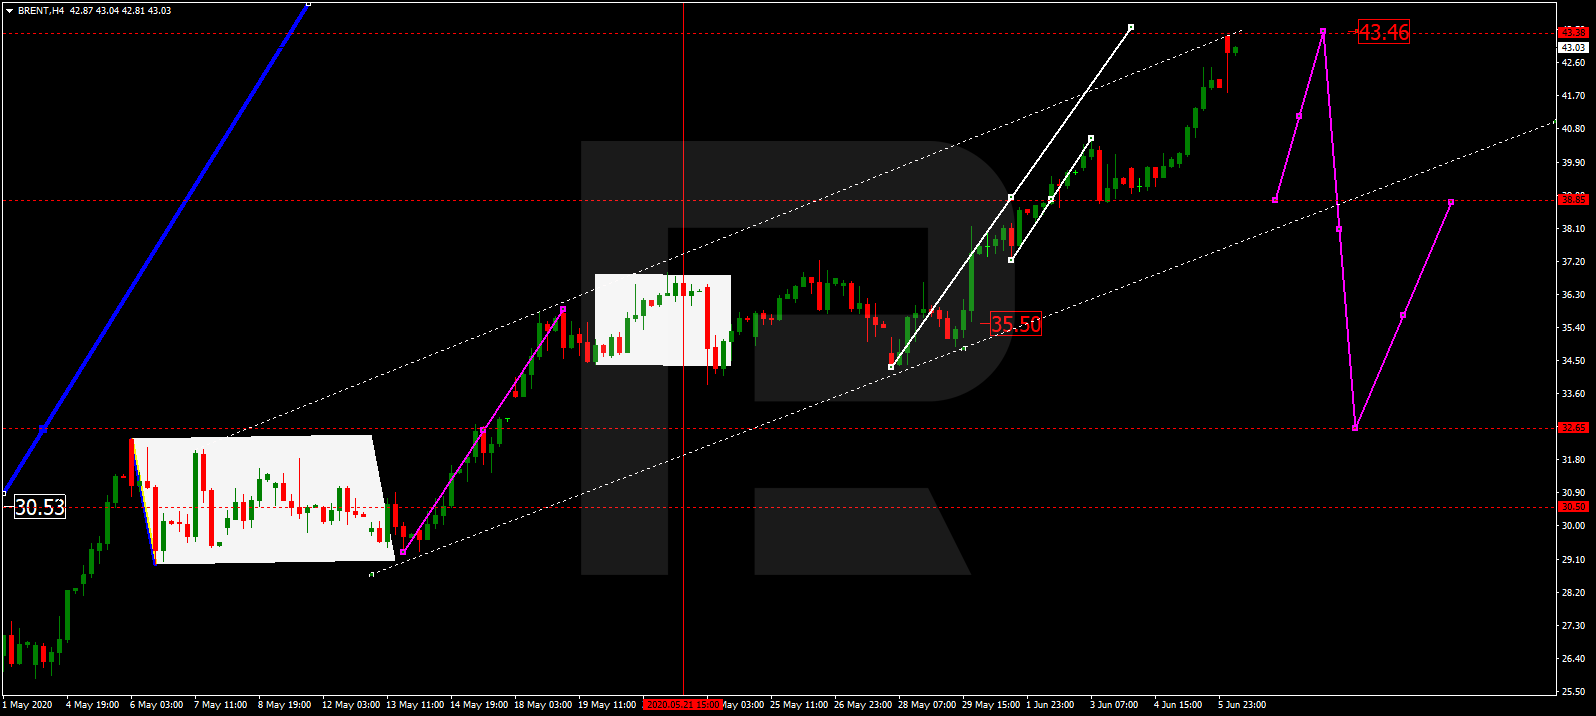
Brent is still growing towards 43.46. After that, the instrument may correct to break 38.85 and then continue falling with the target at 33.00. Later, the market may resume trading upwards to reach 45.50.

BRENT
Risk Warning: the result of previous trading operations do not guarantee the same results in the future

XAUUSD, “Gold vs US Dollar”

Gold is correcting to test 1690.37 from below. Later, the market may continue forming the third descending wave with the target at 1658.25. After that, the instrument may start another growth to return to 1690.40 and then resume trading downwards to reach 1600.00.

GOLD
Risk Warning: the result of previous trading operations do not guarantee the same results in the future

BTCUSD, “Bitcoin vs US Dollar”

After completing the ascending wave at 9700.00, BTCUSD is consolidating around this level. If later the price breaks the range to the upside, the market may continue the correction to reach 10000.00; if to the downside – resume trading downwards with the target at 9100.00.

BITCOIN
Risk Warning: the result of previous trading operations do not guarantee the same results in the future

S&P 500

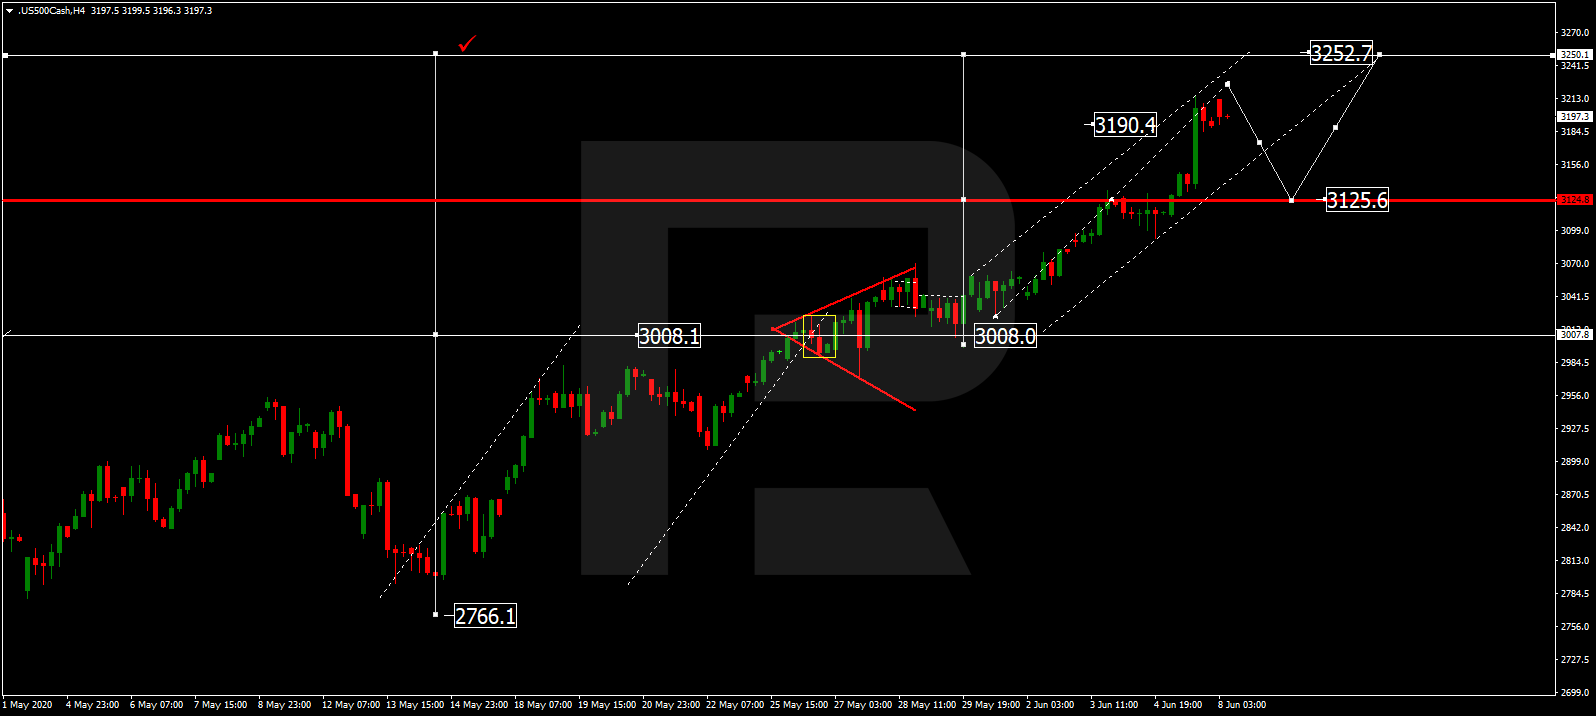
The Index has completed the ascending wave at 319.4; right now, it is consolidating near the highs. Possibly, today the asset may fall to reach 3125.5 and then form one more ascending structure with the target at 3252.7.

S&P 500

Article By RoboForex.com

Attention!
Forecasts presented in this section only reflect the author’s private opinion and should not be considered as guidance for trading. RoboForex LP bears no responsibility for trading results based on trading recommendations described in these analytical reviews.

Fibonacci Retracements Analysis 08.06.2020 (GOLD, USDCHF)

Article By RoboForex.com

XAUUSD, “Gold vs US Dollar”

As we can see in the H4 chart, the divergence prevented XAUUSD from updating the high at 1764.86 and made the pair start a new decline, which has already reached 23.6% fibo. The next downside targets may be 38.2%, 50.0%, and 61.8% fibo at 1645.06, 1607.83, and 1570.90 respectively.

GOLD_H4
Risk Warning: the result of previous trading operations do not guarantee the same results in the future

In the H1 chart, the local convergence made the pair start a new growth, which has already reached 23.6% fibo. The next upside targets may be 38.2% and 50.0% fibo at 1699.00 and 1707.75 respectively. The support is the low at 1670.60.

GOLD_H1
Risk Warning: the result of previous trading operations do not guarantee the same results in the future

USDCHF, “US Dollar vs Swiss Franc”

As we can see in the H4 chart, after breaking the downside border of the Triangle pattern, USDCHF attempted to re-test 50.0% fibo. At the same time, after the local convergence, the pair has started a strong rising impulse to break the resistance at 23.6% fibo (0.9730). if it succeeds, the market may reach the high at 0.9901. However, one shouldn’t exclude another scenario, according to which the instrument may continue falling towards 61.8% fibo at 0.9453.

USDCHF_H4
Risk Warning: the result of previous trading operations do not guarantee the same results in the future

In the H1 chart, after the convergence, the pair has reached 38.2% fibo. The next rising impulse will be heading towards 50.0% and 61.8% fibo at 0.9663 and 0.9692 respectively. The local support is the low at 0.9542.

USDCHF_H1

Article By RoboForex.com

Attention!
Forecasts presented in this section only reflect the author’s private opinion and should not be considered as guidance for trading. RoboForex LP bears no responsibility for trading results based on trading recommendations described in these analytical reviews.

Surprise Jobs Number and What It Means For Your Positions

By TheTechnicalTraders 

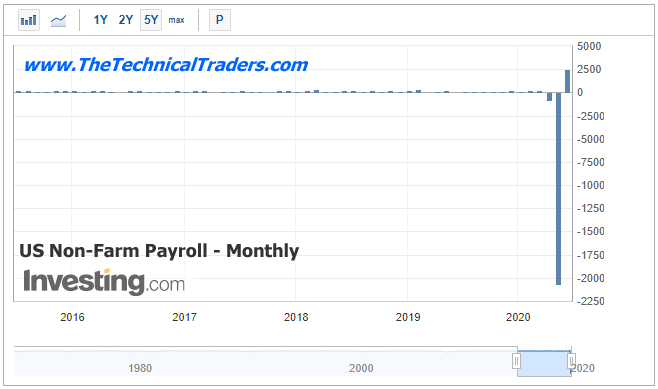
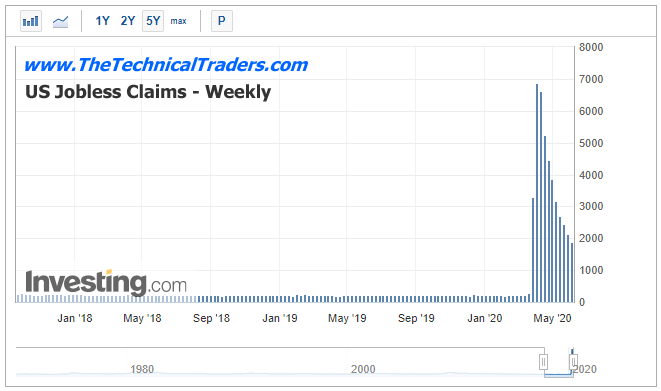
– The Huge Non-Farm Payroll number released on Friday, June 5th, shocked the market.  A massive 2.5 million jobs were created in May 2020.  If you were paying attention to the data, you’ll also understand that 1.87 million new jobless claims just last week.  In fact, over the month of May 2020, a total of 12.58 million jobless claims were filed.  Taken into consideration, the new jobs created in May represent less than 20% of the total job losses over the same span of time.

Our researchers believe the jobs number is representative of a phased reopening of many US states and correlates directly with the extended opportunity for further re-engagement of the US economy over time.  The current social unrest taking place throughout the US will likely result in a new spike in COVID-19 cases as well as extended losses for certain businesses.

The rioting seems to be taking place in more populated states right now – which suggests some real concerns for many of these states in regards to scheduled reopening phases and the potential for a spike in COVID-19 cases.

Before you continue, be sure to opt-in to our free market trend signals 
before closing this page, so you don’t miss our next special report!

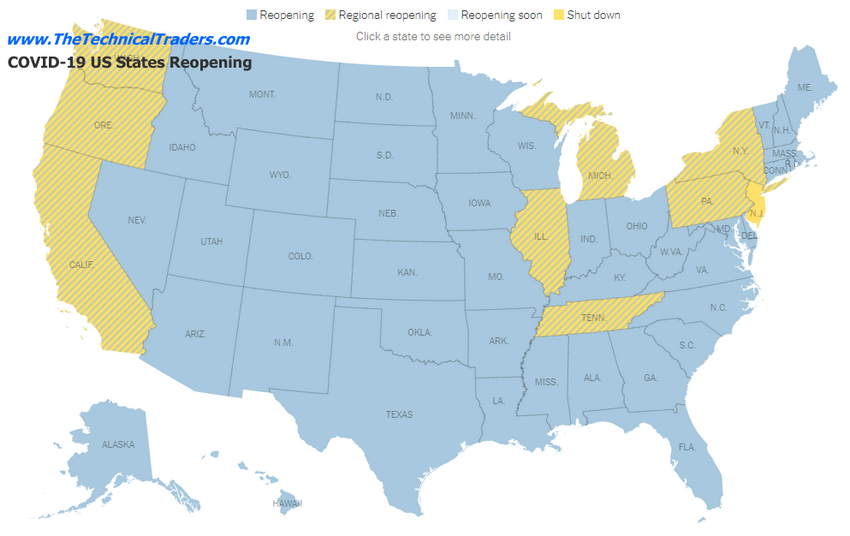
US MAP – STATES REOPENING STATUS

As you can see from the US map, below, the number of states that have started to reopen over the past 30+ days exceeds the number of states still shutdown or partially open.  Our researchers believe the migration of the protesters from state to state as well as the continued unrest throughout the US may prompt a new spike in COVID-19 cases – particularly within states that have had the highest transmission rates and are more populated than other states.

US NON-FARM PAYROLL MONTHLY

The May 2020 Non-Farm Payroll number is a welcome positive surge after many months of negative data.  Still, as we suggested near the start of this article, the 2.5 million new jobs created did not offset the 12.58 million jobs lost in May 2020.  Anyone capable of doing simple accounting can figure out that we need to see more continued new job creation levels to begin to offset the massive layoffs and job losses as a result of the COVID-19 shutdown event.

The US Stock market is hungry for any positive news right now, so the markets look at this data as a very positive sign that a recovery will happen and could be a stupendous opportunity for future growth.  Our researchers are still very cautious about this recovery simply because the underlying data is still very negative overall.

US JOBLESS CLAIMS – WEEKLY

As you can see from this Weekly Jobless Claims chart, below, the spike in new jobless claims happened in early April 2020 with 6.86 million new jobless.  Since then, the number of new jobless has continued at levels greater than 2 million per week and have slowly been decreasing.  We are aware that many states are reducing state and educational employment budgets as a result of the COVID-19 virus event.  These budget cuts and layoffs may continue throughout all of 2020 and into 2021 unless a strong recovery event takes place before the end of 2020.

State budgets and the continued risks of a COVID-19 case spike present very real concerns in the minds of our researchers as we have just begun the initial reopening phases for many states.  If our presumptions are correct, the social unrest and rioting may prompt a major spike in COVID-19 cases across many states and present a very real extended shutdown event that could last well into late-Summer.

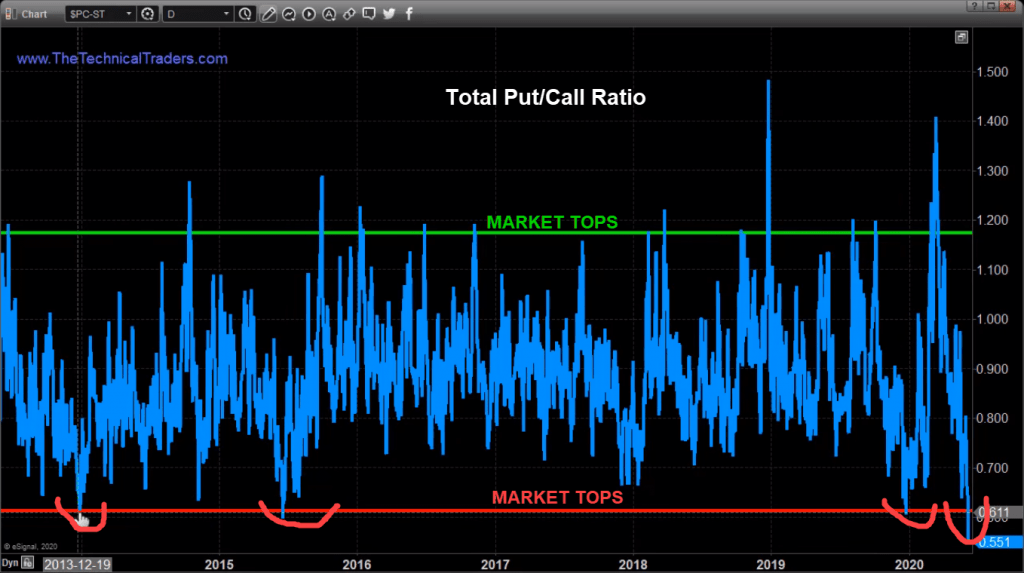
PUT/CALL RATIO – DAILY

This next chart suggests there is “No Fear” in the markets right now as investors pile into the long trades.  This Put/Call ratio chart highlights one simple fact that the market can stay irrational for much longer than many traders can handle.

The Fed intrusion into the markets on March 20, 2020, created a bullish foundation in the markets.  Traders have piled into this bullish trend over the past 45+ days and this Put/Call chart highlights how extended the rally has gotten recently.  Normally, the extremely low levels on the Put/Call chart would suggest a massive market top setup is about to happen – yet, traders may push the markets further into an irrational bullish phase with their exuberance.

We put together a short yet detailed video that will open your eyes to what the market data and charts are pointing to. If you are short the market of having FOMO (Fear Of Missing Out) on this rally be sure to click and watch this video right after you finish this article.

Concluding Thoughts:

The reason we stay cautiously related to this bullish price trend in the US stock market is that we believe technical patterns have already set up that suggest a downward price cycle must complete before the bottom in the markets is settled.  In Part II of this article, we’ll go over additional charts and data to help you plan for and prepare for the next big move in the markets.

If the markets are able to push much higher after today’s big jobs number, we urge all long/bullish traders to lock in gains with protective stops and to adopt a very cautious outlook going forward.  It appears the markets have over-extended this rally and we are still very concerned that a sudden breakdown in price will happen.

As a technical analyst and trader since 1997, I have been through a few bull/bear market cycles in stocks and commodities. I believe I have a good pulse on the market and timing key turning points for investing and short-term swing traders. 2020 is an incredible year for traders and investors.  Don’t miss all the incredible trends and trade setups.

Subscribers of my Active ETF Swing Trading Newsletter had our trading accounts close at a new high watermark. We not only exited the equities market as it started to roll over in February, but we profited from the sell-off in a very controlled way with TLT bonds for a 20% gain. This week we closed out SPY ETF trade taking advantage of this bounce and entered a new trade with our account is at another all-time high value.

Ride my coattails as I navigate these financial markets and build wealth while others watch most of their retirement funds drop another 35-65% during the rest of this financial crisis going into late 2020 and early 2021.

Just think of this for a minute. While most of us have active trading accounts, what is even more important are our long-term investment and retirement accounts. Why? Because they are, in most cases, our largest store of wealth other than our homes, and if they are not protected during the next bear market, you could lose 25-50% or more of your net worth. The good news is we can preserve and even grow our long term capital when things get ugly like they are now and ill show you how. One of the best trades is one your financial advisor will never let you do because they do not make money from the trade/position but we do have a way for you or your advisor can take advantage of the market gyrations with our Technical Wealth Advisor investing signals.

If you have any type of retirement account and are looking for signals when to own equities, bonds, or cash, be sure to become a member of my Passive Long-Term ETF Investing Signals which we issued a new signal for subscribers.

Chris Vermeulen
Chief Market Strategies
Founder of Technical Traders Ltd.

TheTechnicalTraders.com